

Sundry Photography
By The Valuentum Team
Dividend Aristocrat Abbott Laboratories (NYSE:ABT) is one of our favorite healthcare names, with a long storied history dating all the way back to its incorporation in 1900. We’re huge fans of its product line-up that ranges from gastroenterology and women’s health products, laboratory systems, and diagnostics flow testing products to infant formula including the brand Similac and medical devices for the heart and beyond. Despite its fantastic portfolio, Abbott still remains acquisitive as it seeks to continue to diversify its product portfolio across its four reportable segments: Established Pharmaceutical Products, Diagnostic Products, Nutritional Products, and Medical Devices.
Though we generally view acquisitions by strong and exciting dividend payers such as Abbott in a cautious light because it adds leverage to the balance sheet, the company has a strong integration track record, as witnessed through the effective integration of St. Jude Medical (which Abbott acquired in 2017) with Abbott’s operations over the past several years. The deal, in particular, offered Abbott considerable growth opportunities as it absorbed top revenue-producing segments including STJ’s ‘Heart Failure’ and ‘Traditional CRM’ segments. The COVID-19 pandemic saw demand for Abbott’s diagnostics offerings surge.
Abbott’s dividend increases in recent years have been quite substantial, and the company yields a very nice 1.7% at the time of this writing. At Valuentum, we calculate what we call a Dividend Cushion ratio for every general industrial company in our coverage universe. The Dividend Cushion Cash Flow Bridge, shown in the image below, illustrates the components of the Dividend Cushion ratio and highlights in detail the many drivers behind it. Abbott’s Dividend Cushion Cash Flow Bridge reveals that the sum of the company’s 5-year cumulative free cash flow generation, as measured by cash flow from operations less all capital spending, plus its net cash/debt position on the balance sheet, as of the last fiscal year, is greater than the sum of the next 5 years of expected cash dividends paid.
The Dividend Cushion Cash Flow Bridge combines forward-looking analysis with a company’s financial health to assess dividend coverage (Valuentum)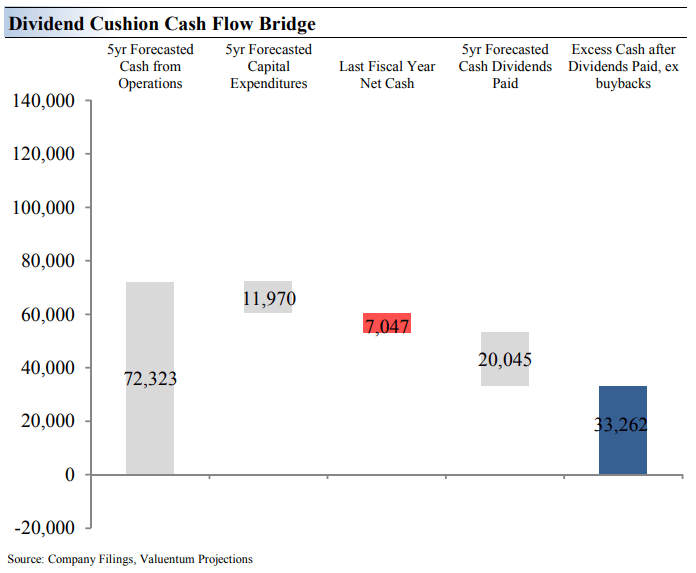
Because the Dividend Cushion ratio is forward-looking and captures the trajectory of the company’s free cash flow generation and dividend growth, it reveals whether there will be a cash surplus or a cash shortfall at the end of the 5-year period, taking into consideration the leverage on the balance sheet, a key source of risk. On a fundamental basis, we believe companies that have a strong net cash position on the balance sheet and are generating a significant amount of free cash flow are better able to pay and grow their dividend over time. Firms that are buried under a mountain of debt and do not sufficiently cover their dividend with free cash flow are more at risk of a dividend cut or a suspension of growth, all else equal, in our opinion. Generally speaking, the greater the ‘blue bar’ to the right is in the positive, the more durable a company’s dividend, and the greater the ‘blue bar’ to the right is in the negative, the less durable a company’s dividend.
Abbott’s Key Investment Considerations
Valuentum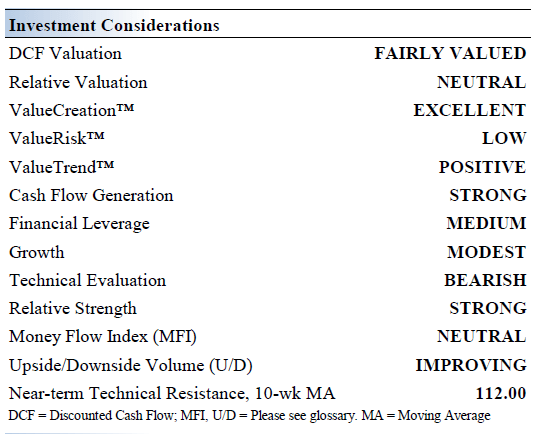
The new Abbott isn’t much different from the old Abbott (pre AbbVie spin-off), minus the blockbuster drug Humira and other members of its drug lineup. It remains aligned with favorable long-term healthcare trends in both developed and developing markets. The company is more than 125 years old. Roughly 65% of its sales are now generated outside the US.
It is estimated that more than 16% of the world’s population will be 65 or older by 2050, offering meaningful opportunities across Abbott’s portfolio. Demand for the company’s diagnostic offerings boomed during the COVID-19 pandemic and remains robust. For example, in the company’s second quarter results, global COVID-19 testing-related sales reached $2.3 billion, helping to drive revenue 10%+ higher.
Abbott acquired both Alere and St. Jude Medical in 2017, bulking up its diagnostics and medical device businesses significantly. Future acquisitions are likely as Abbott seeks to cement its market position in lucrative parts of the healthcare space while unlocking new growth opportunities. We caution that such deals are likely to be funded at least in part by debt.
Our discounted cash-flow valuation model assumes Abbott maintains strong revenue growth rates going forward while experiencing significant margin expansion, made possible in part through acquisition-related synergies. Should the firm stumble, our estimate of its intrinsic value would face significant pressure, but that may not materialize. In its second quarter report, Abbott raised its full-year 2022 EPS guidance, now projecting “full-year diluted EPS on a GAAP basis of at least $3.50 and projected adjusted diluted EPS of at least $4.90.”
Abbott has been in the headlines recently due to the problems its baby formula manufacturing operations in the U.S. are facing. That included a voluntary recall of certain baby formula products in February 2022. Abbott is working to resolve its issues on this front. It’s something investors should keep an eye on.
Abbott’s Economic Profit Analysis
The best measure of a company’s ability to create value for shareholders is expressed by comparing its return on invested capital with its weighted average cost of capital. The gap or difference between ROIC and WACC is called the firm’s economic profit spread. Abbott’s 3-year historical return on invested capital (without goodwill) is 25%, which is above the estimate of its cost of capital of 9.4%.
As such, we assign Abbott a ValueCreation rating of EXCELLENT. In the chart below, we show the probable path of ROIC in the years ahead based on the estimated volatility of key drivers behind the measure. The solid grey line reflects the most likely outcome, in our opinion, and represents the scenario that results in our fair value estimate. Abbott is a fantastic economic-value generator.
Abbott’s return on invested capital (Abbott)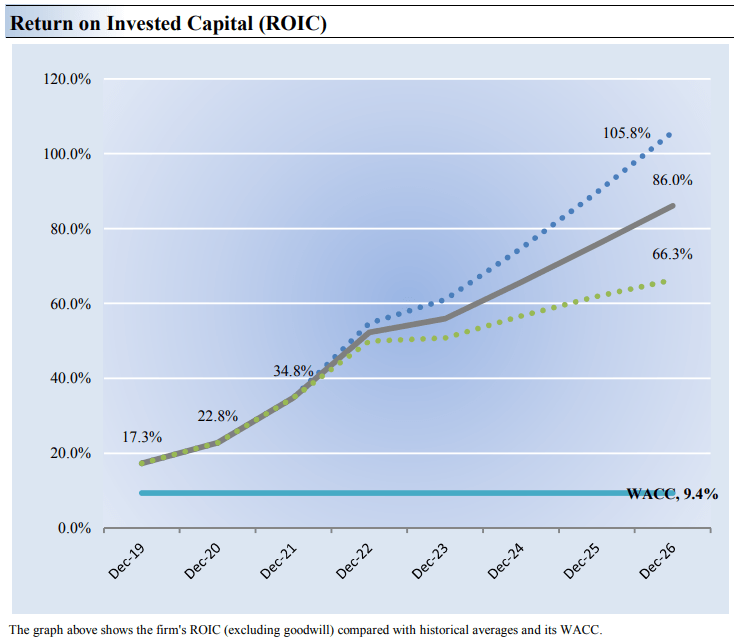
Abbott’s Cash Flow Valuation Analysis
Valuentum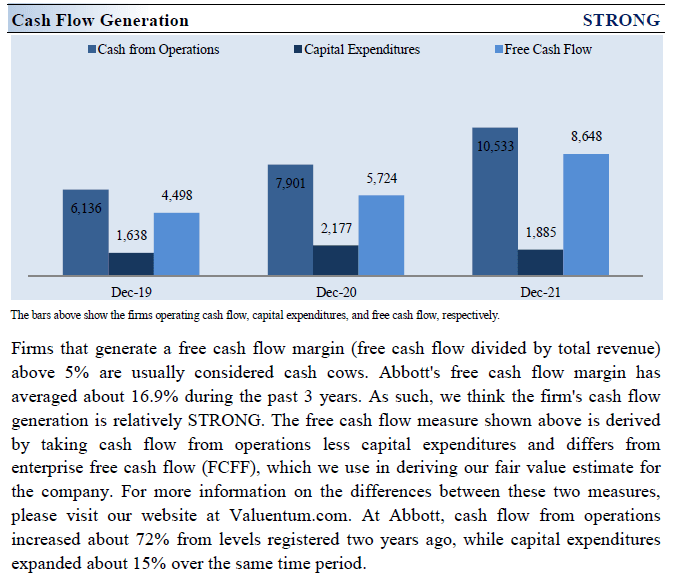
We think Abbott is worth $109 per share with a fair value range of $87.00 – $131.00. Shares are trading at about our fair value estimate at the moment. The margin of safety around our fair value estimate is driven by the firm’s LOW ValueRisk™ rating, which is derived from an evaluation of the historical volatility of key valuation drivers and a future assessment of them.
Our near-term operating forecasts, including revenue and earnings, do not differ much from consensus estimates or management guidance. Our model reflects a compound annual revenue growth rate of 3.5% during the next five years, a pace that is lower than the firm’s 3-year historical compound annual growth rate of 12.1%.
Our valuation model reflects a 5-year projected average operating margin of 27.7%, which is above Abbott’s trailing 3-year average. Beyond year 5, we assume free cash flow will grow at an annual rate of 3.4% for the next 15 years and 3% in perpetuity. For Abbott, we use a 9.4% weighted average cost of capital to discount future free cash flows.
Valuentum Valuentum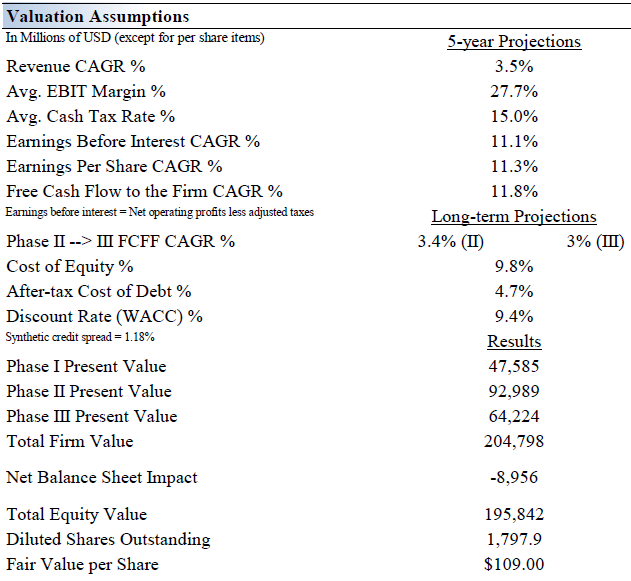
Abbott’s Margin of Safety Analysis
Valuentum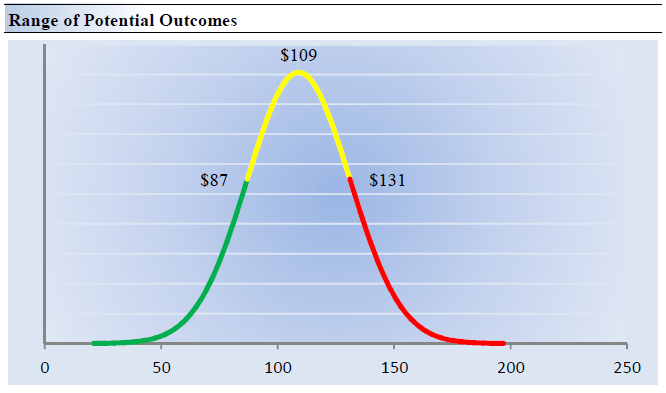
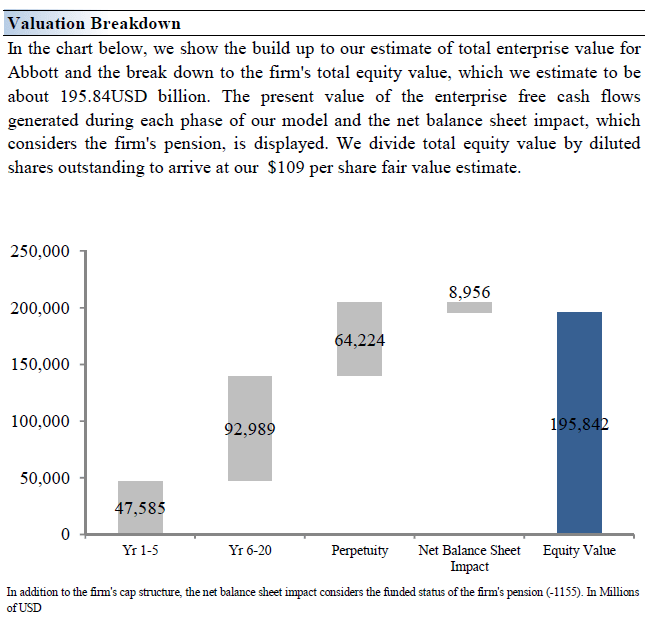
Our discounted cash flow process values each company on the basis of the present value of all future free cash flows. Although we estimate the firm’s fair value at about $109 per share, every company has a range of probable fair values that’s created by the uncertainty of key valuation drivers (like future revenue or earnings, for example). After all, if the future were known with certainty, we wouldn’t see much volatility in the markets as stocks would trade precisely at their known fair values.
This is an important way to view the markets as an iterative function of future expectations. As future expectations change, so should the company’s value and its stock price. Stock prices are not a function of fixed historical data but rather act in such a way to capture future expectations within the enterprise valuation construct. This is a key part of our book Value Trap: Theory of Universal Valuation.
Our ValueRisk rating sets the margin of safety or the fair value range we assign to each stock. In the graph above, we show this probable range of fair values for Abbott. We think the firm is attractive below $87 per share (the green line), but quite expensive above $131 per share (the red line). The prices that fall along the yellow line, which includes our fair value estimate, represent a reasonable valuation for the firm, in our opinion. Shares of Abbott are about fairly valued at the time of this writing, but it is quite the dividend growth play, in our view.
Concluding Thoughts
It is hard to find much fault with a company that has raised its dividend in each of the past ~50 years. Though Abbott has a net debt position, the company’s incredibly resilient cash flow profile combined with its ample liquidity on hand should make managing its dividend obligations and net debt position quite doable going forward. Abbott’s capital allocation priorities need to be monitored given its acquisitive history, and its share buyback programs compete for capital against its dividend payout. The company’s future dividend obligations have become much more substantial in recent years after several major payout boosts though Abbott’s Dividend Cushion ratio remains strong. Though shares are about fairly valued at the time of this writing, we like the company as a solid dividend growth idea.
This article or report and any links within are for information purposes only and should not be considered a solicitation to buy or sell any security. Valuentum is not responsible for any errors or omissions or for results obtained from the use of this article and accepts no liability for how readers may choose to utilize the content. Assumptions, opinions, and estimates are based on our judgment as of the date of the article and are subject to change without notice.
Be the first to comment