

Douglas Rissing
CPI is Too Hot
The Consumer Price Index (CPI) numbers are still red hot given the year-over-year inflation rate was 8.2% for September. Even the Fed has given up on the notion that inflation is merely transitory. The latest September numbers were up 0.4%, which is 4.8% annualized. While inflation is decelerating, it still seems too high and not transitory.
Targets of the Federal Reserve vs Effective Rate (FRED)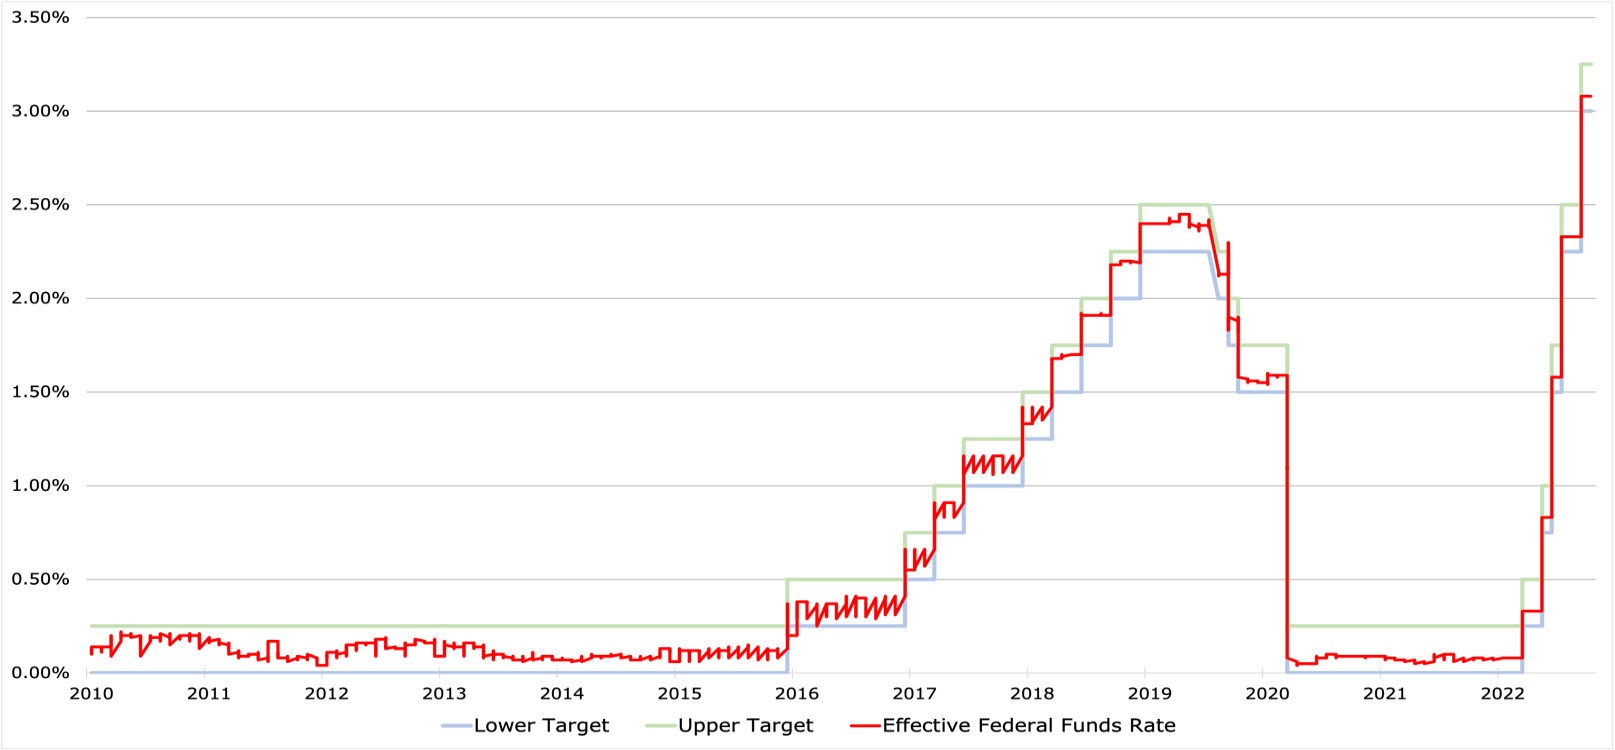
In November 2021, when it became evident that we would see an inflationary environment, the Fed began to taper $10 billion per month in Treasury purchases. This doubled in December once it became clear that inflation was spiraling faster and further than the Fed had predicted. However, please note that tapering was still QE (Quantitative Easing) and still feeding inflation even when it had become obvious that inflation was too hot. The Federal Reserve did not stop QE until April 13, 2022, when the balance sheet peaked at $8.965 Trillion, up 10X versus 2008.
While previously the Fed had telegraphed its intention to do 7 small 25 basis point hikes in 2022 in the Fed Funds Rate (FFR), we have already seen a magnitude-higher change. From early in 2022 until now, the Fed has raised rates to target 3.25%. That is a magnitude of increase higher in a single year than the Fed executed during its half-baked attempt at normalization in 2016. This is also the highest level of change we have seen in history, dwarfing that of Fed Chair Paul Volcker in the late ’70s and early ’80s.
The magnitude of change in rate hikes is historically high. (Felix Richter, Statista)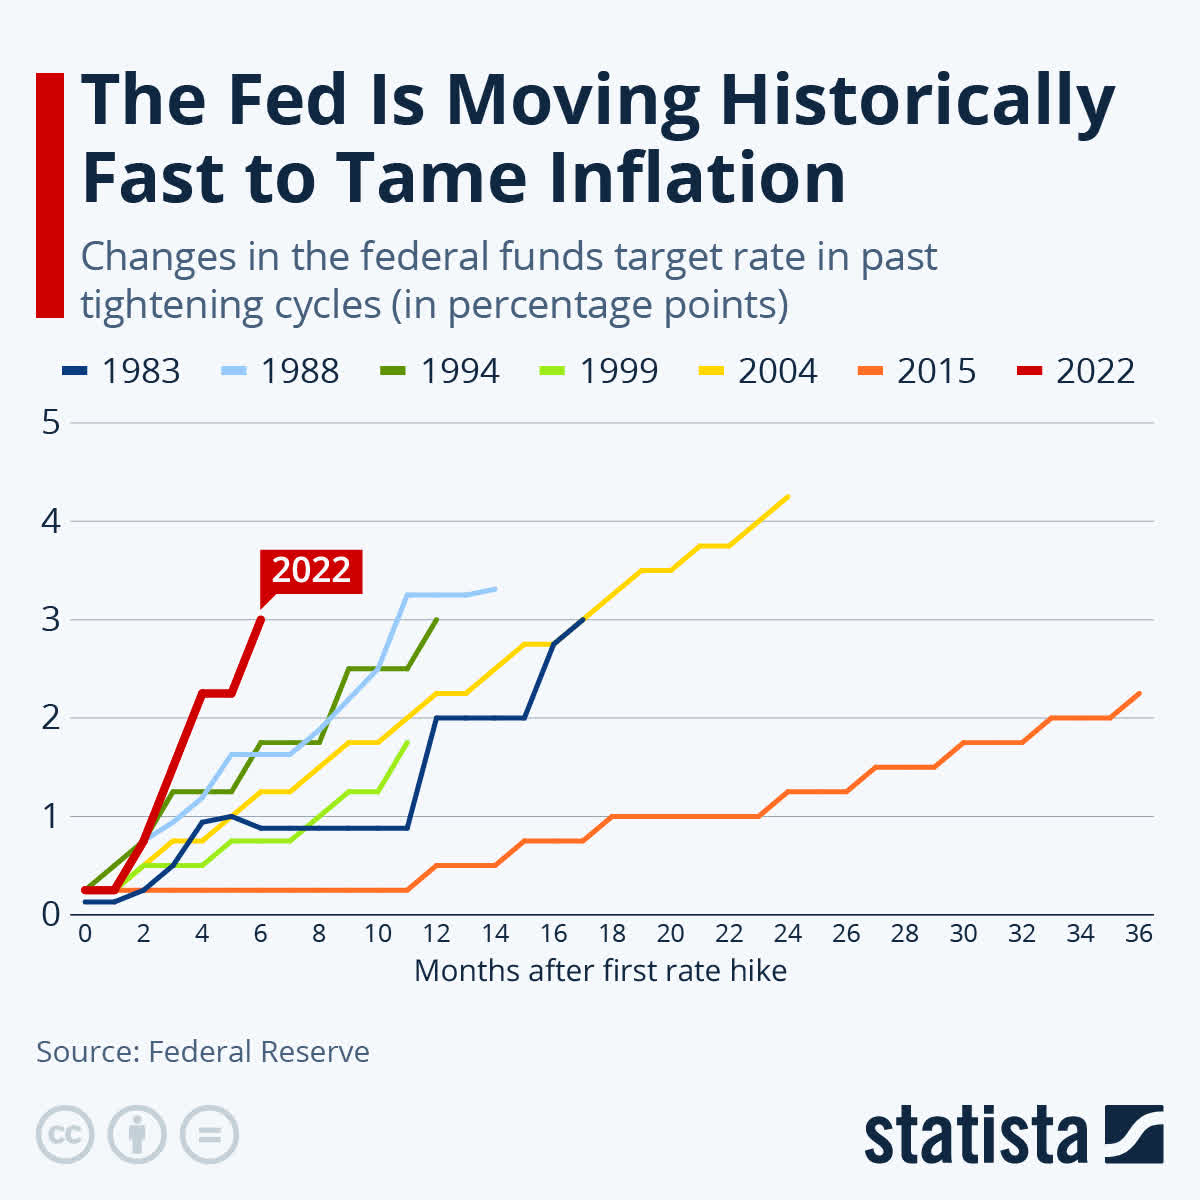
However, the consensus is that policy is still considered accommodative unless the FFR goes above inflation. As shown below, FFR is still dramatically below core CPI.
Federal Funds Rate against Core CPI (FRED)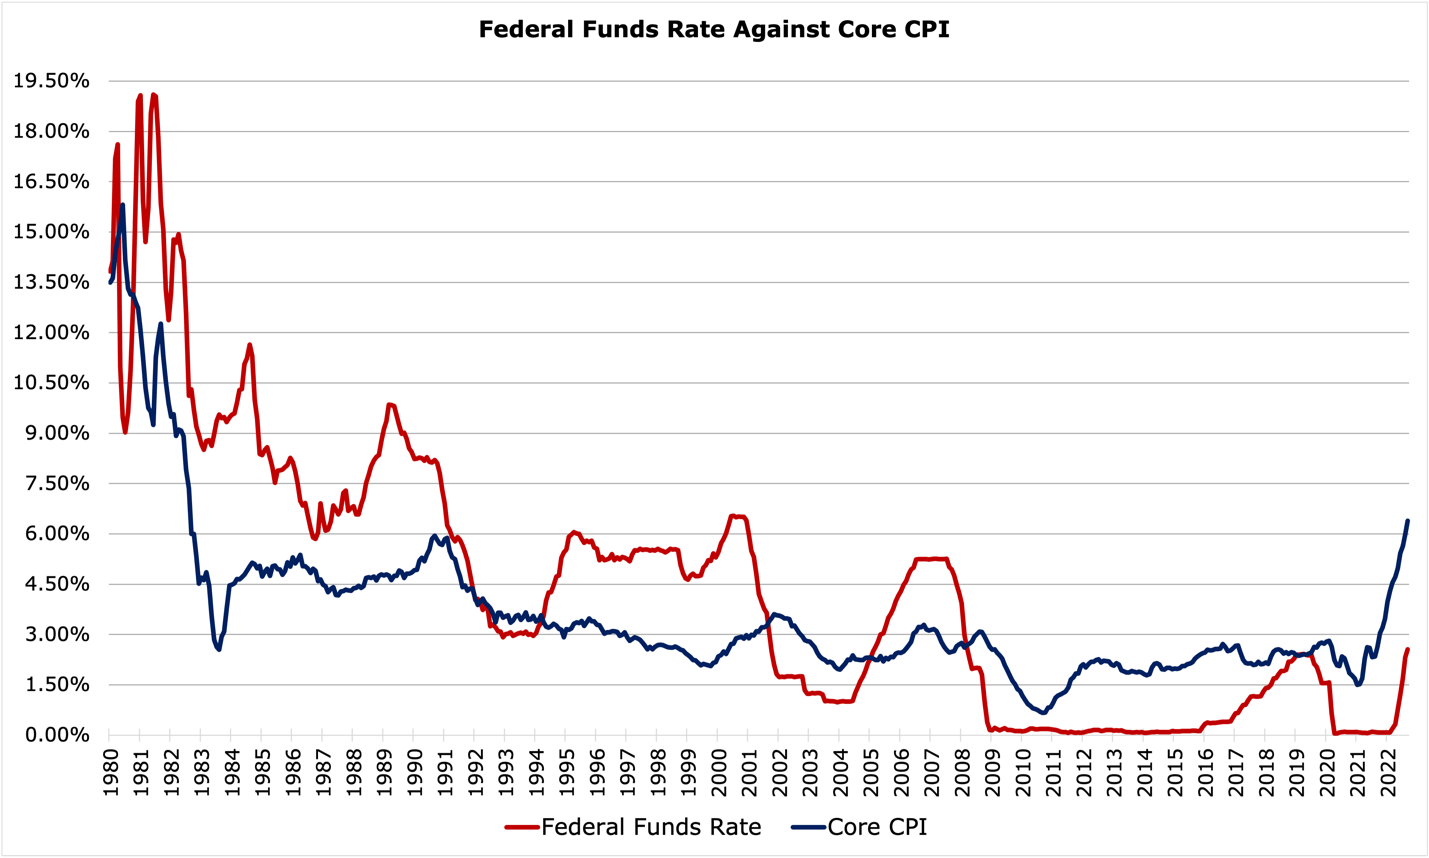
One should also note that before the 2008 Financial Crisis, FFR generally ran above Core CPI. It was only during the past 14 years, while the Fed was conducting the biggest monetary experiment in the history of the U.S. economy, namely QE, that FFR was consistently below core CPI.
In an attempt to get inflation down, the Fed announced it would begin offloading portions of the balance sheet in June, starting at a pace of $47.5 billion continuing until September. This QT (Quantitative Tightening) was implemented at a snail’s pace and did not meet promised amounts.
Fed’s balance sheet since the beginning of 2022. (H.4.1 Release)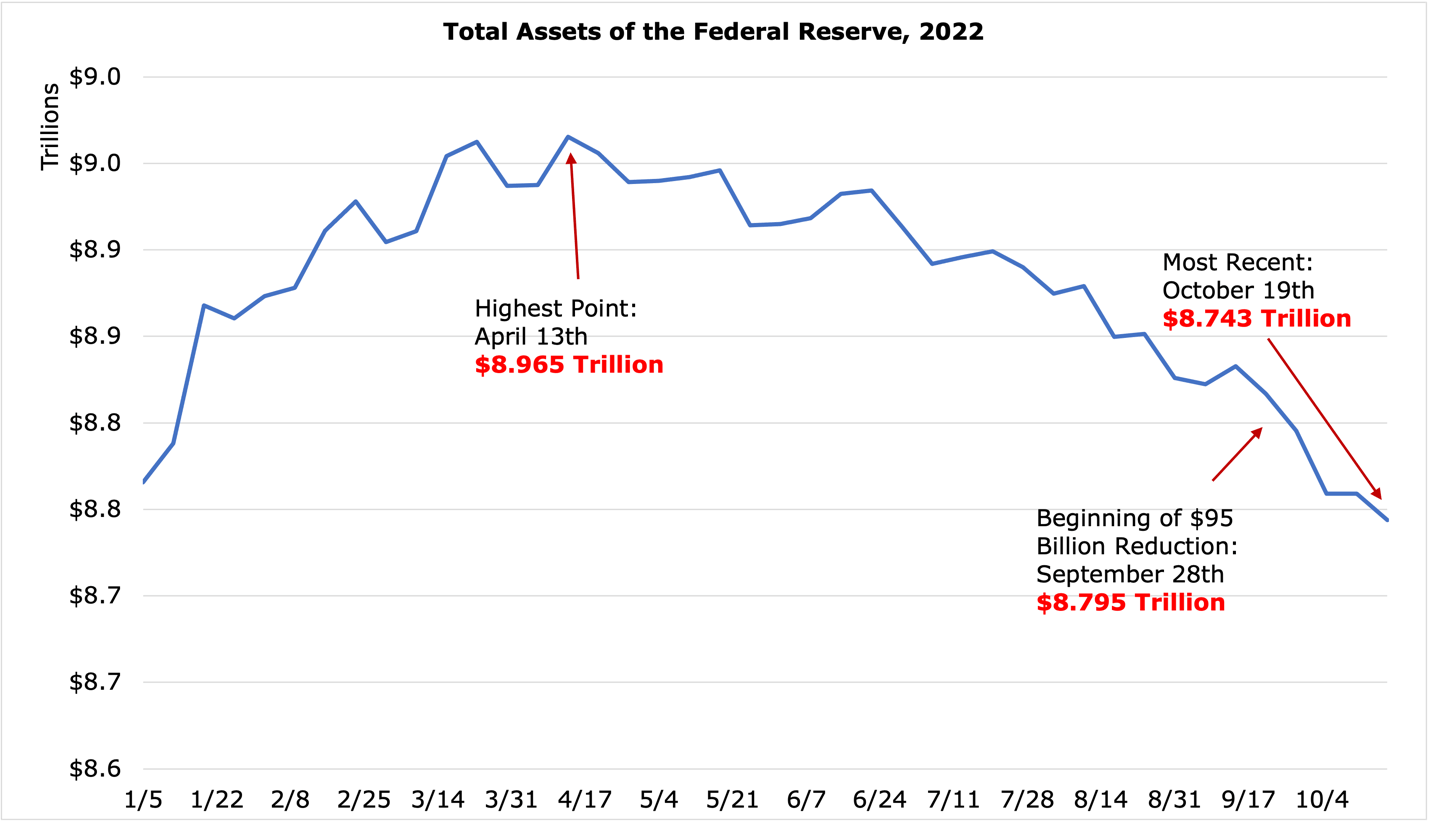
The Fed delayed starting QT repeatedly, delivering less QT from June through September and then promising to accelerate QT in September to a targeted $95 billion per month. Between August 31st and October 19th, the Fed reduced the balance sheet by $67 billion, bringing the QT total to $206 billion since April.
It has become increasingly clear that the Fed is far behind on QT. If QT were on pace as promised, the balance sheet reduction would have been $287.5 Billion not $206 Billion. Also, please note that $206 billion represents only 2.3% of the Fed’s peak balance sheet of $8.965 Trillion. 10x increase versus a 2.3% reduction. QT has not even scratched the surface yet.
How We Got Here
We have a more detailed report here, but to recap:
The Fed faced a crisis in 2008, with the accepted toolbox being deemed ineffective in countering a large over-levered banking system collapse. It opened up lending facilities to allow financial institutions to offload bad debt, which it countered by selling off Treasuries. However, by September of 2008, trying to equalize the balance sheet was no longer possible, with the crisis worsening faster than the Fed could “sterilize” its balance sheet. Instead, it borrowed a policy pioneered by the Bank of Japan – Quantitative Easing (QE). The idea of QE is that if the Fed drives up the price of bonds, yields and interest rates fall, and investors will move their money to equity and other forms of private investment so that cash is injected into the economy. An additional effect is that it provides commercial banks with increased reserves as their bonds can be easily converted into cash, preventing bank runs and reducing the interest burden on consumers.
Historical levels of the Fed’s balance sheet since mid-2006. (H.4.1 Release)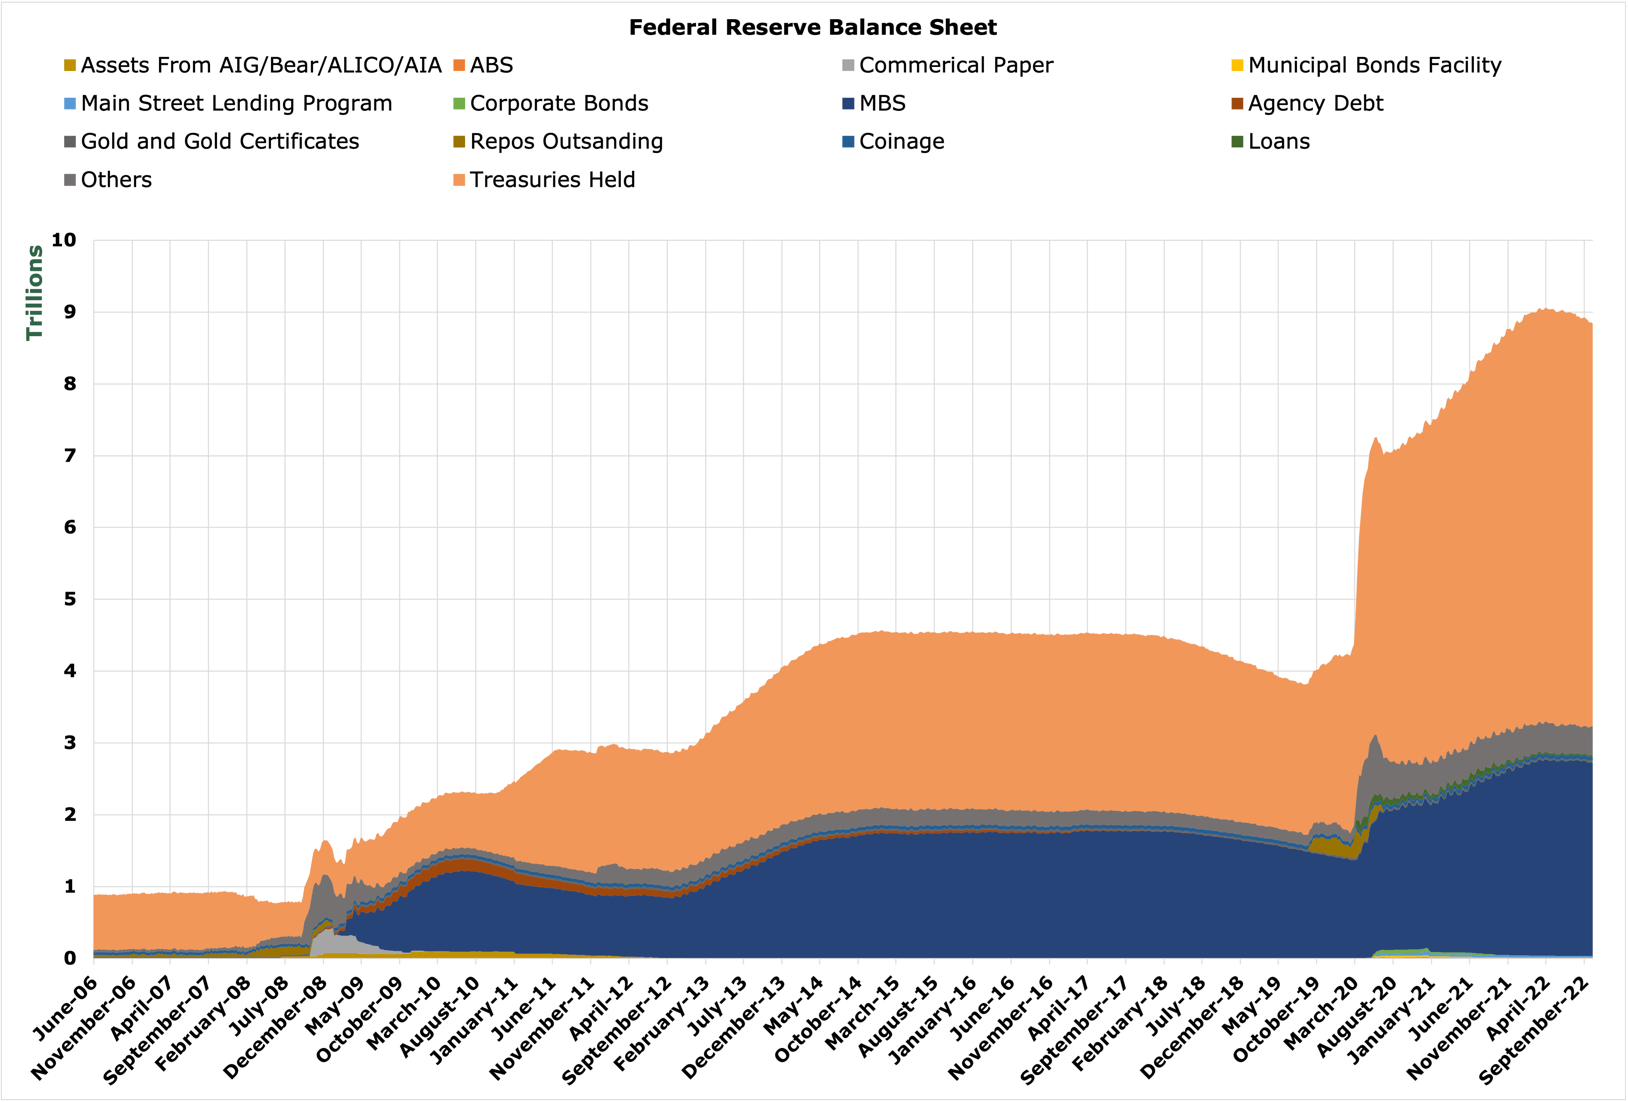
By the time the Fed finally paused QE in October of 2014, the balance sheet was $4.5 Trillion, up from $871 Billion in February 2008. Seeing the economy improving, the Fed began to unwind the balance sheet and increase rates slowly. This happened at a slower pace than markets anticipated, with rates sitting at just below 2.5% and the balance sheet remaining at a high $3.7 Trillion on the eve of the COVID pandemic and ensuing stock market collapse. The Fed inadvertently created another scenario like 2008 – their toolbox was limited with rates already so low. They were forced to balloon the balance sheet once again, purchasing anything anyone was selling. QE on steroids began. The balance sheet reached a record high of $8.9 trillion, with the Fed owning 25% of all outstanding treasury bonds. Over 45% of the money that has ever been created in the history of the United States has been created over the last 2 years thanks to these policies.
QT has once again been delayed, then implemented at a slower pace than announced. This is because the Fed initially tensed up at the idea of a “double-dip” recession (where the economy falls into recession during recovery because of aggressive policy); however, more recently the Fed has stated that containing inflation would cause economic pain. Nonetheless, the Fed’s hawkish rhetoric has not resulted in QT implementation as planned.
Deficit and National Debt
10-30 Year Yields on Treasuries. (FRED)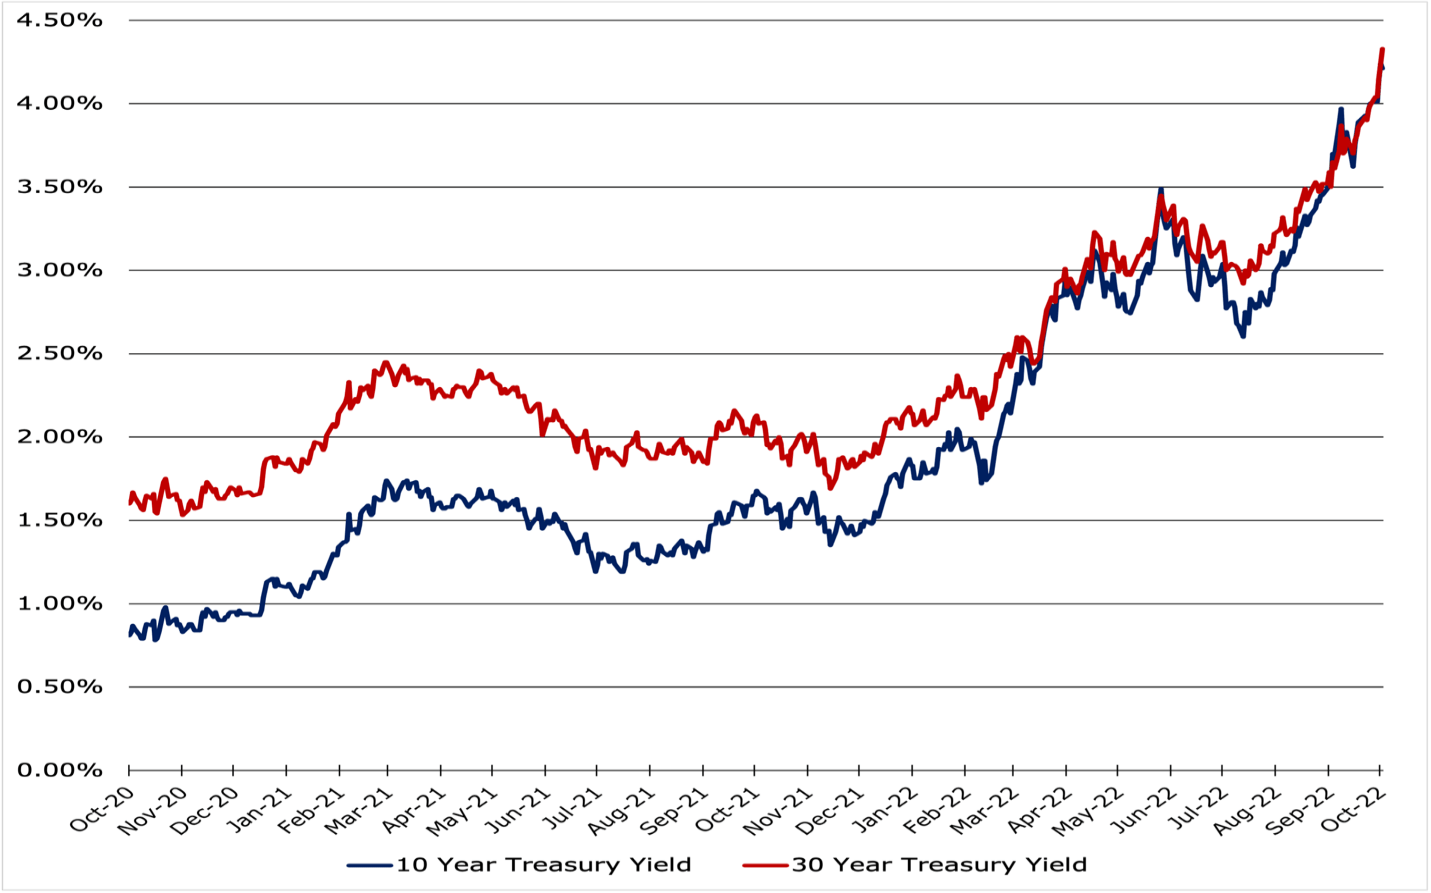
As previously discussed, the Federal Reserve owns 25% of treasury bonds. As remarkable as this is on its own, it is financing the massive national debt and supports extreme government deficits, making the Fed the largest buyer of Treasuries. The decrease in demand from the Fed ceasing purchases will reduce the price of the bonds while driving up yields to attract new holders. This has begun as shown below.
US Department of Treasury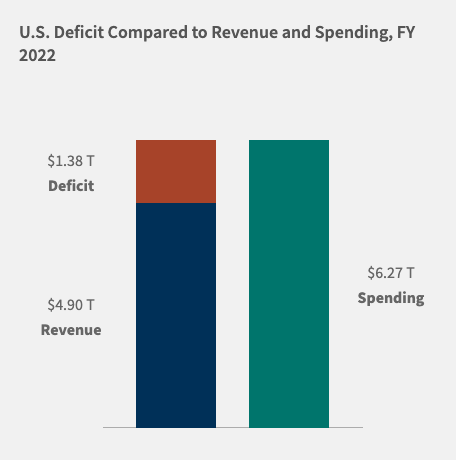
FRED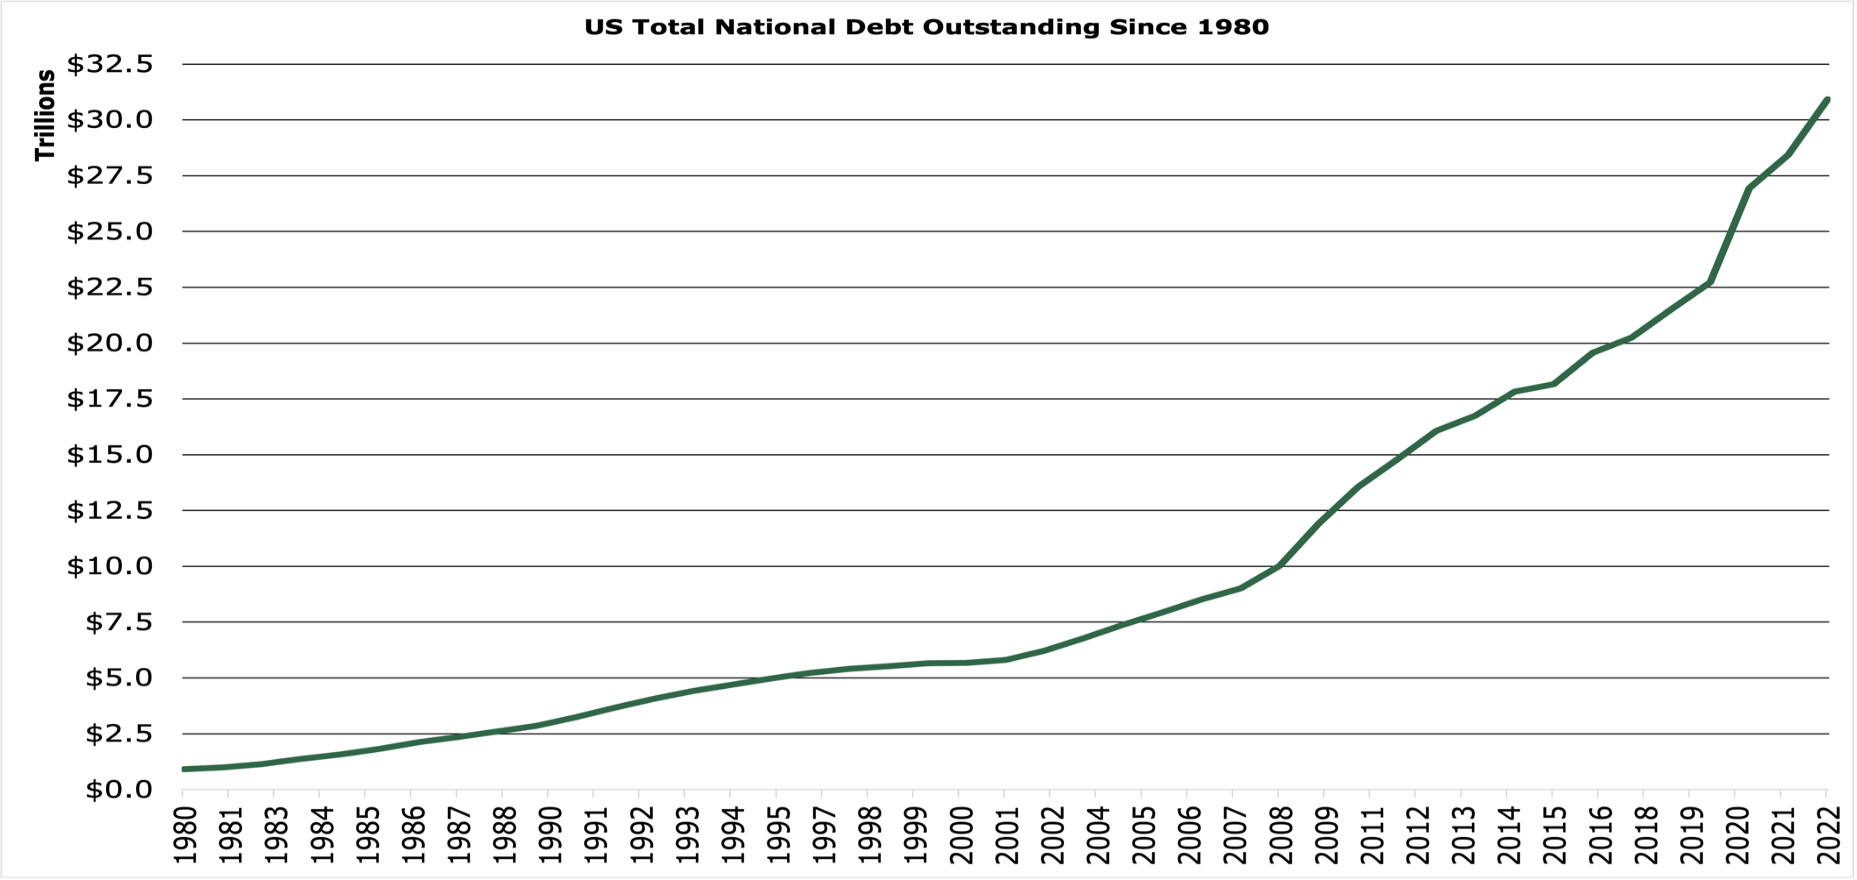
Higher interest rates on government debt will add to the already huge permanent Federal Deficit. As shown above, the Federal government running a $1.38 trillion deficit in Fiscal 2022 ending in September.
These massive obligations are pushing us toward the territory of the debt becoming unserviceable without consistent Federal Reserve intervention to drive down rates and buy bonds artificially. In our opinion, QE will be restarted at some point as the deficit and debt spiral out of control. Inflation reduction will be pushed aside as an achievable goal.
What Could Cause A Blink?
FRED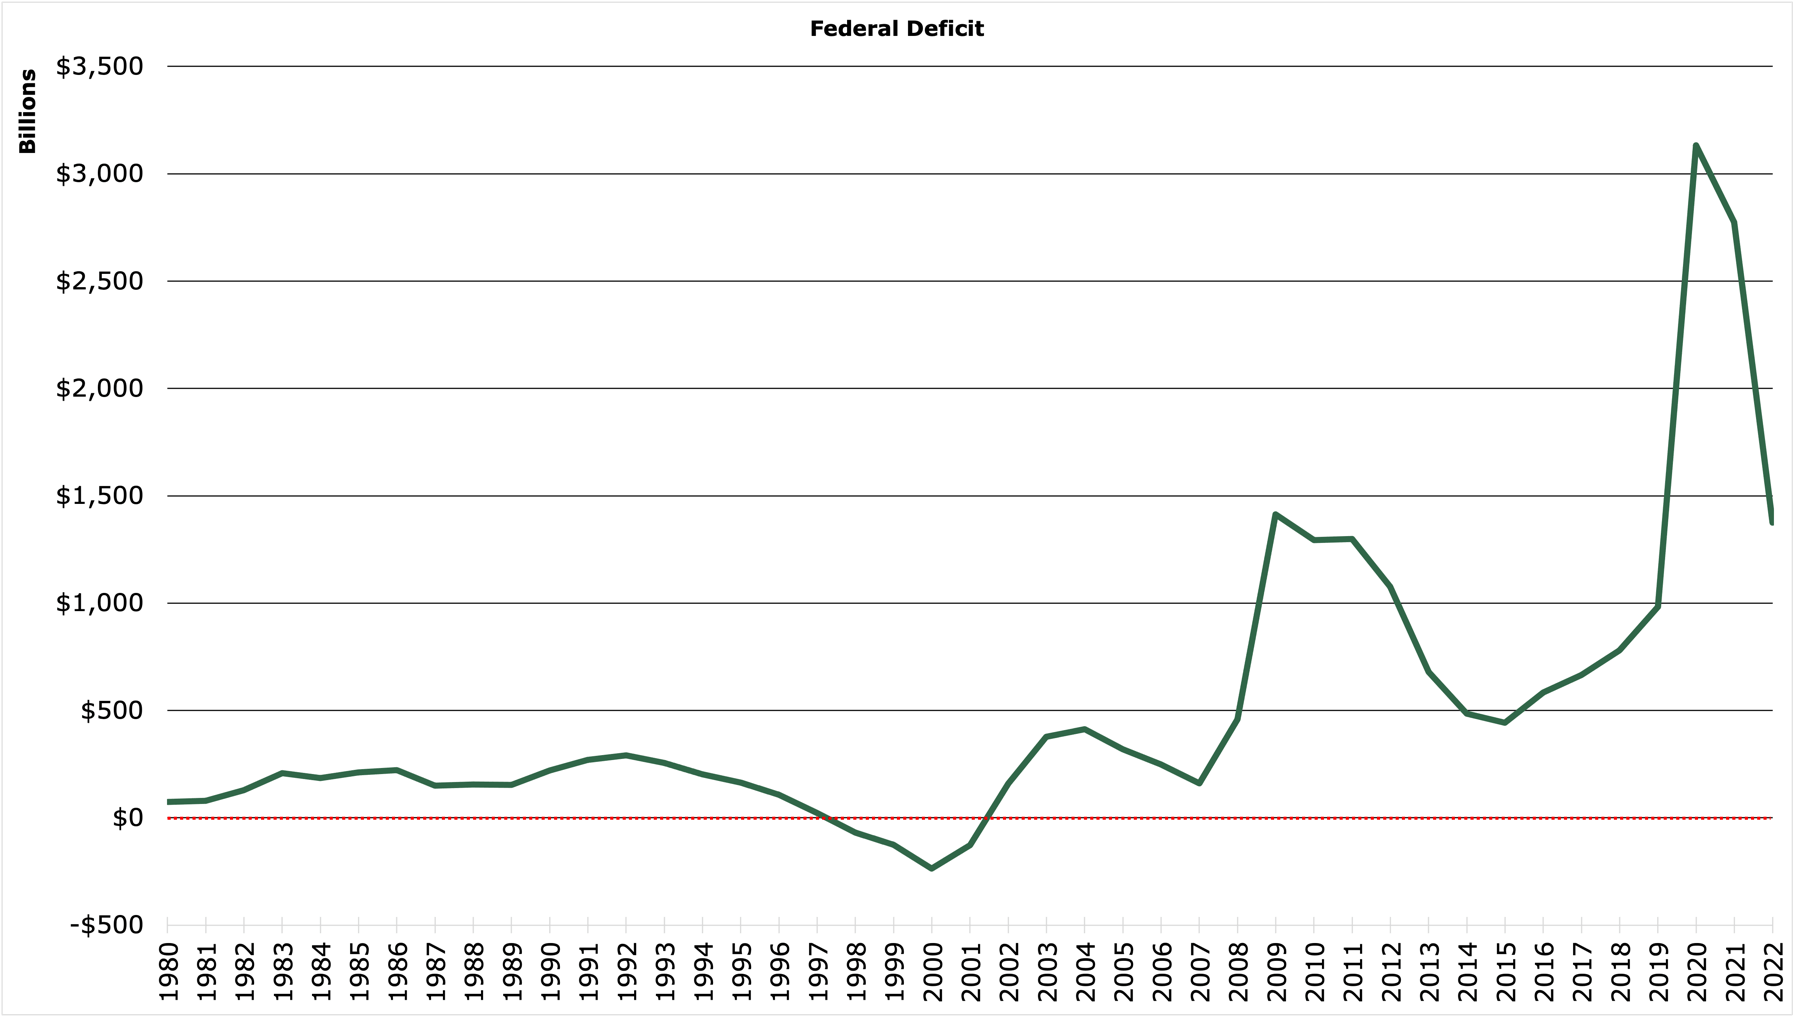
Many people expected – especially after the quick 75 bps hikes we have seen – that the Fed may be doing the Volcker tactic of putting the FFR above inflation to break the spiral effect that inflation can have. However, this may be untenable. Governments are far too over-levered to service their debt in a higher interest rate environment.
The policy of the Fed bailing out bankrupt banks and financing massive deficit spending is finally coming back to haunt us. Based on Dodd-Frank stress tests, some of the largest financial institutions could collapse if rates are raised to such elevated levels given the exogenous circumstances of both COVID-19 and two large export economies at each other’s throats.
QT will likely continue until something breaks; what that something is remains to be seen.
Many expected employment numbers to be the first to show signs of buckling, which in turn would force political pressure on the Fed to slow or halt tightening; however, jobless claims have fallen again despite rate hikes and a bearish stock market. At this point, it seems like the labor economy remains strong, with the problem being not enough workers rather than not enough consumers.
It is no secret that the Fed’s extremely accommodative policy has directly led, at least in part, to the 13-year-long bull run the stock market has had and contributed to the “everything bubble.” QT, if it is implemented, will reduce liquidity, drive interest rates up, and reduce the P/E (Price to Earnings) ratio of stocks, with the most speculative stocks getting hit the hardest.
S&P500 vs the Fed’s Balance Sheet. (FRED, Yahoo Finance)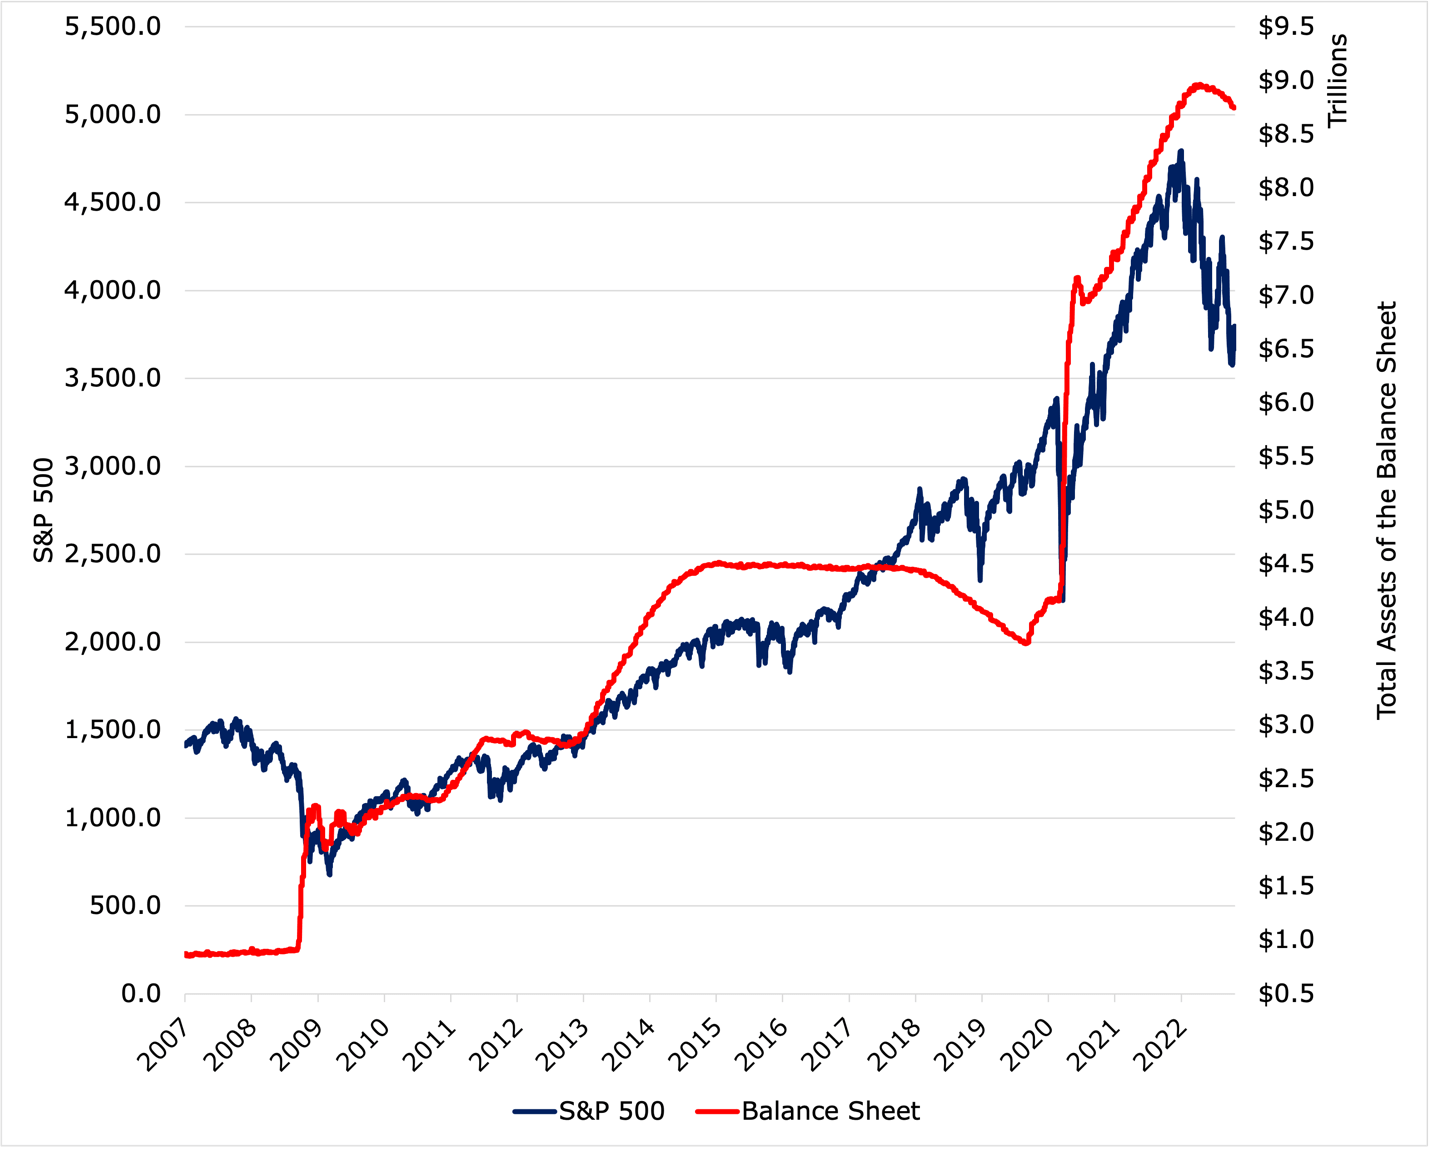
Historically, the 10- and 30-year treasury yields have approximated nominal GDP. We would estimate an appropriate yield on these government bonds to be at least 5% when market-based pricing prevails. While yields are on the rise and in some markets approach the 5% mark, fixed-income investors have already incurred massive losses on their fixed-income investments. We expect bond yields to increase from here and approximate nominal GDP. As seen below, yields are still artificially depressed by QE and are nowhere near where market-based pricing would have yields based on economic fundamentals.
10-30 Year Treasury vs Nominal GDP Growth (FRED)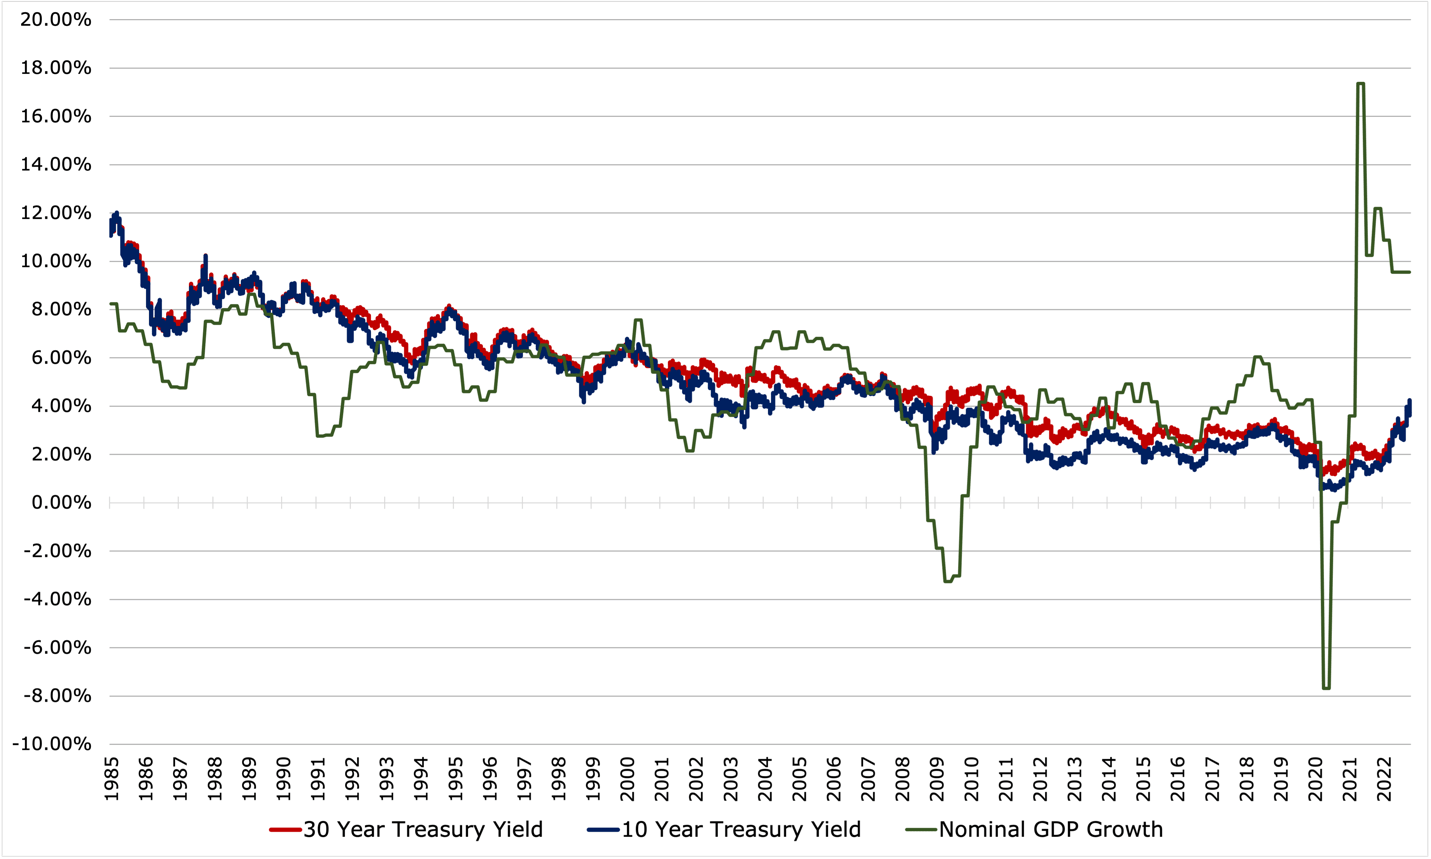
What Can We Expect?
QT is still an untested experiment, and nobody, including us, is sure what exactly will happen. Remember, QT is an experiment to reverse QE, which was also an unprecedented and huge economic experiment.
Given central banks tend to look back to the past for guidance, the Fed will likely continue on the QT track over the next few months or possibly a year. A lot of the reason for the loss in GDP is a decrease in Federal spending, coupled with a strong U.S. dollar leading to much higher realized prices for exports compared to relatively cheap imports. The good news is personal consumption and business investment remain modestly positive in the face of higher interest rates, high inflation, and a stock bear market. This may mean the Fed has avoided a demand-destruction recession, at least in the short term.
GDP Growth by Component (BEA)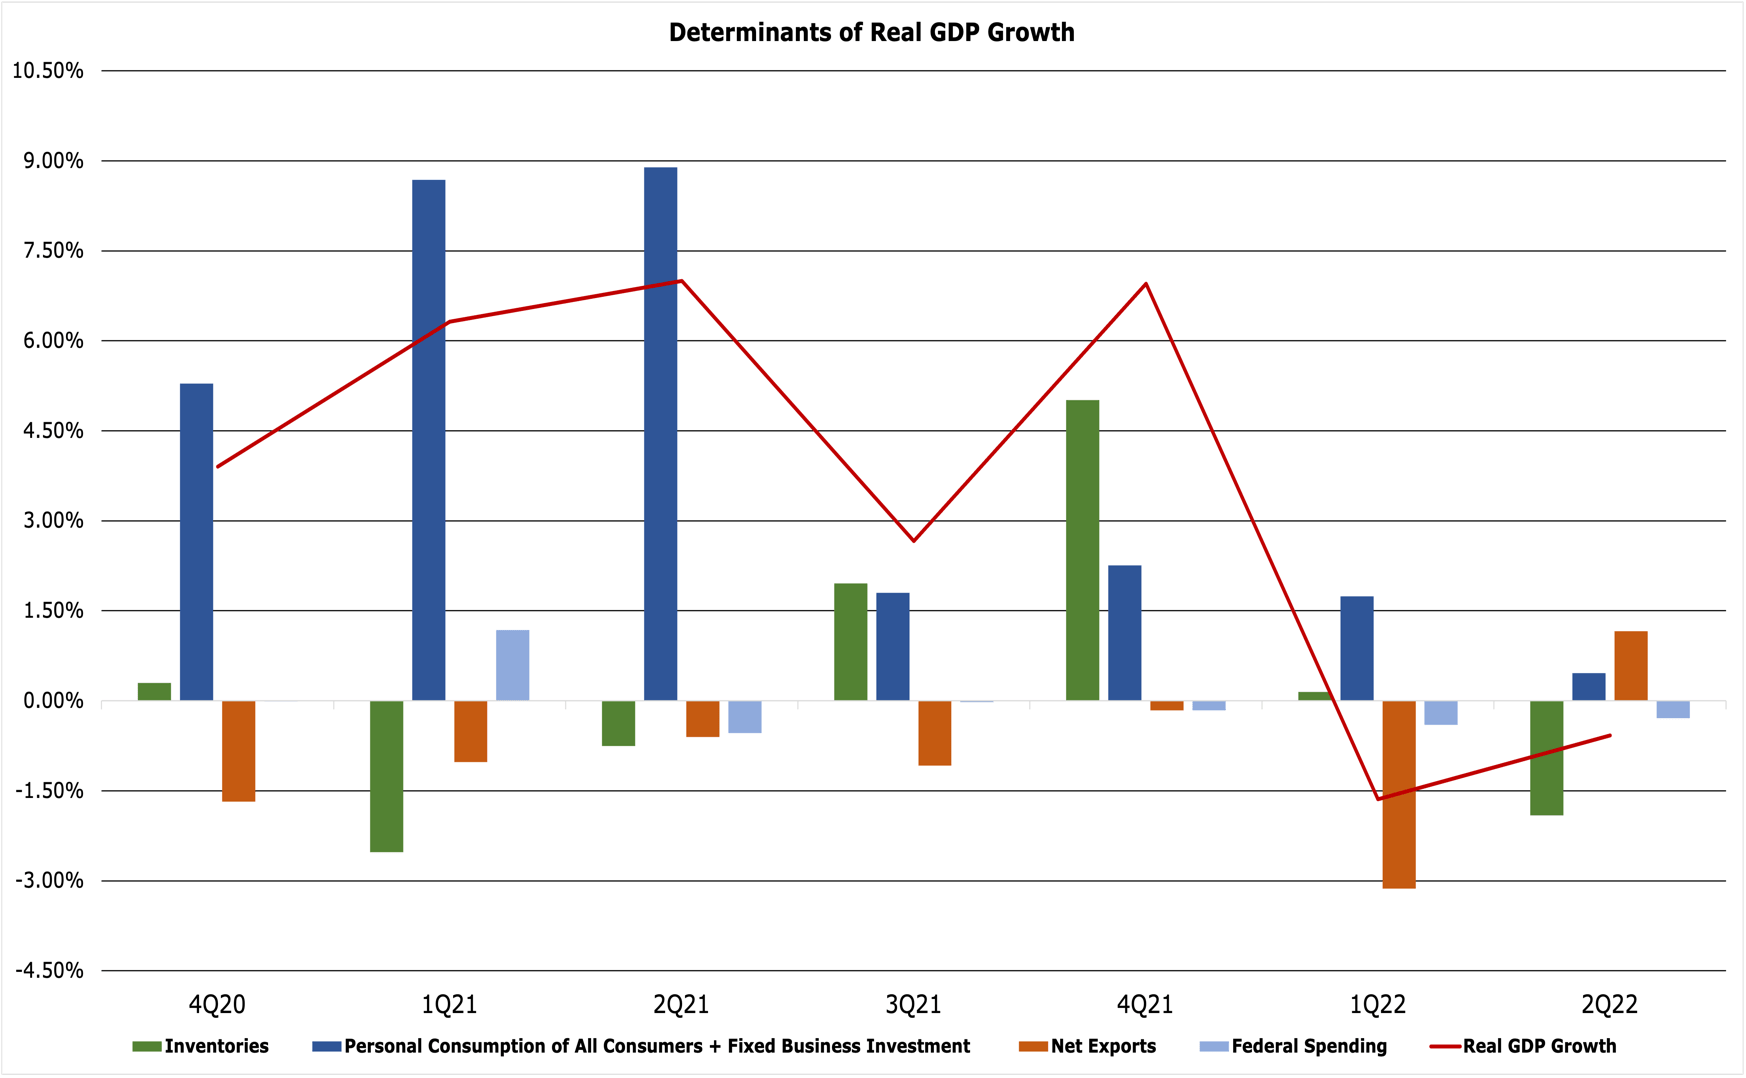
A strong labor market will also mean that the impending recession will be much easier to bear in the United States should it occur. However, there are still some key risks to consider. China has begun to shrink its holdings of U.S. treasuries and continues to stagnate economically due to its zero-Covid policy. The European Union is facing a severe recession given energy shortages and high inflation. The war in Ukraine continues to escalate and increase uncertainty for the region and the world. The once-unthinkable use of nuclear weapons is now being seriously analyzed by Russia, with the U.S. and NATO correspondingly analyzing responses.
Vice Chair of the Federal Reserve Board Lael Brainard has stated that the Fed is not asleep at the wheel and is not ignoring the myriad of factors. The economy overall is experiencing a combination of supply-driven and demand-driven inflation, as shown below.
Adam Shapiro, SF FRB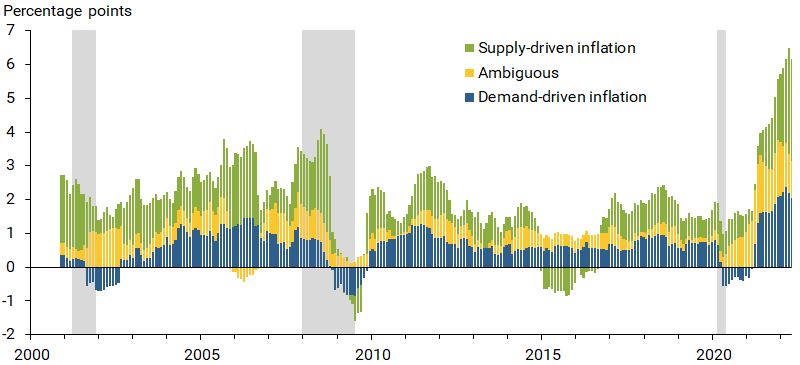
Conclusion
The reality, in our opinion, is the Fed does not really have the tools to address all the problems at once: inflation, huge deficit and debts, and anemic economic growth. QE, which started in 2008 to bail out the banks, lasted far too long. After the markets had calmed down in the second half of 2009, QE should have ended. It did not, and continued until April of 2022. The markets and the Federal government are addicted to QE. QT will be very painful. We monitor QT progress weekly and believe this is the most important data point in the economy and the markets. The link is here.
While we do not know what the Fed will do, its actions to date show a reluctance to implement QT. When something breaks, we would expect the Fed to abandon QT and bring back QE. This needs to be monitored in real time. Until QT is abandoned, the economy, interest rates, and stocks are likely to experience more pain. The markets will try to anticipate the end of QT with bonds and stocks rallying. Perversely, these bear market rallies allow more room for the Fed to implement QT and create another leg down. Guessing the end of QT will be a difficult game, and we have decided to wait until something breaks to put forth our guess that QT is dead. In our opinion, staying cautious of risk assets until QT’s death is a prudent course of action.
Be the first to comment