

John Kevin/iStock via Getty Images
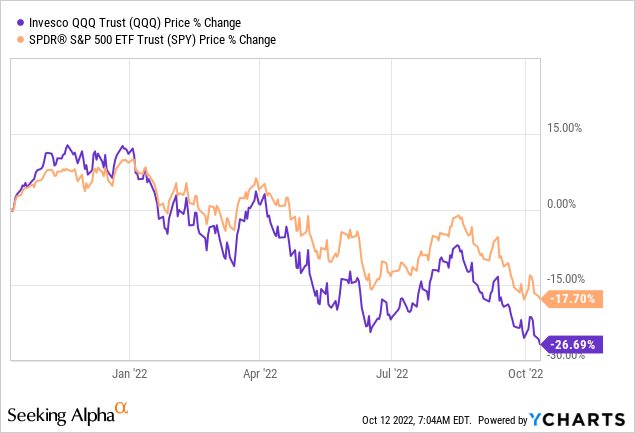
The stock market is in turmoil with the S&P 500 down by 17.7% during the last year, but the tech-heavy Invesco QQQ Trust (NASDAQ:QQQ) is down by 26.7%. Had it not been for energy stocks, the SPDR S&P 500 ETF Trust (SPY) could have fared worse with the Nasdaq having also been weighed down by the semiconductor stocks it holds.
The objective of this thesis is to assess whether, after such a drop, there are still ingredients that can drive QQQ to yet another bounce. At the same time, building on the trend-based analysis for the Invesco ETF together with daily price variations, I will also show that the ProShares UltraPro QQQ ETF (NASDAQ:TQQQ) is becoming less attractive for the day trader, but can still be used to profit from an uptrend in the Nasdaq.
For this purpose, I start by elaborating on the recent market drivers.
Factors Driving Down the Nasdaq
First, QQQ tracks the Nasdaq-100 Index, which encapsulates the 100 largest non-companies listed on the Nasdaq based on market cap. As such, it contains the most valuable publicly listed names in the world like Apple (AAPL), Microsoft (MSFT), and Tesla (TSLA) as shown in the diagram below, with 97.56% of its assets dedicated to the U.S.
QQQ Top Holdings (www.invesco.com)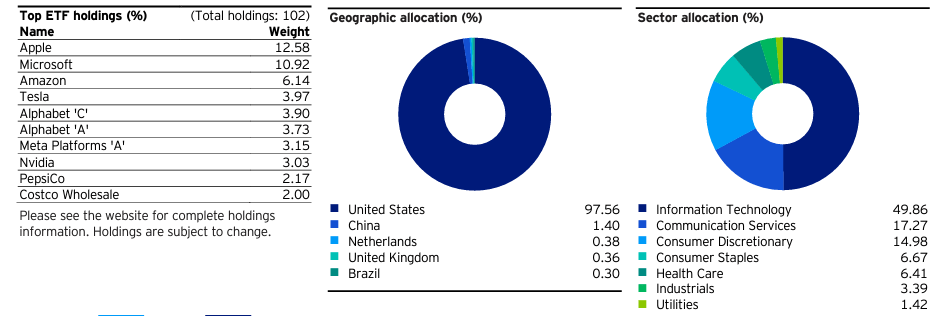
These are multinationals that span the whole globe. As such, they are also impacted by economic conditions abroad, namely in Europe where a potential slowdown should be more acute than in the U.S. Moreover, the Federal Reserve raising rates also mean that the greenback becomes pricier vis a vis the local currencies of countries where American companies operate, in turn constituting headwinds for QQQ’s holdings when depreciated euro revenues reach dollar-denominated income statements.
Thus, companies like Microsoft have been warning about potential Forex-related earnings risks since June. This coincided with the trough in the value of QQQ as shown in the introductory chart. More recently, cracks are also starting to appear in Apple’s strong iPhone facade as sales dropped in China.
Besides currency risks, there are concerns about higher prices for goods and services caused by high inflation hampering demand throughout the U.S. economy in turn impacting the consumer discretionary sector as well as semiconductor companies like Nvidia (NVDA) as PC sales have dropped following the pandemic boom, with many Americans now worrying that the country is already in recession. In addition, geopolitical tensions between the U.S. and China again surfaced sending the VanEck Semiconductor ETF (SMH) down 9.3% in just five days.
Furthermore, supply chain challenges have also reduced the number of deliveries for Tesla.
Market Digesting Tech Worries and the Bounce
All the factors I have enumerated above imply that QQQ does not make an investment case for the long term, but, that there could be a bounce as investors seem to have digested the fact that tech stocks should be more impacted than the broader market by higher interest rates.
In order to justify my statement, I plotted the daily differences between the values of the SPY (representing the broader market) and QQQ as shown in the blue chart below.
Chart built by the author using data from (finance.yahoo.com)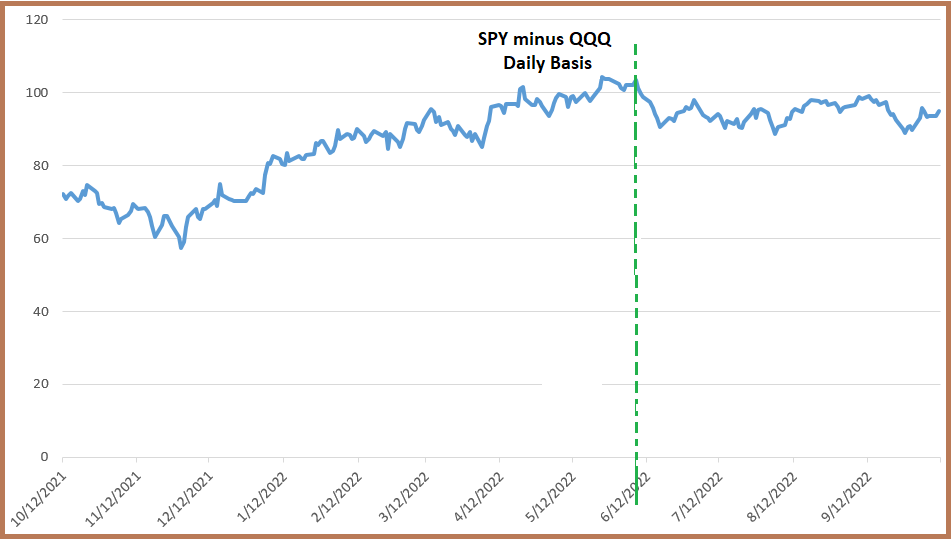
Making sense of the chart, the November 2021-June 2022 period saw the SPY-QQQ differential obtained by subtracting the daily values of the QQQ from SPY moving higher, from 60 to above 100, as the Nasdaq suffered from more downside than SPY (S&P 500). This was due to investors realizing that the Federal Reserve would have to tighten interest rates, instead of keeping it on hold as a result of inflation not being transitory.
Now, rates going higher is a negative for the market as a whole, but tech stocks, in particular, depending on the state of their individual balance sheets, may find it harder to get access to cheap money to drive their higher growth rates and earnings.
Subsequently, after reaching a peak of 103-104 reached in June as marked by the green dotted line above, the differential has now settled down to the 95 level, showing that tech stocks are not being punished as severely relative to the broader market. This probably indicates that investors seem to have priced in the fact that the Fed will have to hike rates aggressively.
Furthermore, with analysts having revised the S&P 500’s estimated third-quarter earnings growth rate downwards to 2.4% (or the lowest since Q3 2020 (-5.7%) and a lot of the negative news already baked in the performance of the Nasdaq, there could be an upside when the tech earnings season starts on Tuesday 25.
To this end, QQQ’s RSI of 32.81 (or under 50) indicates that it has been oversold and there could be an upside to around $300 which is the 50-day SMA. Other events that could induce a positive momentum are a potential reprieve obtained by Taiwan Semiconductor (TSM) and others for the export of certain types of chips to China while being aligned with American security interests.
For investors, $300 represents a 14% upside from QQQ’s current value of $262, but, one could obtain a yield of three times more when using TQQQ which is a trading tool that thrives on volatility.
Trading with TQQQ
This leveraged ProShares ETF aims to return three times (3x) the return of its underlying benchmark which targets the daily performance of the Nasdaq-100 Index. Thus, it provides thrice the performance of QQQ.
TQQQ Important Considerations (www.proshares.com)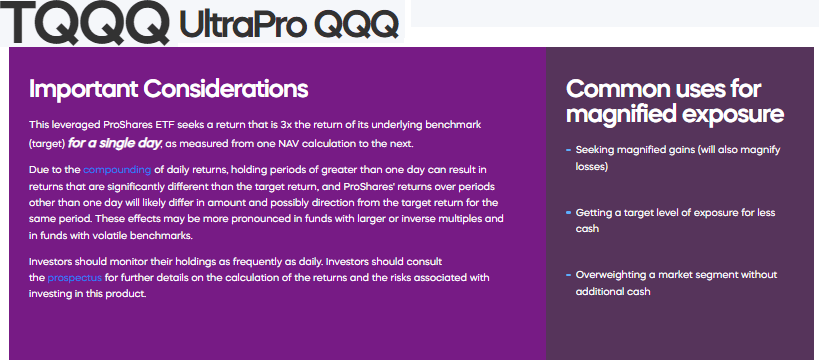
In the same way as QQQ, TQQQ allows you to profit from the market during a bounce, that is after a flurry of good news has shifted investors’ sentiment to “Risk on”. This is possible following the ProShares ETF’s 39% decline in just one month and even a small bounce could return profits of 10%.
Now, since this a highly leveraged ETF, ProShares advises not to hold it for a period of greater than one day as due to the compounding of daily returns, the returns can be significantly different than what is intended. For example, when QQQ rises by 3% in one week, it may happen that TQQQ does not return 9% as should normally be the case as there are more chances of the Nasdaq fluctuating (going up and down) widely during five days than one.
However, in order to make a profitable day trade, the difference between TQQQ’s high and low has to be significant (more than 10%), but according to my observation, this has been the case in the recent month despite the highly volatile market. I confirmed this observation by adding an orange chart to the initial one, which shows the daily variations (or fluctuations) obtained by plotting the daily differences between the high and low values of TQQQ.
As shown by the number of peaks decreasing from the left of the green line to the right, the chart shows that the daily variations have been diminishing since June. This, in turn, indicates a lower degree of volatility on a day-to-day basis, showing that TQQQ is getting less attractive for day trading compared to before.
Charts built by the author using data from (finance.yahoo.com)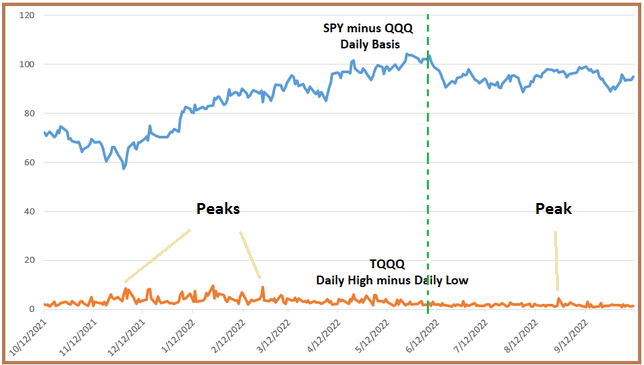
Explanatory reasons could include traders moving into cash or migrating from tech to energy-related leveraged ETFs in order to make money. Another reason could pertain to investors having finally accepted the fact that there will not be a reprieve in the Fed’s hawkish tone. This again confirms that the market seems to have digested that hiking of rates by the Fed is not a fatality.
In these circumstances, if one is prepared to take on compounding risks and trade for a period of more than one day, like one week, for example, TQQQ makes sense. To this end, its RSI of 31.66 (or under 50) indicates that it has been oversold and after the positive financial results of TSMC, there could be some temporary upside.
However, just as when trading any leveraged ETF, it is important to constantly monitor the market and exit with a stop loss at the first signs of potential downsides.
Conclusion
Therefore, the ingredients for the Nasdaq and QQQ to make a temporary jump, which I estimate at 14% are present. Along the same lines, TQQQ could also deliver an upside of about three times but the real returns are obtained after subtracting compounding-related losses.
Another important point is that far from advising anyone to buy the dip, I have supported this thesis by analyzing the differential between tech and the broader market which point to investors having possibly digested the aggressive hikes to be implemented by the U.S. Fed.
Still, the U.S. Central bank which is data-driven may turn up to be super hawkish and I may not have priced in all factors which may adversely impact markets like credit risks emerging in the high-yield fixed-income space due to tightening of liquidity in the monetary system as well as some uncertainty which could appear in bond markets following the bond sell-off in the U.K. some two weeks back.
Finally, since we are more amid a trader market, it is important to keep on to your cash as the cost of living escalates further, and trade with caution, like for example waiting for CPI data to be released on October 13 before trading.
Be the first to comment