

mj0007/iStock via Getty Images
Fear of inflation, rising Fed funds rate (FFR), quantitative-tightening, and lower corporate earnings has resulted in the consensus view that 2023 will bring a recession and even lower stock prices. In this piece, we outline our contrary view; recession is unlikely, and a new bull market will start 2023.
Inflation and Higher Fed Funds Rate
Inflation is a supply/demand issue, not simply a quantity of money issue. Even Milton Friedman admitted it when he said the following:
‘The use of quantity of money as a target has not been a success… I’m not sure I would as of today push it as hard as I once did.’ (FT, 7 June 2003).
Increasing the cost of money does nothing to increase supply and, in fact, might influence prices higher, not lower. The table below compares rates and inflation at the start of the year with those of the current period. Notice that all countries have higher inflation, but only Japan has not punished itself with higher rates.
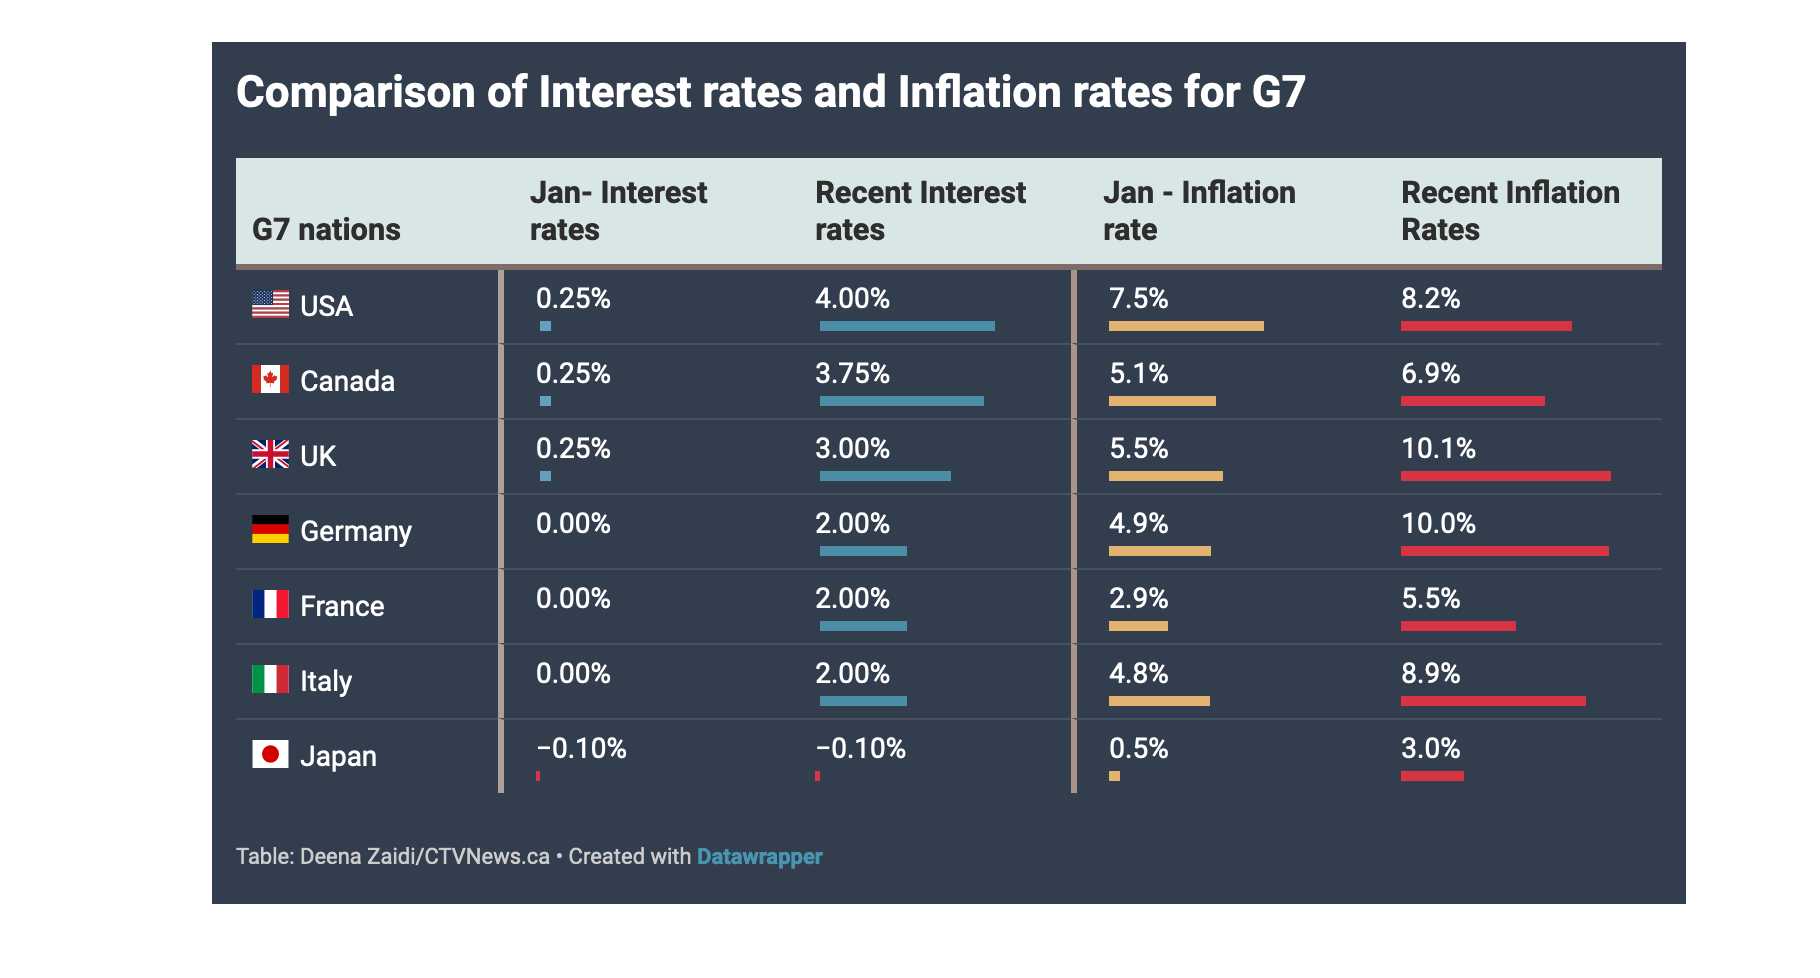
Rate increases and inflation (CTV News)
As Volcker demonstrated, raising rates does not tame inflation…unless/until borrowing costs get too high and the economy is choked into a recession which crushes demand.
The chart below shows how inflation tends to rise and fall along with the FFR, with the most dramatic falls occurring during recessions.
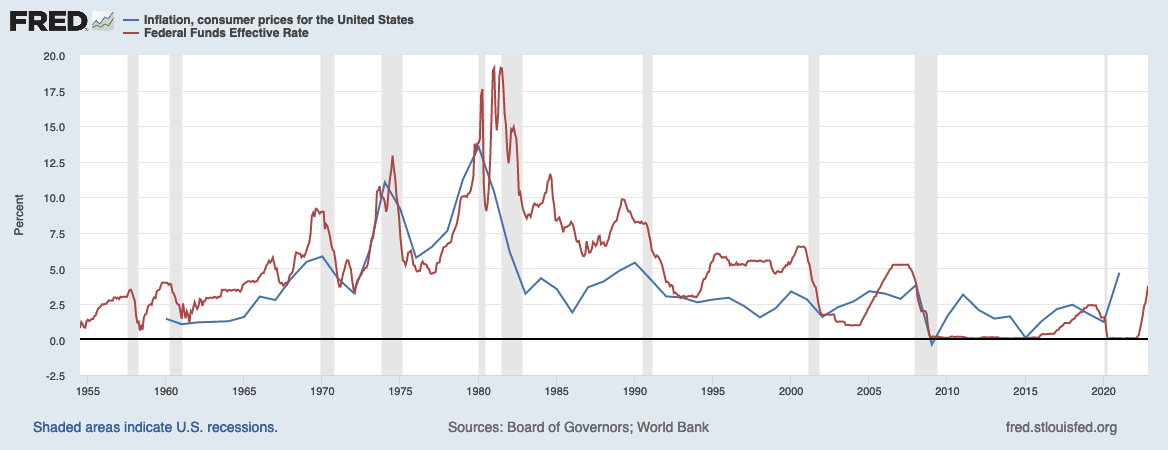
Inflation and FFR (FRED)
An FFR below 6% should not cause a recession in the US, and since we don’t think the Fed will go past 6%, the probability of a recession in 2023 is much lower than the consensus.
Inflation always involves shortages; the causes of the shortages, however, are variable.
The current inflation, came as a result of the COVID disruption in Global supply chains and was aggravated by the Russian attack on Ukraine which caused shortages in energy supplies.
Oil is now down to where it was a year ago, thanks in part to the release of the strategic oil supply (and Russia having to sell oil at a big discount).
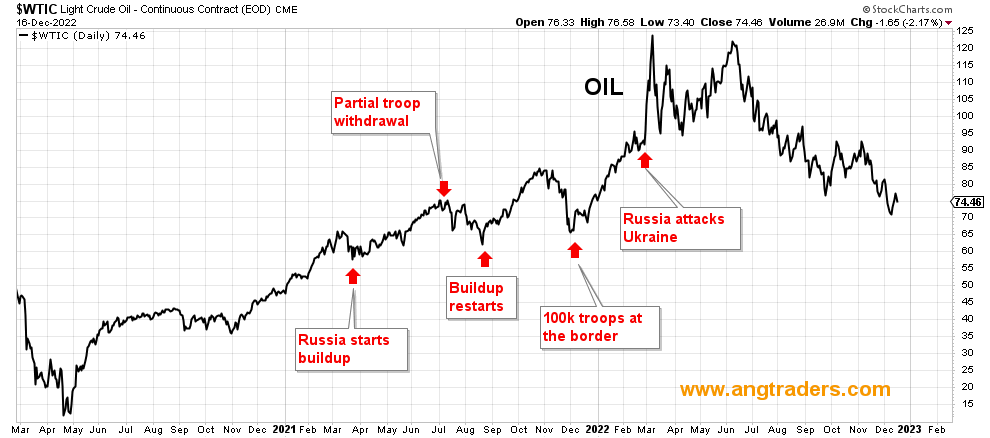
Oil (ANG Traders, stockcharts.com)
Also, as usually happens when shortages arise and prices start to increase, the corporate world takes advantage and raises prices ‘just because they can’.
The Baltic Dry Index, which measures the cost of shipping, is back to pre-pandemic levels, but prices of goods have not been reduced as fast as they were raised.
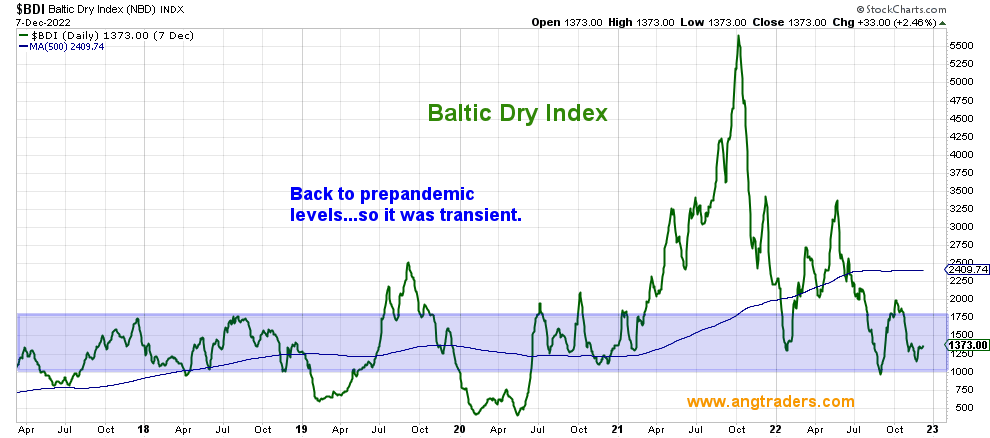
Baltic Dry Index (ANG Traders, stockcharts.com)
Inflation in the US peaked in June and has gone down five months in a row. Inflation is very unlikely to go back to the Fed’s target of 2%, but the Fed is equally unlikely to continue with out-sized hikes in 2023 as inflation drops. If the FFR stays below 6%, I think the economy should hold and no recession materialize in 2023.
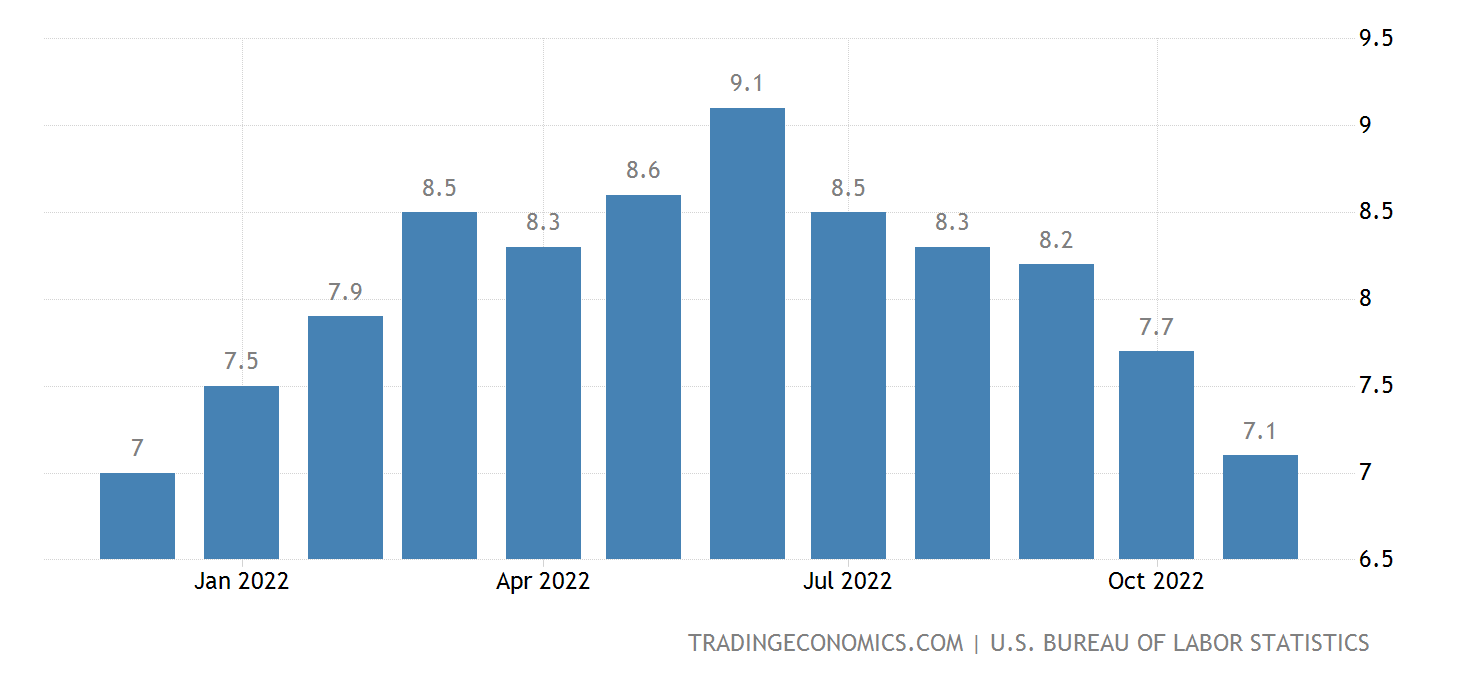
US Inflation (Tradingeconomics.com)
Recessions typically materialize between 6-18 months following the second 10y-2y rate inversion, and after unemployment starts to rise. The chart below highlights how the 10y-2y is still in its first inversion and unemployment remains relatively unchanged. The probability of a recession is not significant until at least 2024; the 10y-2y has to first rise, then re-invert, and unemployment has to rise dramatically before a recession (demand destruction) takes hold. (And if unemployment starts to rise in 2023, the Fed will slow or stop the interest rate hikes which will keep the terminal rate below 6%). A recession is unlikely in 2023, in my view.
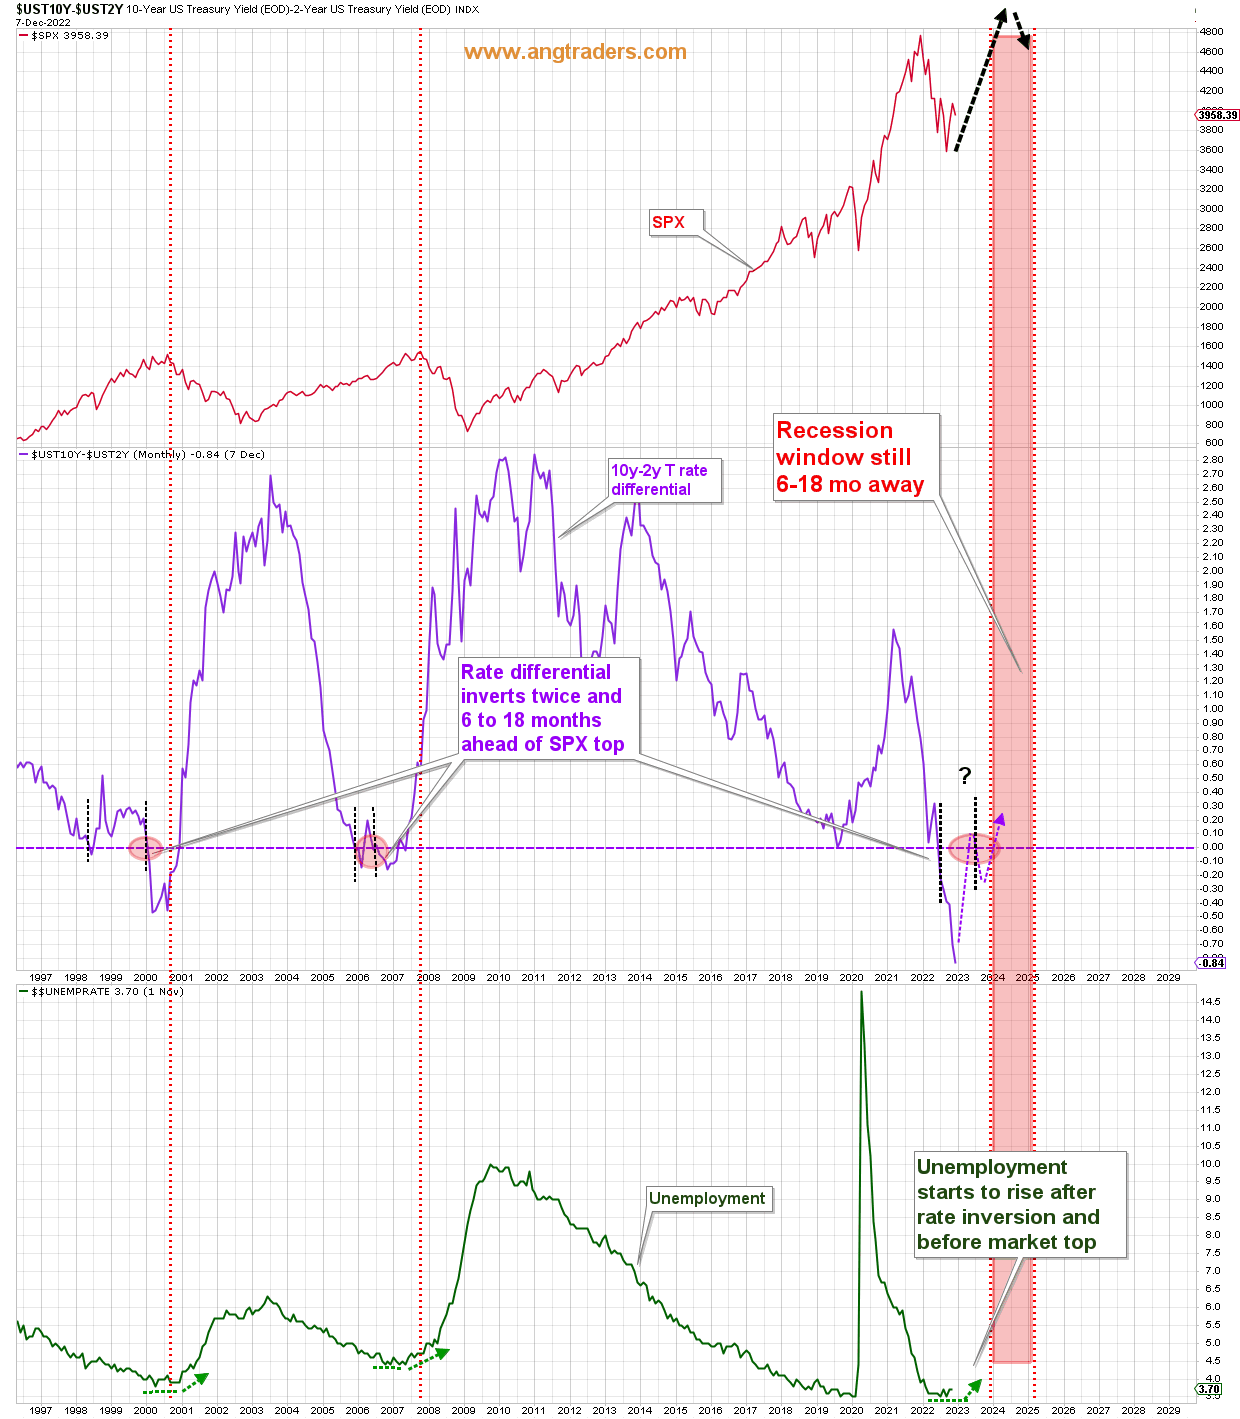
Rate inversion and unemployment (ANG Traders, stockcharts.com)
The consensus view is that higher rates will cause a recession, but, ironically, raising the FFR has dramatically increased the interest-income paid to persons and business (chart below).
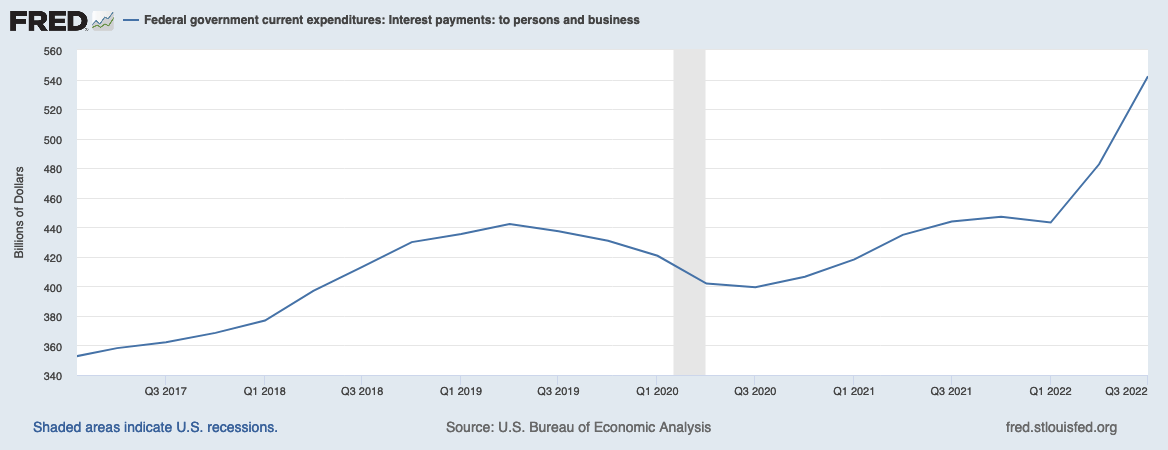
Interest income (FRED)
Between Oct. 1, 2021 and July 31, 2022, interest payments increased 22%…from $443B/quarter to $542B/quarter…and that will only increase as the new long-term securities get added to the books (most of the increase, up to this point, has come from short-term Bills). When half a trillion dollars is being added each quarter, the chances of recession are slim.
The high-yield spread peaks at SPX lows. In June, the spread peaked along with inflation and has been making lower-highs and lower-lows since then. This is a bullish trend that we expect to carry through 2023.
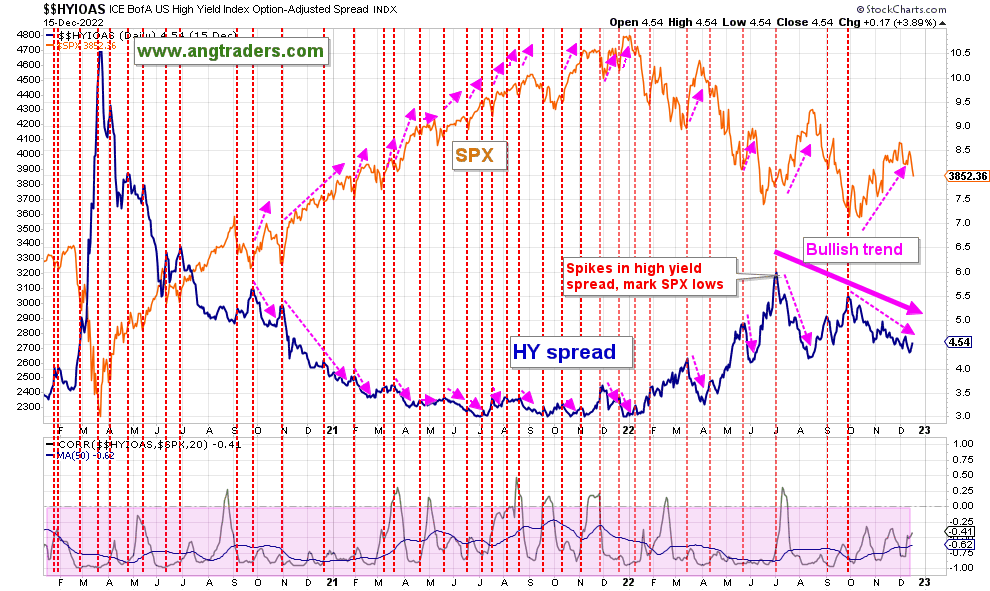
High-Yield Spread (ANG Traders, stockcharts.com)
The chart below, shows how the banks started reducing their Treasury and Agency securities when the Fed started raising the FFR. Since the October low, however, the banks have decreased their rate of selling and are now once again buying these securities. This implies that the FFR is close to topping out (not necessarily about to be reduced) which supports our view that it won’t breach 6% and a recession is unlikely in 2023.
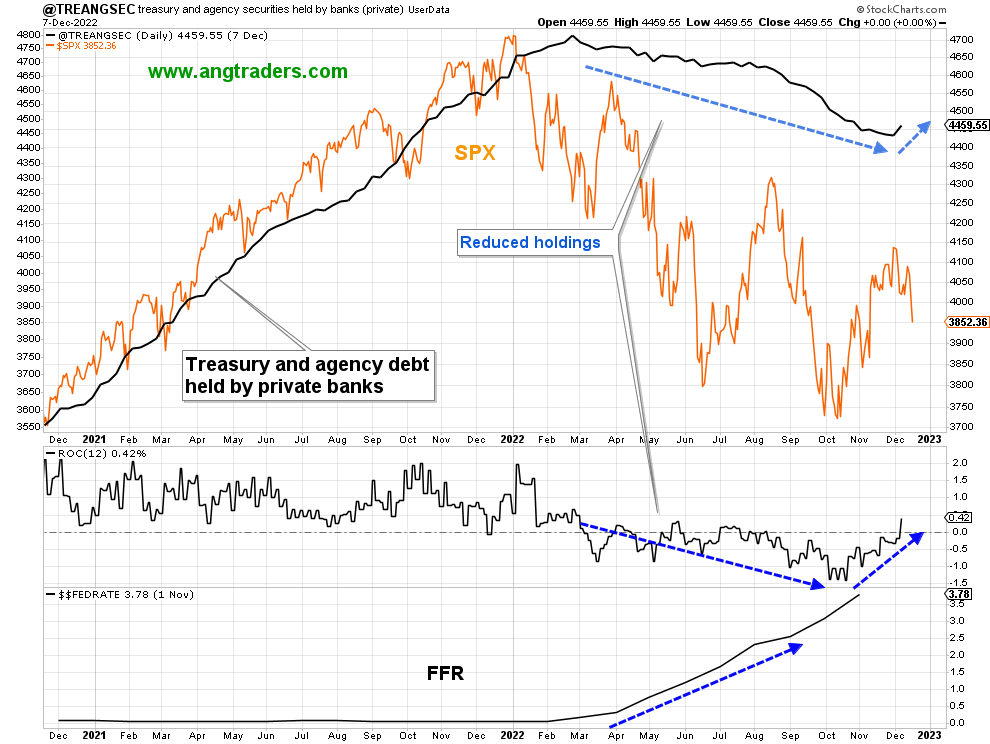
Bank T-Holdings (ANG Traders, stockcharts.com)
Corporate earnings
As pointed out above, higher interest rates result in increased interest-income–more than $500B/quarter to persons and businesses–but higher rates also increase interest-expense for indebted corporations which might bite into corporate profits.
The chart below, shows that the corporate debt-to-net-worth is relatively low and that rising interest rates have correlated positively with corporate profits over the past 30-years (black-highlights); based on history rising rates should not cause lower earnings and recession…unless/until rates go above ~5.5%.
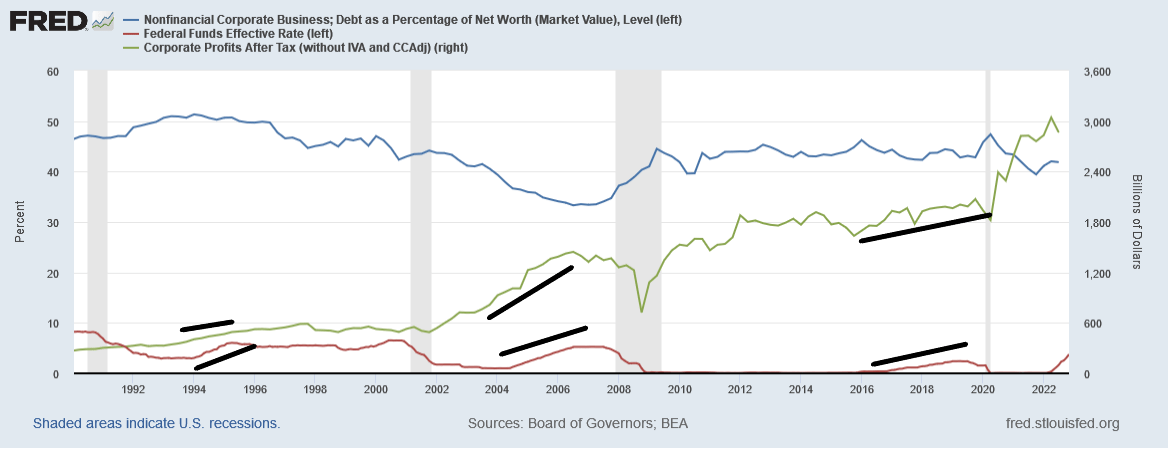
Corporate debt and profits (FRED)
Corporate earnings continued to make record highs throughout 2022, but the SPX fell during that period.
This is similar to what happened in 2011 following the fiscal impulse coming out of the GFC, (blue-ovals on the chart below) and for the same reason; a big fiscal wave which gets reduced, but the transfer through to corporate earnings lags behind, while the stock market responds much faster to the reduced fiscal input. By the time corporate earnings start to drop (as they have done in Q4), the stock market has made its lows and starts trading higher according to the new fiscal transfer rate.
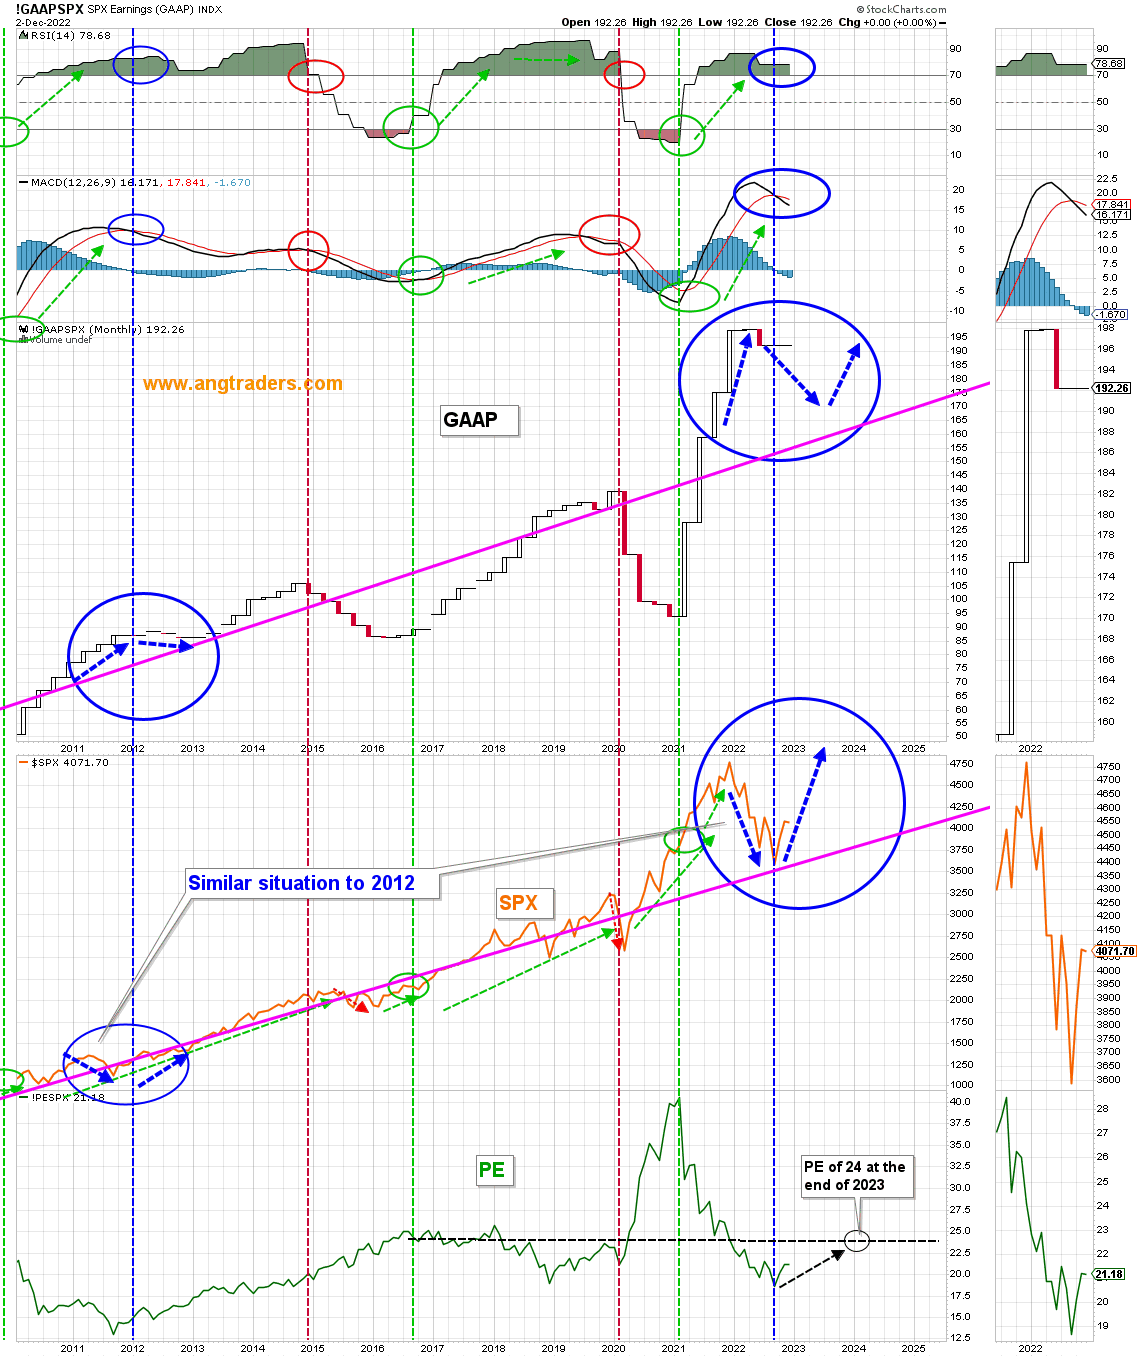
GAAP, SPX, PE (ANG Traders, stockcharts)
We expect corporate earnings to continue dropping during the first half of 2023 as this year’s reduced fiscal spending works its way through, but the new government spending should drive the stock market higher and corporate earnings should make new highs to reflect the increased fiscal-transfers in the second half of 2023, and the S&P 500 P/E ratio should return to the longer-term level of 24 (lower panel in chart above).
QT, Government Spending, and Liquidity
Liquidity (unencumbered dollars) is the primary driver of the stock market. And the primary source of money is the Federal Government through its spending and taxing policies; the Government adds new dollars to the economy (private-sector) whenever it spends to provision itself, and it drains dollars from the economy when it taxes money back.
When the Government spends more than it taxes back, the Treasury is said to have a budget deficit, but since it is the monetary-sovereign, not a household, its deficit represents the dollars that have been created and left in the economy.
Government deficits = Private surpluses
Starting in Q1 of 2022, the taxes collected radically increased (because of the higher corporate and individual earnings) and drained liquidity out of the economy. This caused a surplus for the Government, and a deficit for the private economy which made the stock market drop (pink-arrows on the chart below).
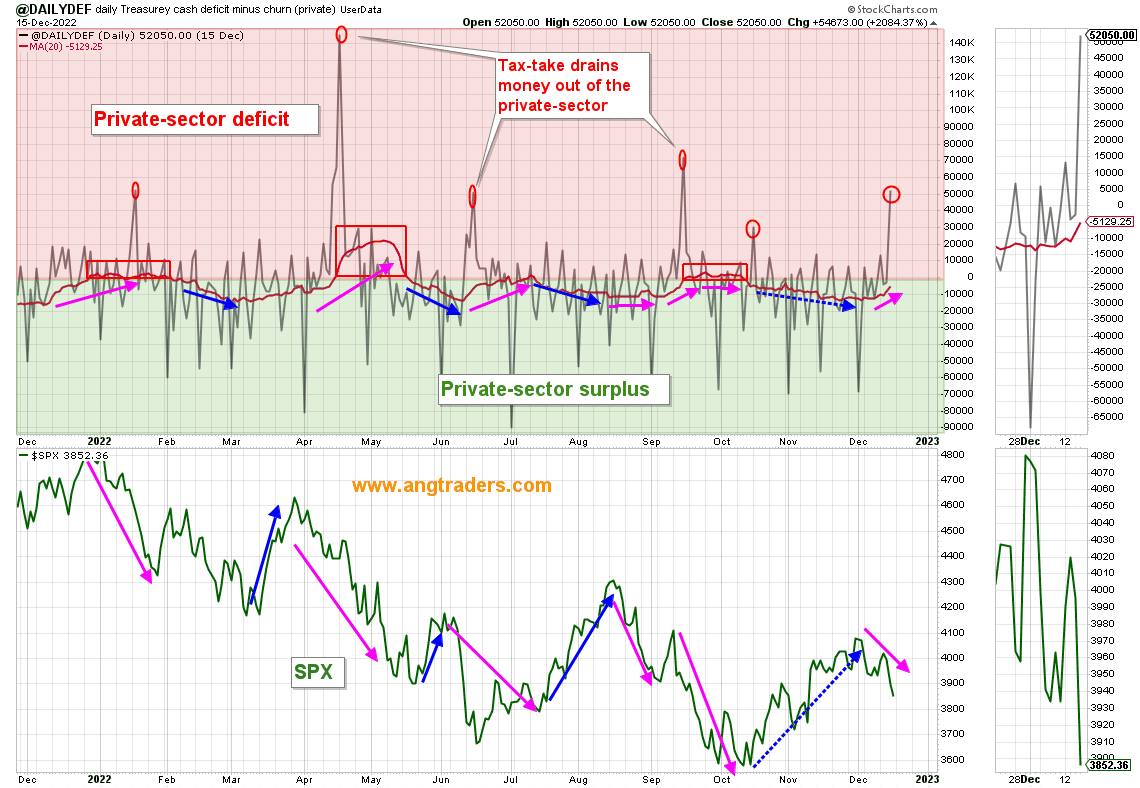
Net-transfers (ANG Traders, stockcharts.com)
Quantitative tightening (QT) is when the Fed reduces its balance sheet (System Open Market Account, or SOMA) by selling securities into the private economy and thereby reducing liquidity (pink curve below). This has a negative effect on the stock market, but only until the Federal “debt” (stock of Treasuries) starts to increase, which reflects the growth of the net-spending (blue curve below). The “debt” started growing again in June and we expect it to continue, and the SPX to rally 2023.
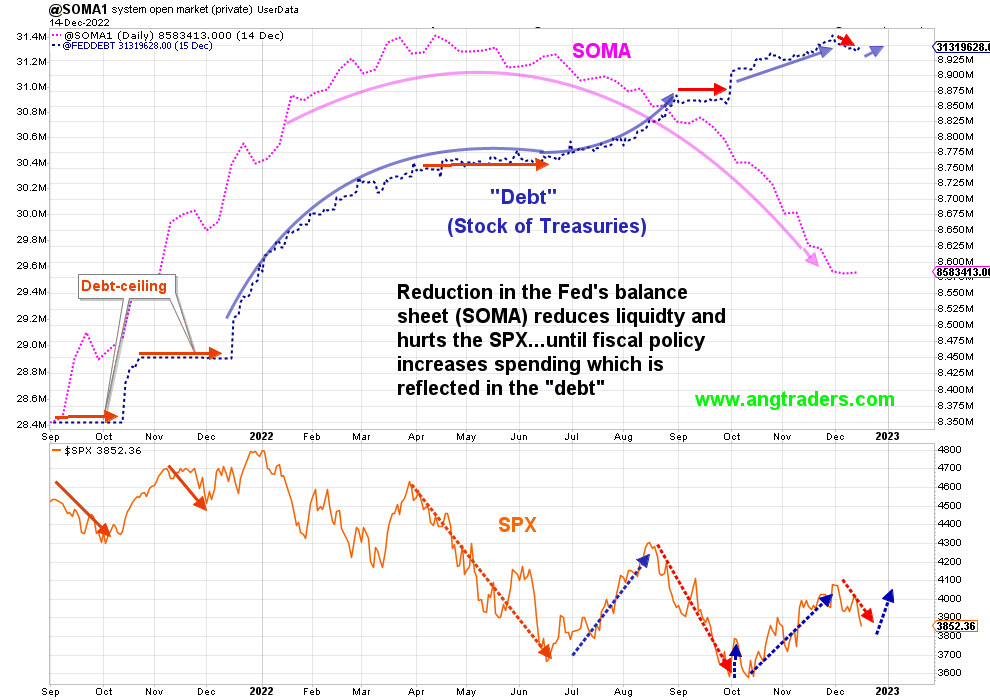
QT and “debt” (ANG Traders, stockcharts.com)
Net-spending during fiscal-year 2022 (which ended September 30, 2022) was much lower than the two preceding years; $1.35T, compared to ~$3T.
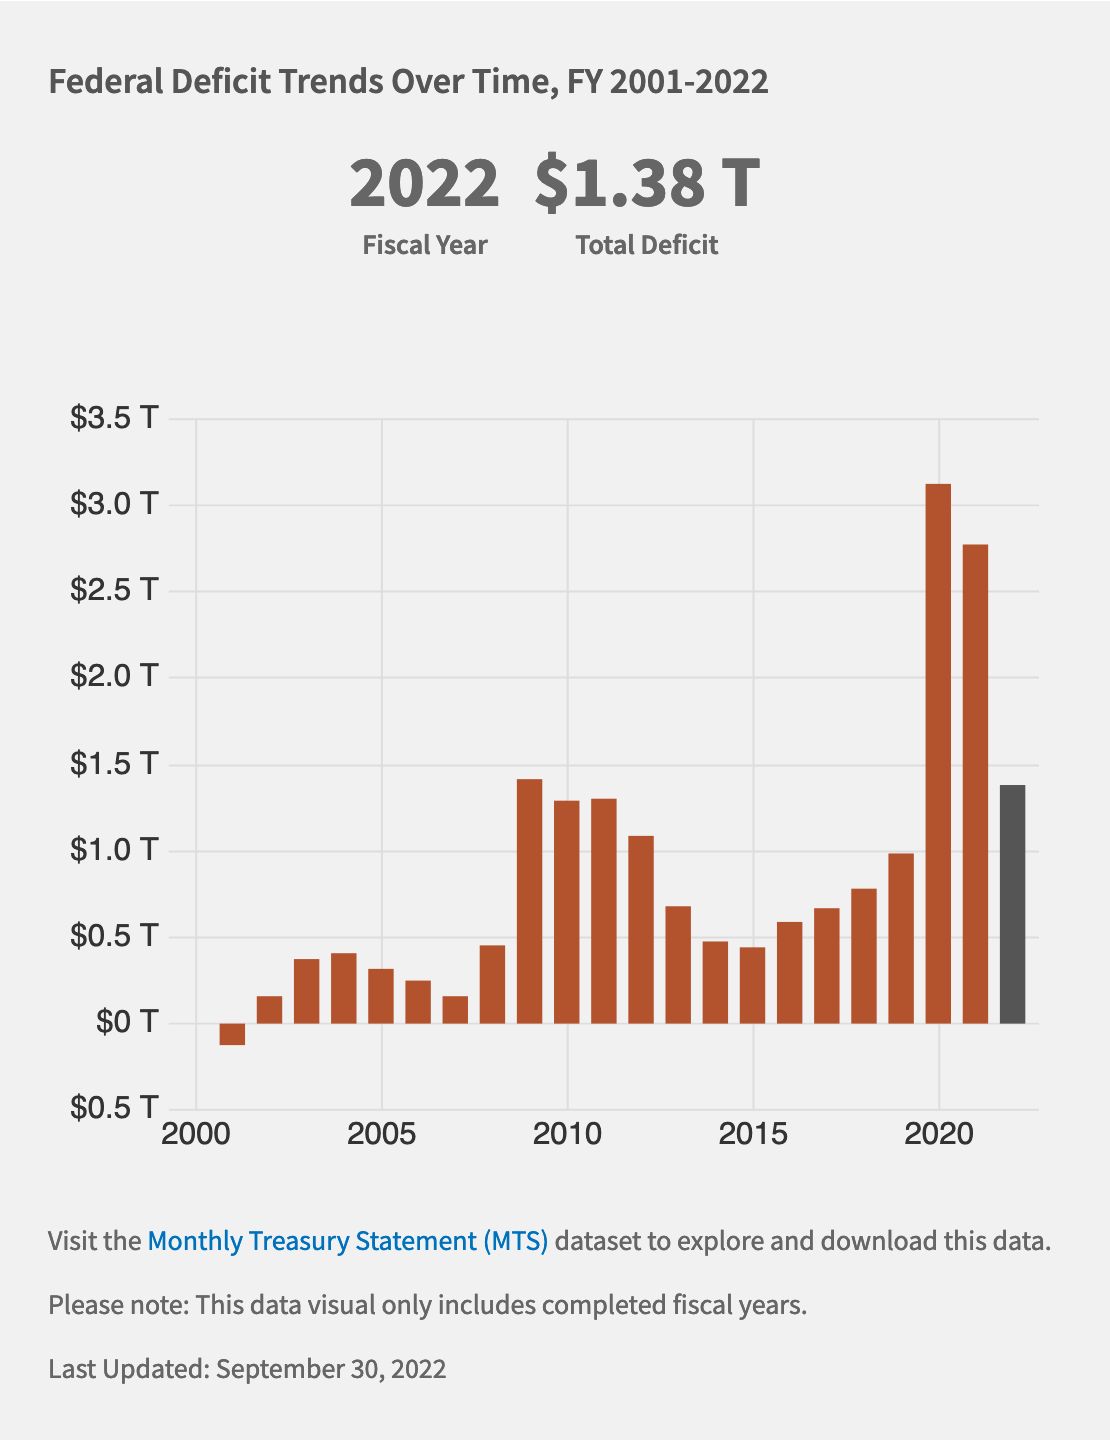
Government budget deficits (ANG Traders, stockcharts.com)
…but spending is higher in the first two months of fiscal 2023:
The federal budget deficit was $335 billion in October and November 2022, CBO estimates. But for the shift of some payments into September, the deficit would have been $399 billion, $42 billion more than the corresponding shortfall last year. (Budget fiscal year starts Oct. 1).
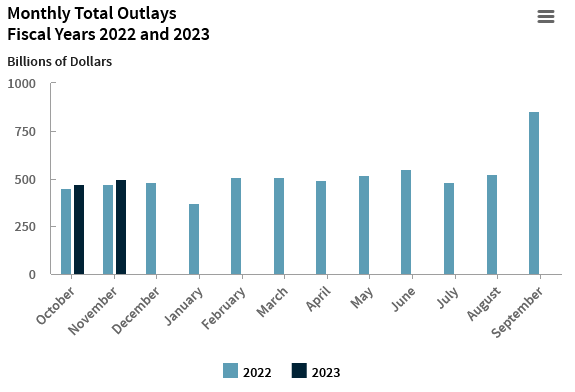
Spending (Federal Budget Office)
Before the December 16, 2023 tax-date, the daily net-spending 20-day average was $12B/day, or $2.9T/year which is back to pandemic-level fiscal stimulus. A recession is hardly possible if this rate of fiscal injection continues… and with an 8.7% increase to Social Security this January, a high rate of spending is likely to be maintained. The chart below shows the average rate-of-change of the SPX according to the net-transfer rate.
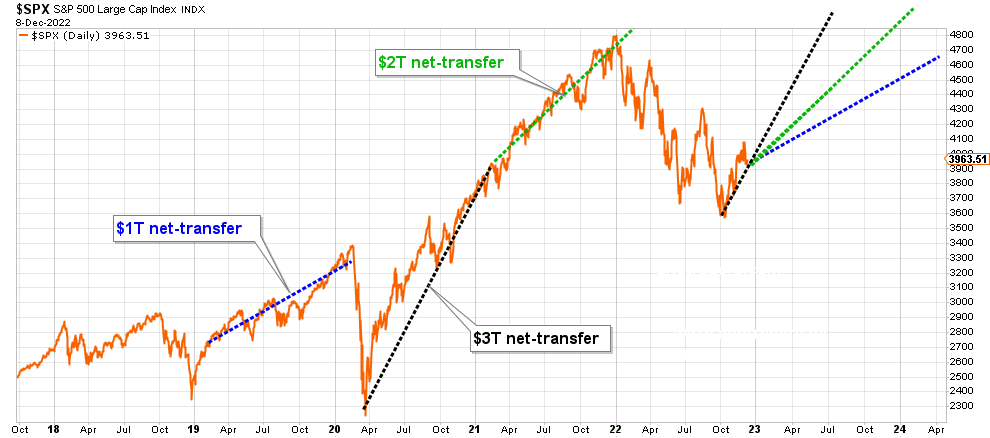
Spending rates (ANG Traders, stockcharts.com)
If the current rate of $3T/year is maintained throughout 2023, then the SPX could finish the year at 5800 (a 45% increase). If the net-transfer rate is reduced to $2T/year, then the SPX would be on pace to close out 2023 at 4900 (a 23% increase). And if we return to the pre-pandemic rate of $1T/year, then the SPX is only expected to reach 4500 (a 12% increase).
If we remove the most and least optimistic rates of Government net-transfers, we expect the S&P 500 to finish 2023 at 4900 or a 23% increase.
The proverbial fly in the ointment:
The GOP will take control of the house in the new year and several of their members are pushing to “balance the budget”. Recall what this means; every dollar that is spent (added to the private-sector) will be taxed back (taken away from the private sector).
To accomplish this they have to either cut spending and/or increase taxes. Since most of the spending is not discretionary–i.e. is automatic, such as social security and Medicare (military is officially discretionary, but nobody is willing to reduce that spending)—the cuts would have to come from infrastructure spending which the US sorely needs.
Reducing the net-spending (net-transfers) to below the $1T/year rate could cause a recession and the stock market to drop further.
In the end, our assessment is that net-transfers will not fall below $1T/year and that the SPX will rise to 4900 if Congress does not push for a balanced budget.
Be the first to comment