

imaginima/E+ via Getty Images
By Thomas Alonso
Following on work done by our colleague Tajinder Dhillon (here) we took a closer look at the CAPEX and net profit of US oil producers.
Using Refinitiv Datastream, we looked at net profit and capital expenditures (CAPEX) for US oil producers. While margins have recently reached record highs for the Energy sector in the S&P 500 as oil prices have risen, we would note that overall net profit for US producers remains below record levels seen in 2012 (blue line in Exhibit 1).
Further, while there has been a great deal of attention paid to investment by oil producers, we would note that CAPEX (black line below) for US oil producers has historically outpaced net profit and normally tracks closer to Free Cash Flow (grey line below). Additionally, even in periods when profits went negative, oil producers continued to invest in production with CAPEX remaining well above the level of net profit for most of the period we examined below.
Exhibit 1: US Oil Producer Net Income, CAPEX and Free Cash Flow (Refinitiv Datastream / Thomas Alonso, CFA)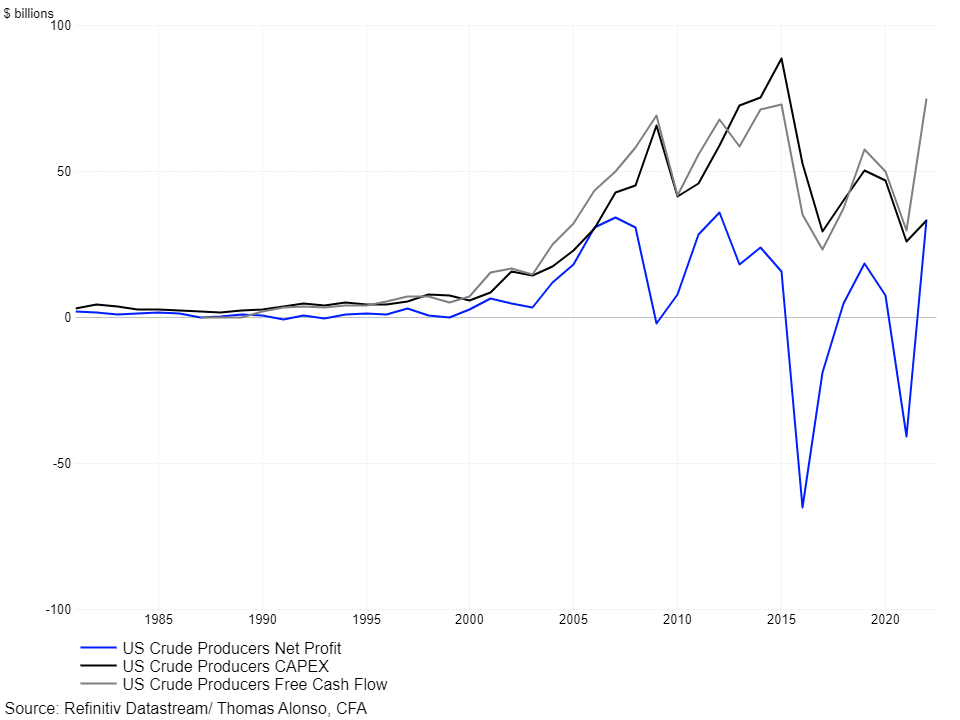
While CAPEX in the above chart has declined recently, it is likely to rebound as free cash flow has improved, and this seems to be borne out in the numbers. In Exhibit 2, we look at 12m forward CAPEX estimates for the US Producers and compare it to 12m forward sales. Below, we see that forward CAPEX has risen from pandemic lows, increasing 36.5% YoY, but has been more than outpaced by the 74.5% increase in forward sales. As such, the forward CAPEX/Sales ratio has declined to 17.1% below the longer-term average of 27.4% as shown in the lower pane below.
Exhibit 2: US Oil Producer 12m Forward CAPEX and Sales (Refinitiv Datastream / Thomas Alonso, CFA)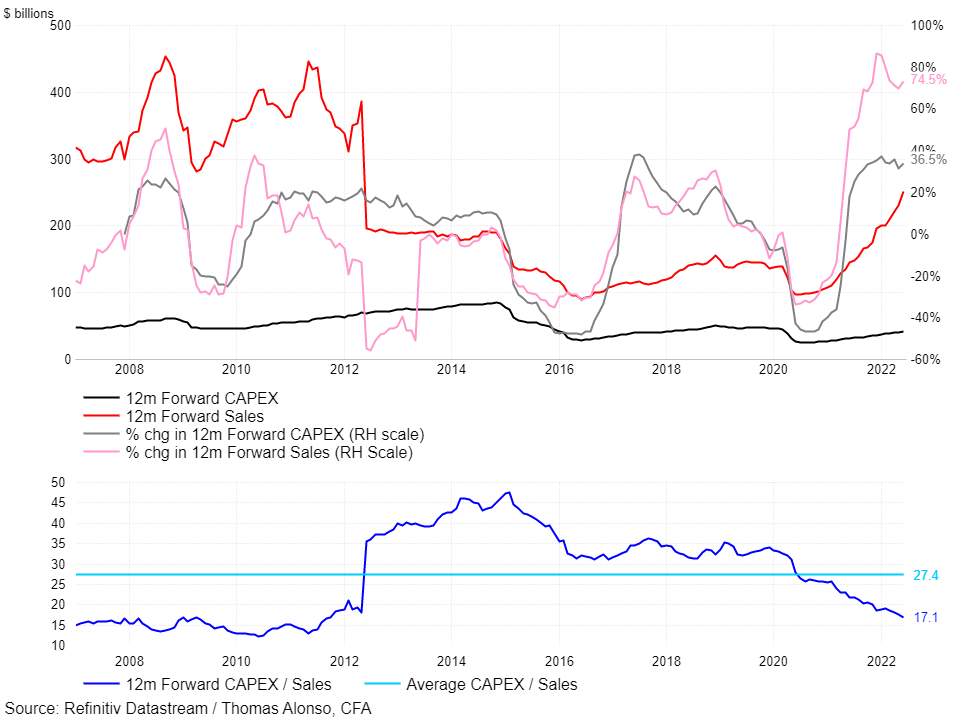
We see similar trends in the trailing CAPEX to sales ratio with the decline of late driven by a large increase in sales due to the increase in price of the commodity. We would further note that oil producers typically reinvest a much larger percentage of sales back into CAPEX than the overall market. As shown in the chart below, the average CAPEX/sales ratio over the past 40 years for oil producers has averaged 18.9% compared to 6.8% for the total market.
Exhibit 3: US Oil Producer CAPEX to Sales Ratio vs Total Market (Refinitiv Datastream / Thomas Alonso, CFA)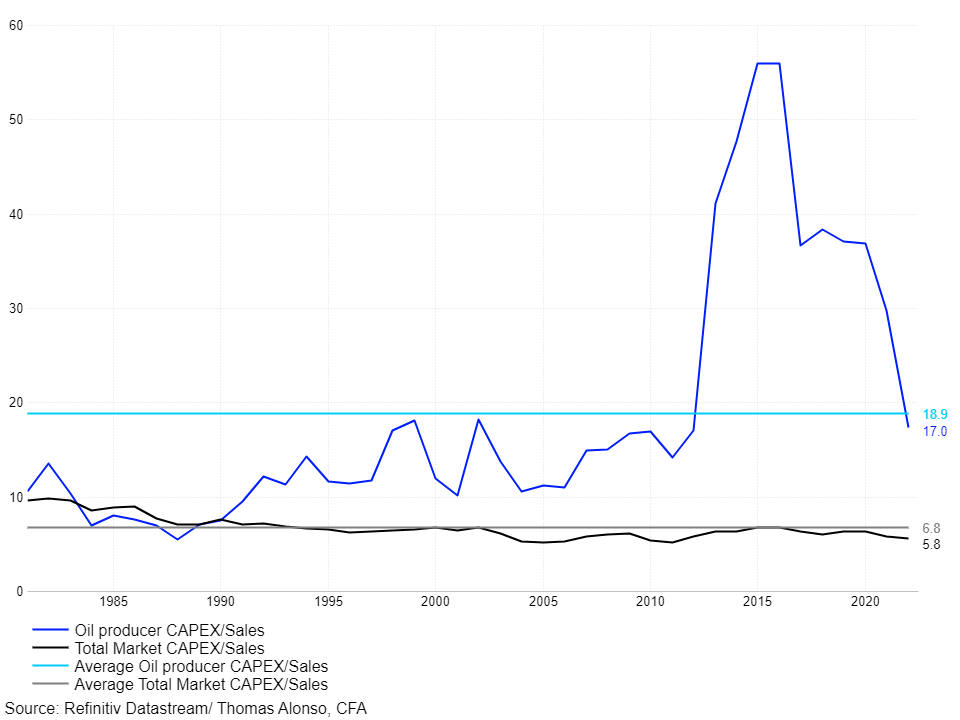
Editor’s Note: The summary bullets for this article were chosen by Seeking Alpha editors.
Be the first to comment