

AscentXmedia/E+ via Getty Images
Maxing out your tax-advantaged retirement accounts is one of the best long-term strategies for achieving a rich retirement.
As a small business owner, I’m fortunate to be able to invest up to $61K per year into a 401(k) and Roth IRA.
Morningstar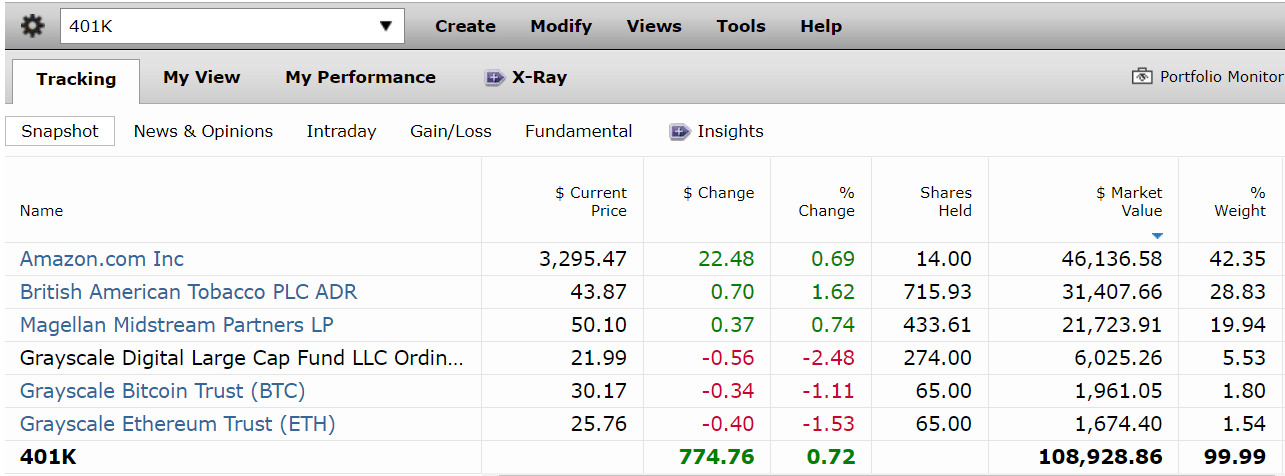
The strategy I use is based on a very simple but effective bar-bell approach of maximizing safe yield and growth through Ultra SWAN quality companies.
In the last two years, I’ve started with buying the optimal combination of yield and growth at the start of each year, which was Magellan Midstream (MMP), British America Tobacco (BTI), and Amazon (AMZN).
Morningstar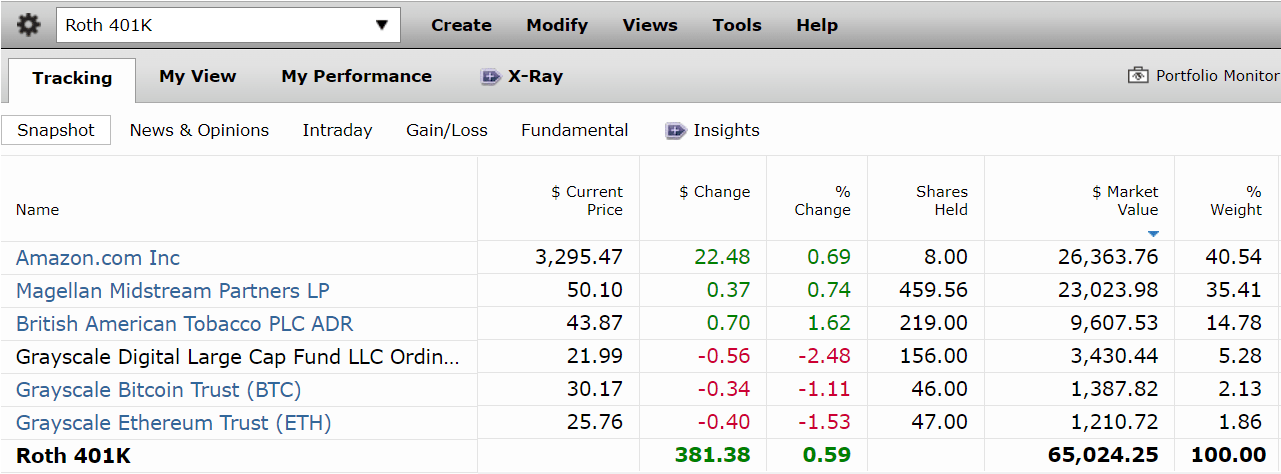
However, over time I plan to diversify my retirement accounts for two main reasons.
- dividends from several Ultra SWANs are always much safer than even the single safest Ultra SWAN (more diversified cash flow)
- financial science is a statistical science and owning just a handful of companies exposes you to the risk of companies not growing as expected or suffering significant fundamental deterioration
So today I wanted to highlight the eight Ultra SWANs I plan to buy in the coming years, to steadily improve the safety and quality of my retirement accounts.
In this article, we’ll review the exceptional fundamentals of these Ultra SWANs.
You’ll see why you might to consider buying them yourselves, not just for 2022 or 2023, but because they can help you retire in safety and splendor in the years and decades to come.
How I Chose These Retirement Dream Stocks For My Retirement Accounts
The correction planning tool is my personal favorite tool among the almost 20 we offer our members.
Dividend Kings Home Page
The DK correction watchlist is a template tool we created that allows our members to see every blue-chip I’m planning to buy in future market downturns.
- going to “file” and “make a copy” allows you to create a personalized version you can edit to create your own optimal correction buying plan
(Source: Dividend Kings Correction Planning Tool)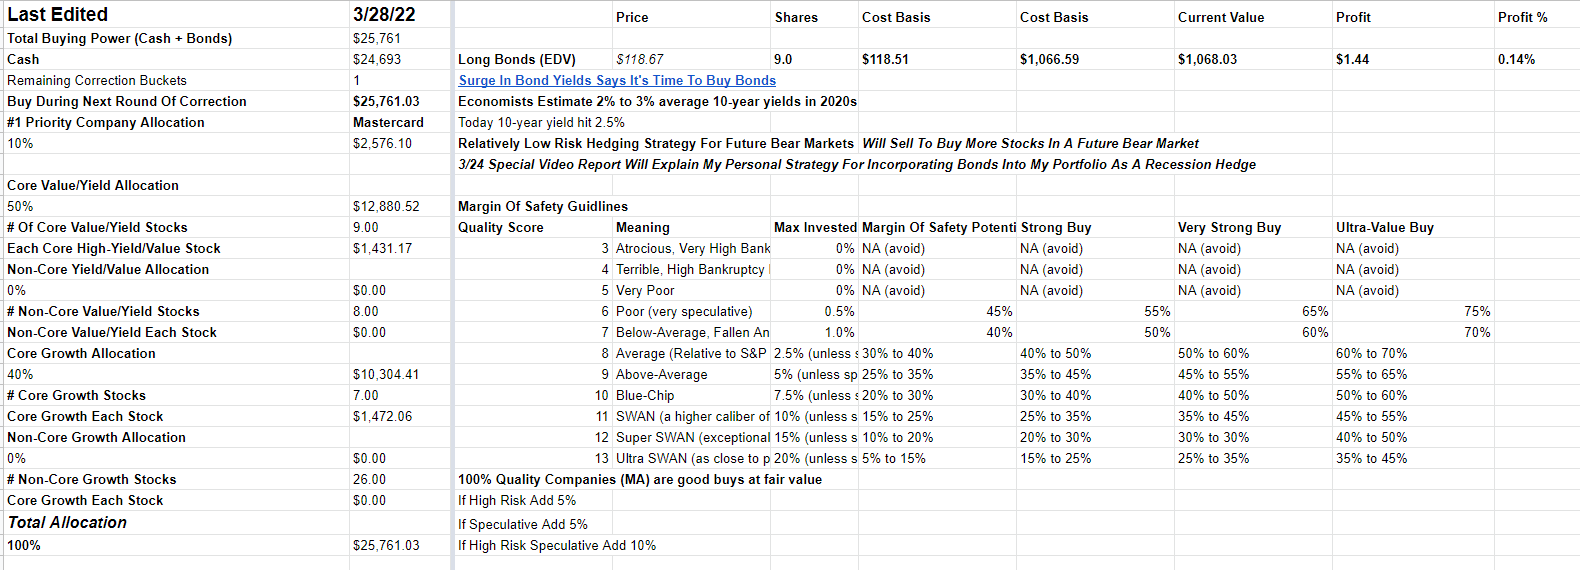
The correction planning tool allows you to split your savings, among cash and bonds, and decide how many times you want to buy in any given downturn.
Here’s how I’ve split my correction savings:
- into 4 equal buckets during non-recessionary corrections
- into 7 equal buckets if recession-risk is elevated (inverted yield curve)
And here’s when I put these correction savings buckets to work.
- -5% S&P 500 from record highs (pullback)
- -10% (correction)
- -15% (average peak intra-year decline on S&P)
- -20% (bear market) – historical non-recessionary bear market low
- -25%
- -30%
- -35% (historical recessionary bear market low)
Ben Carlson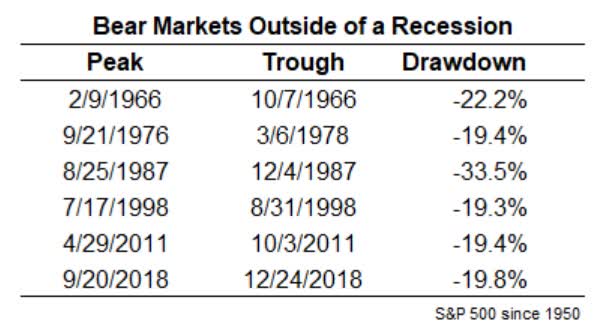
Because historically, since 1950, non-recessionary bear markets tend to bottom at about -20% as we saw in 2011, and 2018.
Recessionary bear markets average a bottom of -36%.
My goal is to ensure that I’m buying all the way down in any given downturn.
What if I run out of savings and the market falls 40%? 45%? or 50%?
Well, my monthly savings rate is about $10K and such market crashes tend to be rare, averaging once every 25 years.
Guggenheim Partners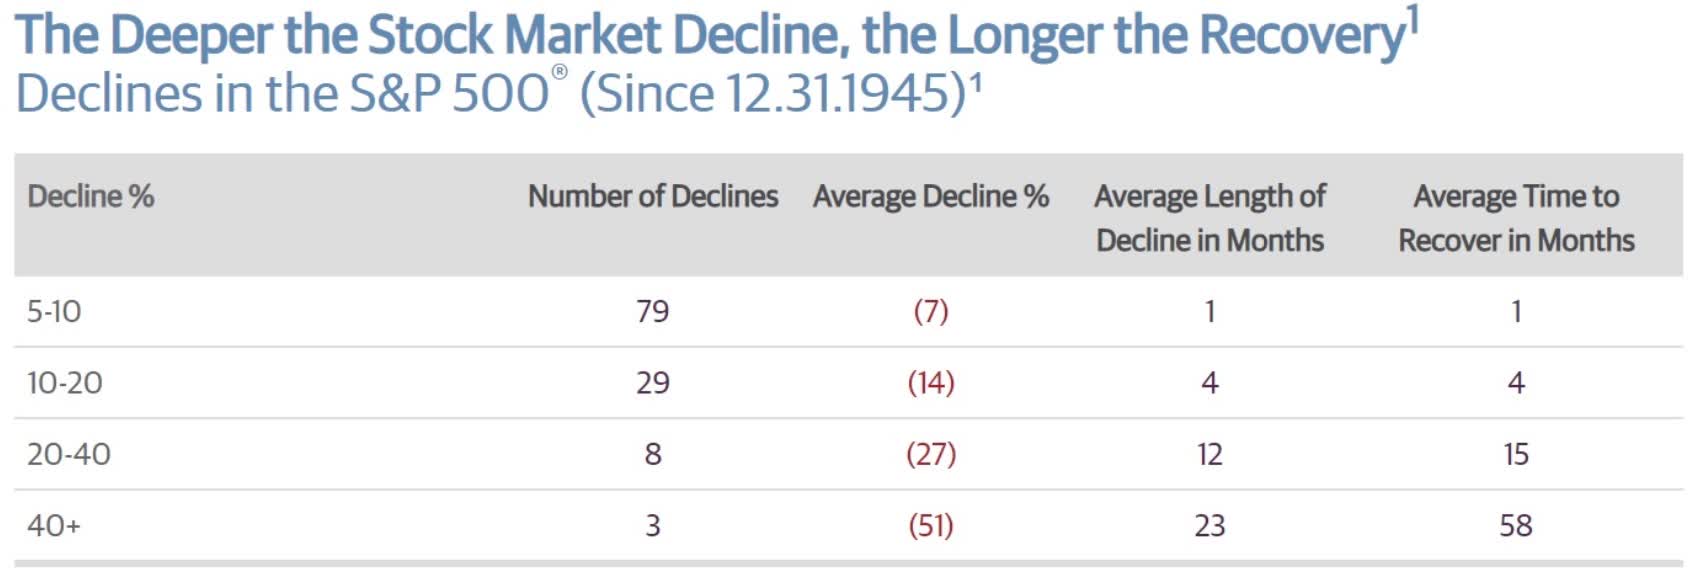
They also tend to last a long time, with stocks falling for two years before bottoming and then averaging almost six years before returning to record highs.
In other words, in a market crash the blue-chip bargains last a very long-time, and anyone with excess dividends or savings to put to work can take advantage of life-changing investment opportunities.
(Source: Dividend Kings Correction Planning Tool)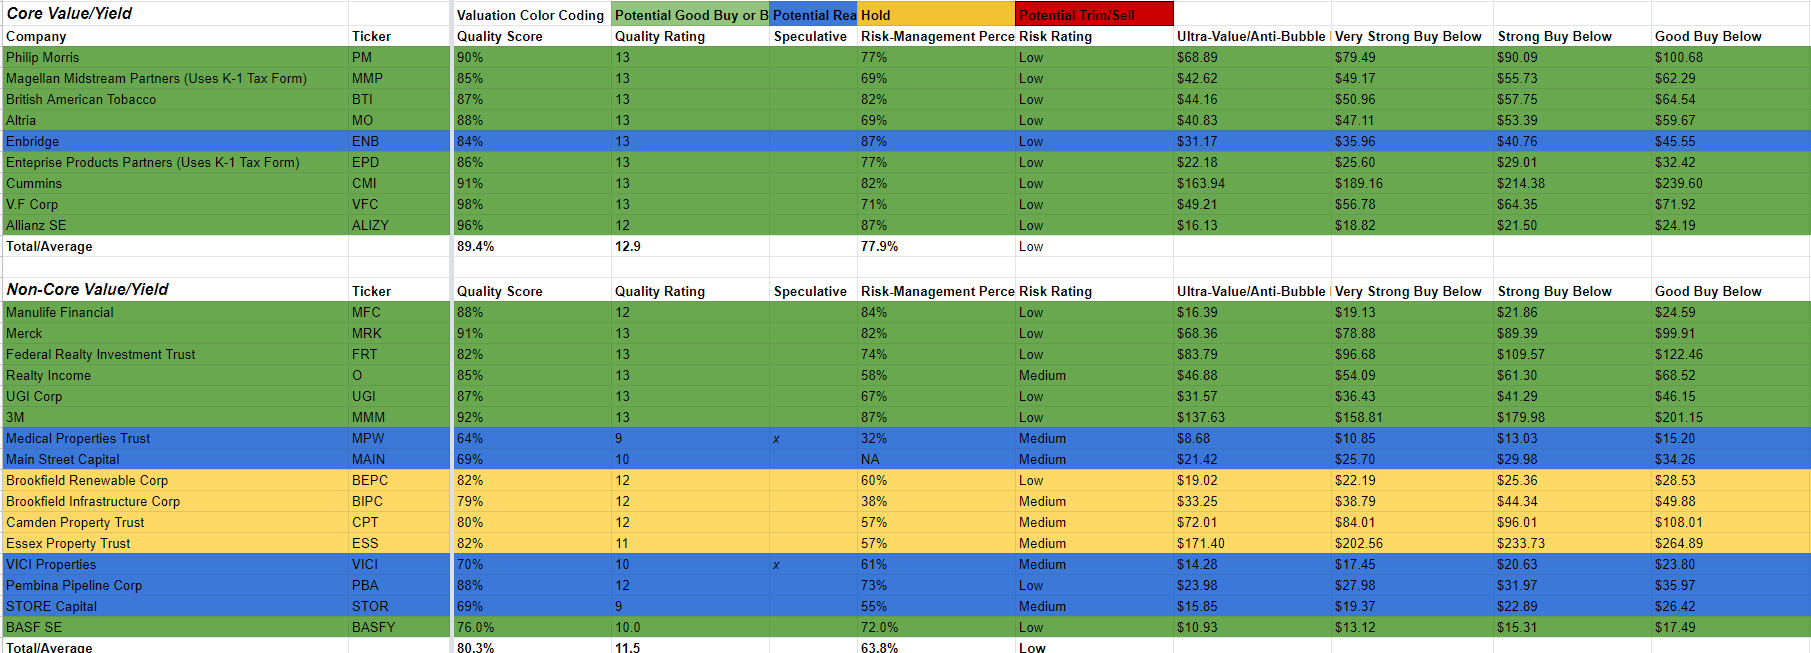
I created the correction planning tool to let you prioritize core and non-core companies, and weight them any way you want based on your specific goals.
- core companies: highest conviction companies, top priority for new savings, higher target allocation
- non-core companies: great companies but not as much of a “fat pitch” and lower target allocations
The tool also lets you program valuation color codes to determine whether a company is a potentially reasonable buy, a potentially good buy, strong buy, very strong buy or Ultra Value buy.
| Quality Score | Meaning | Max Invested Capital Risk Recommendation | Margin Of Safety Potentially Good Buy | Strong Buy | Very Strong Buy | Ultra-Value Buy |
| 3 | Atrocious, Very High Bankruptcy Risk | 0% | NA (avoid) | NA (avoid) | NA (avoid) | NA (avoid) |
| 4 | Terrible, High Bankruptcy Risk | 0% | NA (avoid) | NA (avoid) | NA (avoid) | NA (avoid) |
| 5 | Very Poor | 0% | NA (avoid) | NA (avoid) | NA (avoid) | NA (avoid) |
| 6 | Poor (very speculative) | 0.5% | 45% | 55% | 65% | 75% |
| 7 | Below-Average, Fallen Angels (speculative) | 1.0% | 40% | 50% | 60% | 70% |
| 8 | Average (Relative to S&P 500) | 2.5% (unless speculative or high risk than 1.0%) | 30% to 40% | 40% to 50% | 50% to 60% | 60% to 70% |
| 9 | Above-Average | 5% (unless speculative or high risk than 2.5%) | 25% to 35% | 35% to 45% | 45% to 55% | 55% to 65% |
| 10 | Blue-Chip | 7.5% (unless speculative or high risk than 2.5%) | 20% to 30% | 30% to 40% | 40% to 50% | 50% to 60% |
| 11 | SWAN (a higher caliber of Blue-Chip) | 10% (unless speculative or high risk than 2.5%) | 15% to 25% | 25% to 35% | 35% to 45% | 45% to 55% |
| 12 | Super SWAN (exceptionally dependable blue-chips) | 15% (unless speculative or high risk than 2.5%) | 10% to 20% | 20% to 30% | 30% to 30% | 40% to 50% |
| 13 | Ultra SWAN (as close to perfect companies as exist) | 20% (unless speculative or high risk than 2.5%) | 5% to 15% | 15% to 25% | 25% to 35% | 35% to 45% |
|
100% Quality Companies (MA) are good buys at fair value |
| If High Risk Add 5% |
| If Speculative Add 5% |
|
If High Risk Speculative Add 10% |
The margin of safety requirement for any given company is a function of both its overall quality and its risk profile.
The Dividend King’s overall quality scores are based on a 241 point model that includes:
-
dividend safety
-
balance sheet strength
-
credit ratings
-
credit default swap medium-term bankruptcy risk data
-
short and long-term bankruptcy risk
-
accounting and corporate fraud risk
-
profitability and business model
-
growth consensus estimates
-
management growth guidance
-
historical earnings growth rates
-
historical cash flow growth rates
-
historical dividend growth rates
-
historical sales growth rates
-
cost of capital
-
long-term risk-management scores from MSCI, Morningstar, FactSet, S&P, Reuters’/Refinitiv, and Just Capital
-
management quality
-
dividend friendly corporate culture/income dependability
-
long-term total returns (a Ben Graham sign of quality)
-
analyst consensus long-term return potential
In fact, it includes over 1,000 fundamental metrics including the 12 rating agencies we use to assess fundamental risk.
- 41% based on credit and risk-management ratings
- 82% focused on fundamental risk
How do we know that our safety and quality model works well?
During the two worst recessions in 75 years, our safety model 87% of blue-chip dividend cuts, the ultimate baptism by fire for any dividend safety model.
In other words, a 100% quality low-risk Ultra SWAN like Mastercard (MA) is a potentially ultra-value “fat pitch” table-pounding buy at a 30% discount while a lower quality, highly speculative growth stock might not be an ultra-value buy unless it’s trading a 70% margin of safety.
- highly speculative companies (like SE) have a 1% OR LESS max risk cap recommendation
- while Ultra SWANs have a 20% OR LESS max risk cap recommendation
The correction planning tool doesn’t just let you plan out which companies you want to buy and in what amounts and allocations, it also helps you optimize your portfolio for your specific goals.
(Source: Dividend Kings Correction Planning Tool)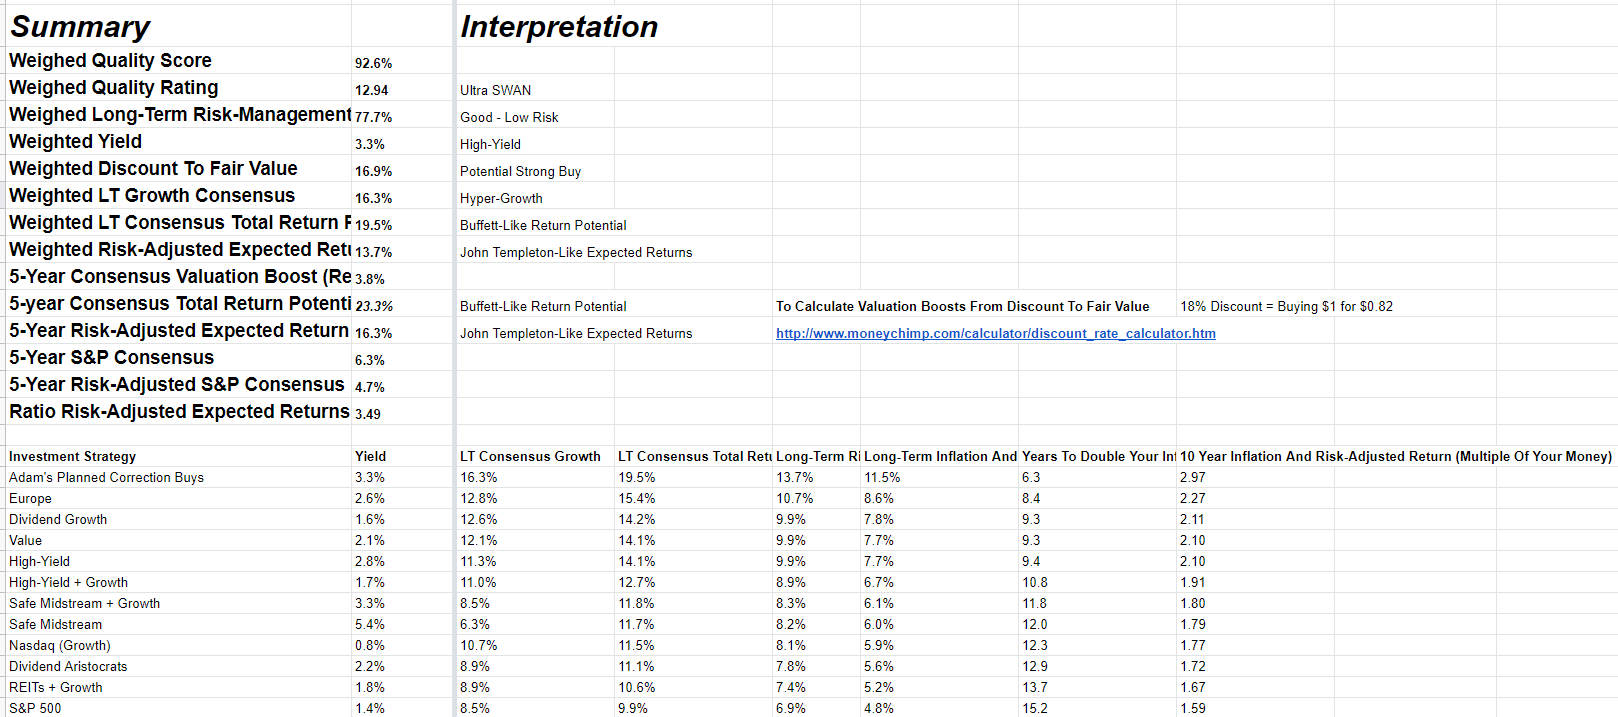
For example, right now I have only $25,000 left in my correction savings, so I’m focused on just my core yield/growth Ultra SWANs.
These companies I’m buying in the next market downturn have a weighted yield of 3.3%, which is more than 2X that of the S&P 500.
- also 0.6% higher yield than Vanguard’s high-yield ETF (VYM)
More importantly, with recession risk rising (the bond market thinks a mild recession is coming in early 2024), I’m focused on the world’s safest and most dependable companies.
My weighted quality score is 93% Ultra SWAN.
- compared to the average dividend aristocrat’s 85% 11.7/12 Super SWAN quality
My weighted Ultra SWANs are 17% undervalued compared to the S&P 500’s 19% historical premium
S&P 500 Valuation Profile
| Year | EPS Consensus | YOY Growth | Forward PE | Blended PE | Overvaluation (Forward PE) |
Overvaluation (Blended PE) |
| 2021 | $206.30 | 50.38% | 20.7 | 21.9 | 20% | 25% |
| 2022 | $225.37 | 9.24% | 20.2 | 20.4 | 17% | 16% |
| 2023 | $248.05 | 10.06% | 18.3 | 19.2 | 6% | 9% |
| 2024 | $275.12 | 10.91% | 16.5 | 17.4 | -4% | -1% |
| 12-Month forward EPS | 12-Month Forward PE | Historical Overvaluation | PEG | 25-Year Average PEG | S&P 500 Dividend Yield |
25-Year Average Dividend Yield |
| $227.28 | 19.989 | 18.63% | 2.35 | 3.62 | 1.41% | 2.01% |
(Source: DK S&P 500 Valuation And Total Return Tool)
This means that in addition to the 19.5% CAGR that analysts think my Ultra SWANs can deliver over the long-term (3.3% yield and 16.2% growth), I could benefit from a 3.8% annual valuation boost created by valuation mean reversion.
- weighted 5-year consensus total return potential: 23.3%
- risk-adjusted expect return 16.3% CAGR
- S&P risk-adjusted expected return 4.7% CAGR
- 3.5X the S&P 500’s risk-adjusted expected returns
Even adjusting for the risk of these companies not growing as expected, and inflation, I can expect 11.5% risk and inflation-adjusted returns, which is far better than any major investing strategy on Wall Street.
- that you can buy with a mutual fund or ETF
| Investment Strategy | Yield | LT Consensus Growth | LT Consensus Total Return Potential | Long-Term Risk-Adjusted Expected Return | Long-Term Inflation And Risk-Adjusted Expected Returns | Years To Double Your Inflation- And Risk-Adjusted Wealth |
10 Year Inflation And Risk-Adjusted Return (Multiple Of Your Money) |
| Adam’s Planned Correction Buys | 3.3% | 16.3% | 19.5% | 13.7% | 11.5% | 6.3 | 2.97 |
| Europe | 2.6% | 12.8% | 15.4% | 10.7% | 8.6% | 8.4 | 2.27 |
| Dividend Growth | 1.6% | 12.6% | 14.2% | 9.9% | 7.8% | 9.3 | 2.11 |
| Value | 2.1% | 12.1% | 14.1% | 9.9% | 7.7% | 9.3 | 2.10 |
| High-Yield | 2.8% | 11.3% | 14.1% | 9.9% | 7.7% | 9.4 | 2.10 |
| High-Yield + Growth | 1.7% | 11.0% | 12.7% | 8.9% | 6.7% | 10.8 | 1.91 |
| Safe Midstream + Growth | 3.3% | 8.5% | 11.8% | 8.3% | 6.1% | 11.8 | 1.80 |
| Safe Midstream | 5.4% | 6.3% | 11.7% | 8.2% | 6.0% | 12.0 | 1.79 |
| Nasdaq (Growth) | 0.8% | 10.7% | 11.5% | 8.1% | 5.9% | 12.3 | 1.77 |
| Dividend Aristocrats | 2.2% | 8.9% | 11.1% | 7.8% | 5.6% | 12.9 | 1.72 |
| REITs + Growth | 1.8% | 8.9% | 10.6% | 7.4% | 5.2% | 13.7 | 1.67 |
| S&P 500 | 1.4% | 8.5% | 9.9% | 6.9% | 4.8% | 15.2 | 1.59 |
| Realty Income | 4.6% | 5.2% | 9.8% | 6.9% | 4.7% | 15.4 | 1.58 |
| REITs | 2.9% | 6.5% | 9.4% | 6.6% | 4.4% | 16.4 | 1.54 |
| 60/40 Retirement Portfolio | 2.1% | 5.1% | 7.2% | 5.1% | 2.9% | 24.9 | 1.33 |
| 10-Year US Treasury | 2.2% | 0.0% | 2.2% | 1.5% | -0.7% | -108.9 | 0.94 |
(Sources: Morningstar, FactSet, Ycharts)
In fact, I can realistically expect to double my risk and inflation-adjusted money every 6.3 years with the Ultra SWANs that I’m targeting in the next correction.
Basically, the correction planning tool is a great way to ensure you can profit from every market downturn.
When Russia invaded Ukraine on the morning of February 24th, and the market hit -14.5% pre-market, I didn’t have to wonder “what should I buy” or even whether I should buy.
I just had to execute on a reasonable and prudent plan I had set up ahead of time.
- during this correction, I was able to put $225,000 to work
- in dozens of wonderful companies
- and I emailed the buy notifications to DK members as I made each purchase
Luck is what happens when preparation meets opportunity.” – Roman Philosopher Seneca the younger
What kind of opportunities were I and DK members able to take advantage of in just the last few months?
- Chegg (CHGG) +44%
- Crowdstrike (CRWD) +39%
- Block (SQ) +35%
- MercadoLibre (MELI) +25%
- Universal Display (OLED) +22%
- Amazon (AMZN) +19%
- Target (TGT) +18%
- NextEra Energy Partners (NEP) +15%
- Shopify (SHOP) +15%
- Caterpillar (CAT) +13%
- Enbridge (ENB) +11%
- Roku (ROKU) +11%
- Alphabet (GOOG) +11%
And these are just the companies that are up double-digits since I bought them on February 24th.
You can see why we don’t fear corrections, or market volatility, but embrace them as we would a lover.
Volatility isn’t risk, it’s the source of future returns.” – Joshua Brown, CEO of Ritholtz Wealth Management
So now let me show you which core Ultra SWAN yield and growth blue-chips I’m planning on adding to my 401(k) and Roth IRA in the coming years, and why you might want to do the same.
8 Rich Retirement Dream Stocks I’m Buying For My 401(k)… And You Might Want To As Well
(Source: DK Research Terminal)
Why these eight Ultra SWANs? Just take a look at their fundamentals.
World-Class Quality That Can Withstand Any Recession
| Company | Quality Rating (out Of 13) | Quality Score (Out Of 100) | Dividend/Balance Sheet Safety Rating (out of 5) | Safety Score (Out Of 100) | Dependability Rating (Out Of 5) | Dependability Score (out Of 100) |
| Enbridge | 13 | 84% | 5 | 87% | 5 | 85% |
| Enterprise Products Partners (uses K-1 tax form) | 13 | 86% | 5 | 90% | 5 | 83% |
| Philip Morris International | 13 | 90% | 5 | 91% | 5 | 89% |
| Altria | 13 | 88% | 5 | 91% | 5 | 83% |
| Mastercard | 13 | 100% | 5 | 100% | 5 | 100% |
| Autodesk | 13 | 95% | 5 | 98% | 5 | 100% |
| V.F. Corp. | 13 | 98% | 5 | 100% | 5 | 100% |
| Lowe’s | 13 | 92% | 5 | 94% | 5 | 89% |
| Average | 13.0 Ultra SWAN | 91.6% | 5.0 Very Safe | 93.9% | 5.0 Exceptional | 91.1% |
(Source: DK Research Terminal)
For context, the aristocrats:
- low-risk (67th industry percentile risk-management)
- 85% quality
- 11.7/13 Super SWAN
These Ultra SWANs offer even higher safety, quality, and dependability than the aristocrats, the bluest of blue-chips.
How safe?
| Rating | Dividend Kings Safety Score (151 Point Safety Model) | Approximate Dividend Cut Risk (Average Recession) |
Approximate Dividend Cut Risk In Pandemic Level Recession |
| 1 – unsafe | 0% to 20% | over 4% | 16+% |
| 2- below average | 21% to 40% | over 2% | 8% to 16% |
| 3 – average | 41% to 60% | 2% | 4% to 8% |
| 4 – safe | 61% to 80% | 1% | 2% to 4% |
| 5- very safe | 81% to 100% | 0.5% | 1% to 2% |
| 401(k) Ultra SWANs | 94% | 0.5% | 1.30% |
| Risk Rating | Low Risk (79th industry percentile risk-management consensus) | BBB+ stable outlook credit rating 4.2% 30-year bankruptcy risk |
20% OR LESS Max Risk Cap Recommendation (Each) |
(Source: DK Research Terminal)
During the average recession since WWII, the risk of these Ultra SWANs cutting their dividends is about 1 in 200.
Even in a Pandemic or Great Recession level downturn, the risk is about 1.3%.
- average aristocrat safety score: 87%
Why are these dividends so safe?
| Company | Payout Ratio | Industry Safe Payout Ratio Guideline | Debt/Capital | Industry Safe Debt/Capital Guideline |
| Enbridge | 68% | 83% | 48% | 60% |
| Enterprise Products Partners (uses K-1 tax form) | 62% | 83% | 52% | 60% |
| Philip Morris International | 78% | 85% | 138% | 60% |
| Altria | 80% | 85% | 101% | 60% |
| Mastercard | 18% | 60% | 63% | 40% |
| Autodesk | NA | 60% | 68% | 40% |
| V.F. Corp. | 78% | 60% | 57% | 40% |
| Lowe’s | 25% | 60% | 95% | 40% |
| Average | 58.4% | 72.0% | 77.8% | 50.0% |
(Source: DK Research Terminal)
Rating agencies consider 60% a safe payout ratio for most companies and 72% for these Ultra SWANs. Their payout ratio of 58% is why they have such excellent dividend growth streaks even through two of the worst recessions in over 75 years.
Their balance sheets are stronger than they look.
- Elevated debt/capital is primarily a result of tobacco company buybacks
When a company buys back stock above book value it reduces shareholder equity and pushes up debt/capital.
- Shares that are repurchased sit on the balance sheet as treasury stock
- Which is primarily used for stock option compensation for employees
- It’s treated as a liability
- In fact, it’s an asset that can be sold to raise cash
You can see this from the fact that companies like PM, MO, and LOW have strong credit ratings despite very high debt/capital ratios.
| Company | Long-Term Risk Management Consensus Industry Percentile | Risk-Rating | Risk-Management Rating | S&P Credit Rating | 30-Year Bankruptcy Risk |
| Enbridge | 87% | Low | Very Good | BBB+ | 5.00% |
| Enterprise Products Partners (uses K-1 tax form) | 77% | Low | Good | BBB+ | 5.00% |
| Philip Morris International | 77% | Low | Good | A | 0.66% |
| Altria | 69% | Low | Above-Average | BBB | 7.50% |
| Mastercard | 82% | Low | Very Good | A+ | 0.60% |
| Autodesk | 84% | Low | Very Good | BBB | 7.50% |
| V.F. Corp. | 71% | Low | Good | A- | 2.50% |
| Lowe’s | 84% | Low | Very Good | BBB+ | 5.00% |
| Average | 78.9% | Low | Good (Bordering On Very Good) | BBB+ | 4.2% |
(Source: DK Research Terminal)
S&P estimates an average risk of 30-year bankruptcy at 4.2%, meaning a BBB+ stable credit rating.
Our risk-management ratings are based on the consensus of six rating agencies. For context:
- master list average: 62nd percentile (above-average)
- dividend kings: 63rd percentile (above-average)
- aristocrats: 67th percentile (above-average)
- Ultra SWANs: 71st percentile (GOOD)
Rating agencies consider these Ultra SWANs low-risk with good, bordering on very good risk management, in the top 21% of their respective industries.
- successfully adaptable to challenges that periodically arise
| Company | Dividend Growth Streak (Years) | ROC (Greenblatt) | ROC Industry Percentile | 13-Year Median ROC |
| Enbridge | 26 | NA | NA | NA |
| Enterprise Products Partners (uses K-1 tax form) | 23 | NA | NA | NA |
| Philip Morris International | 52 | 198% | 83% | 170% |
| Altria | 52 | 712% | 85% | 416% |
| Mastercard | 10 | 623% | 95% | 830% |
| Autodesk | NA | 143% | 80% | 80% |
| V.F. Corp. | 50 | 82% | 91% | 54% |
| Lowe’s | 59 | 48% | 87% | 24% |
| Average | 38.9 Dividend Aristocrat | 301.0% | 86.8% Wide Moat | 262.2% Stable Moat |
(Source: DK Research Terminal)
Ben Graham considered a 20+ year dividend growth streak to be a sign of excellent quality.
Justin Law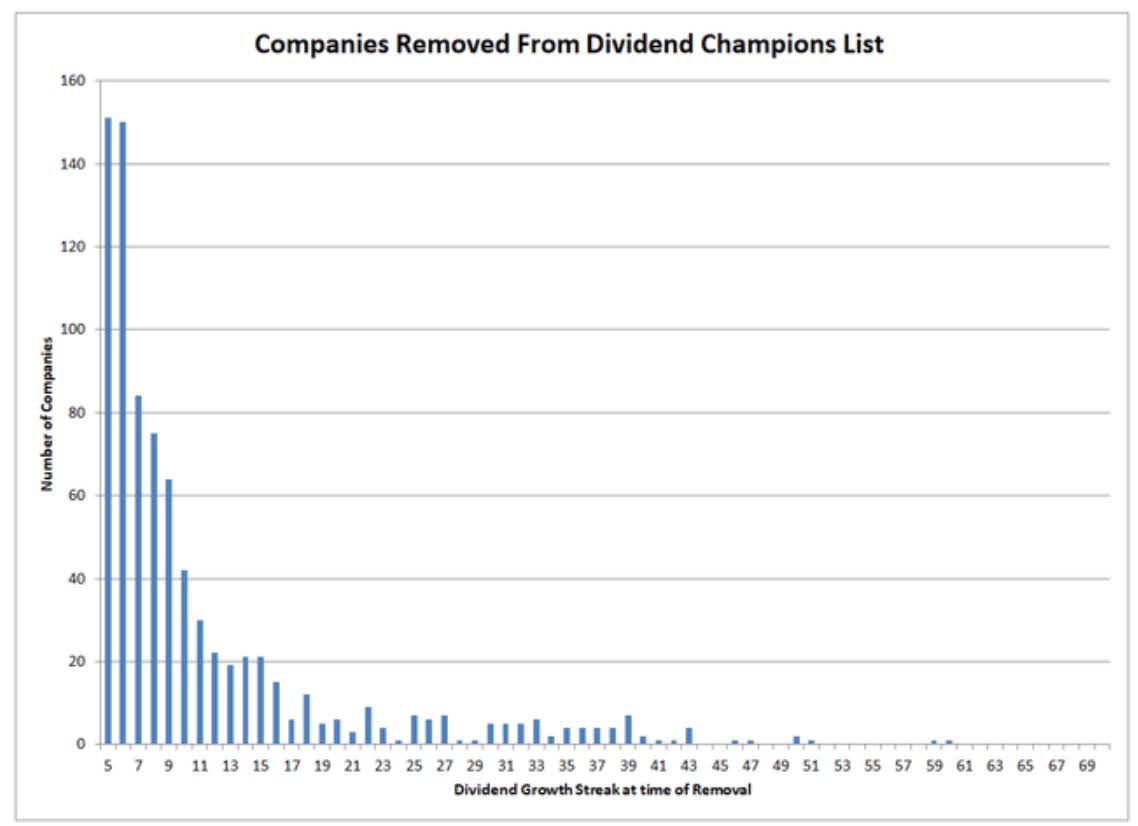
If a company has grown its dividends for 20+ years there is very little risk that it will cut its dividend or even fail to keep raising it in all economic and industry conditions.
The average dividend growth streak for these Ultra SWANs is nearly 40 years or 2X the Graham standard of excellence.
Return on capital is pre-tax profit/operating capital (the money it takes to run the business).
- Joel Greenblatt’s gold standard proxy for quality and moatiness
The S&P 500’s 2021 ROC was 14.6%.
- on average it takes the typical S&P company about 7 years to recoup investments they make
The average return on capital for these Ultra SWANs is 301%.
- average investment recouped in 4 months
- 21X higher quality than the average S&P 500 company
These Ultra SWAN’s ROC is in the top 13% of their industries, confirming a wide moat.
ROC is up almost 40% compared to the 13-year median, confirming a stable or improving moat.
Ok, so we can see that these are some of the world’s best companies.
And here’s why you might want to buy them today.
Wonderful Companies At Wonderful Prices
| Company | Discount To Fair Value | PE/EBITDA/FFO 2021 | PEG 2022 | 12-Month Consensus Total Return Potential | 12-Month Fundamentally Justified Upside Total Return Potential |
| Enbridge | 4.4% | 9.3 | 1.56 | 4.6% | 10.6% |
| Enterprise Products Partners (uses K-1 tax form) | 25.9% | 7.8 | 1.76 | 22.6% | 42.2% |
| Philip Morris International | 13.7% | 15.1 | 1.63 | 24.7% | 21.4% |
| Altria | 17.3% | 10.7 | 2.02 | 10.6% | 27.9% |
| Mastercard | 3.3% | 33.4 | 1.52 | 25.9% | 3.9% |
| Autodesk | 15.5% | 32.3 | 1.08 | 36.2% | 18.4% |
| V.F. Corp. | 24.6% | 16.2 | 1.25 | 32.8% | 36.1% |
| Lowe’s | 23.2% | 15.8 | 0.80 | 31.5% | 31.7% |
| Average | 16.0% Potentially Strong Buy | 17.6 | 1.45 | 23.6% | 24.0% |
(Source: DK Research Terminal)
These Ultra SWANs are 16% undervalued (strong buy), trading at a PEG of 1.45 vs. 2.35 for the S&P 500.
- 17.6 average PE vs. 20.0 for the S&P 500 (which is 20X lower quality according to Greenblatt ROC)
Analysts expect these Ultra SWANs to deliver 24% total returns in just the next 12 months, and those consensus forecasts are 100% justified by their fundamentals.
- the S&P 500 would need to be trading at a 22 PE to deliver 24% total returns in the next year
- in a rising rate environment, this is highly unlikely
- and would merely pull forward future returns
Ok, so we have the world’s safest and highest quality blue-chips, and available at very attractive valuations.
But here’s why I want to own them in my retirement accounts and you might want to do the same.
Long-Term Return Fundamentals To Help You Retire In Safety And Splendor
| Company | Yield | FactSet Long-Term Consensus Growth Rate | LT Consensus Total Return Potential | LT Risk-Adjusted Expected Return |
| Enbridge | 6.0% | 6.0% | 12.0% | 8.4% |
| Enterprise Products Partners (uses K-1 tax form) | 7.4% | 4.4% | 11.8% | 8.2% |
| Philip Morris International | 5.5% | 9.3% | 14.8% | 10.3% |
| Altria | 6.9% | 5.3% | 12.2% | 8.6% |
| Mastercard | 0.6% | 22.0% | 22.6% | 15.8% |
| Autodesk | 0.0% | 30.0% | 30.0% | 21.0% |
| V.F. Corp. | 3.5% | 13.0% | 16.5% | 11.6% |
| Lowe’s | 1.5% | 19.6% | 21.1% | 14.8% |
| Average | 3.9% | 13.7% | 17.6% | 12.3% |
(Source: DK Research Terminal)
For context:
- Nasdaq: 0.8% yield
- S&P 500: 1.4% yield
- Dividend Aristocrats: 2.3% yield
- Vanguard High-Yield ETF: 2.7% yield
- junk bonds: 4.2% yields
Junk bonds average a “B” credit rating indicating a 37% bankruptcy risk, or nearly 9X higher than these aristocrats according to S&P.
And junk bonds don’t offer exceptionally dependable dividend growth, as seen by almost four consecutive decades of rising payouts all economic, market, interest rate, and industry conditions.
In fact, analysts expect almost 14% long-term dividend growth from these Ultra SWANs.
And as for total returns?
| Investment Strategy | Yield | LT Consensus Growth | LT Consensus Total Return Potential | Long-Term Risk-Adjusted Expected Return | Long-Term Inflation And Risk-Adjusted Expected Returns | Years To Double Your Inflation & Risk-Adjusted Wealth |
10 Year Inflation And Risk-Adjusted Return |
| 401(k) Ultra SWANs | 3.9% | 13.7% | 17.6% | 12.3% | 10.1% | 7.1 | 2.63 |
| Europe | 2.6% | 12.8% | 15.4% | 10.7% | 8.6% | 8.4 | 2.27 |
| Value | 2.1% | 12.1% | 14.1% | 9.9% | 7.7% | 9.3 | 2.10 |
| High-Yield | 2.8% | 11.3% | 14.1% | 9.9% | 7.7% | 9.4 | 2.10 |
| High-Yield + Growth | 1.7% | 11.0% | 12.7% | 8.9% | 6.7% | 10.8 | 1.91 |
| Safe Midstream + Growth | 3.3% | 8.5% | 11.8% | 8.3% | 6.1% | 11.8 | 1.80 |
| Nasdaq (Growth) | 0.8% | 10.7% | 11.5% | 8.1% | 5.9% | 12.3 | 1.77 |
| Safe Midstream | 5.3% | 6.0% | 11.3% | 7.9% | 5.7% | 12.6 | 1.75 |
| Dividend Aristocrats | 2.2% | 8.9% | 11.1% | 7.8% | 5.6% | 12.9 | 1.72 |
| REITs + Growth | 1.8% | 8.9% | 10.6% | 7.4% | 5.2% | 13.7 | 1.67 |
| S&P 500 | 1.4% | 8.5% | 9.9% | 7.0% | 4.8% | 15.1 | 1.59 |
| Realty Income | 4.6% | 5.2% | 9.8% | 6.9% | 4.7% | 15.4 | 1.58 |
| Dividend Growth | 1.6% | 8.0% | 9.6% | 6.7% | 4.5% | 15.9 | 1.56 |
| REITs | 2.9% | 6.5% | 9.4% | 6.6% | 4.4% | 16.4 | 1.54 |
| 60/40 Retirement Portfolio | 2.1% | 5.1% | 7.2% | 5.1% | 2.9% | 24.9 | 1.33 |
| 10-Year US Treasury | 2.5% | 0.0% | 2.5% | 1.8% | -0.4% | -167.4 | 0.96 |
(Sources: Morningstar, FactSet, Ycharts)
Not only do these Ultra SWANs offer a superior yield to just about any high-yield ETF, but they also offer superior risk-adjusted returns to just about any investment strategy on Wall Street.
- analysts estimate investors to double their money, adjusted for inflation, approximately every 7.1 years
Inflation-Adjusted Consensus Return Potential: $1,000 Initial Investment
| Time Frame (Years) | 7.7% CAGR Inflation-Adjusted S&P Consensus | 9.0% Inflation-Adjusted Aristocrat Consensus | 15.4% CAGR Inflation-Adjusted 401(k) Ultra SWAN Consensus | Difference Between Inflation Adjusted 401(k) Ultra SWAN Consensus And S&P 500 |
| 5 | $1,449.03 | $1,540.04 | $2,048.36 | $599.32 |
| 10 | $2,099.70 | $2,371.71 | $4,195.76 | $2,096.06 |
| 15 | $3,042.53 | $3,652.52 | $8,594.41 | $5,551.87 |
| 20 | $4,408.74 | $5,625.01 | $17,604.41 | $13,195.67 |
| 25 | $6,388.41 | $8,662.72 | $36,060.09 | $29,671.68 |
| 30 | $9,257.02 | $13,340.91 | $73,863.88 | $64,606.86 |
(Source: DK Research Terminal, FactSet)
These Ultra SWANs could turn even a modest investment into a small fortune in the coming decades.
| Time Frame (Years) | Ratio Aristocrats/S&P | Ratio Inflation-Adjusted 401(k) Ultra SWAN Consensus Vs. S&P 500 |
| 5 | 1.06 | 1.41 |
| 10 | 1.13 | 2.00 |
| 15 | 1.20 | 2.82 |
| 20 | 1.28 | 3.99 |
| 25 | 1.36 | 5.64 |
| 30 | 1.44 | 7.98 |
(Source: DK Research Terminal, FactSet)
As well as potentially running circles around the S&P 500, aristocrats, and Nasdaq.
What evidence do we have that these Ultra SWANs can deliver anything close to 17% to 18% long-term returns?
Historical Returns Since 2009 (Annual Rebalancing)
The future doesn’t repeat, but it often rhymes. – Mark Twain
Past performance is no guarantee of future results, but studies show that blue-chips with relatively stable fundamentals over time offer predictable returns based on yield, growth, and valuation mean reversion.
Bank of America So let’s take a look at how these high-yield Ultra SWANs have performed over the last 12 years when 90% of total returns were the result of fundamentals, not luck. (Source: Portfolio Visualizer)
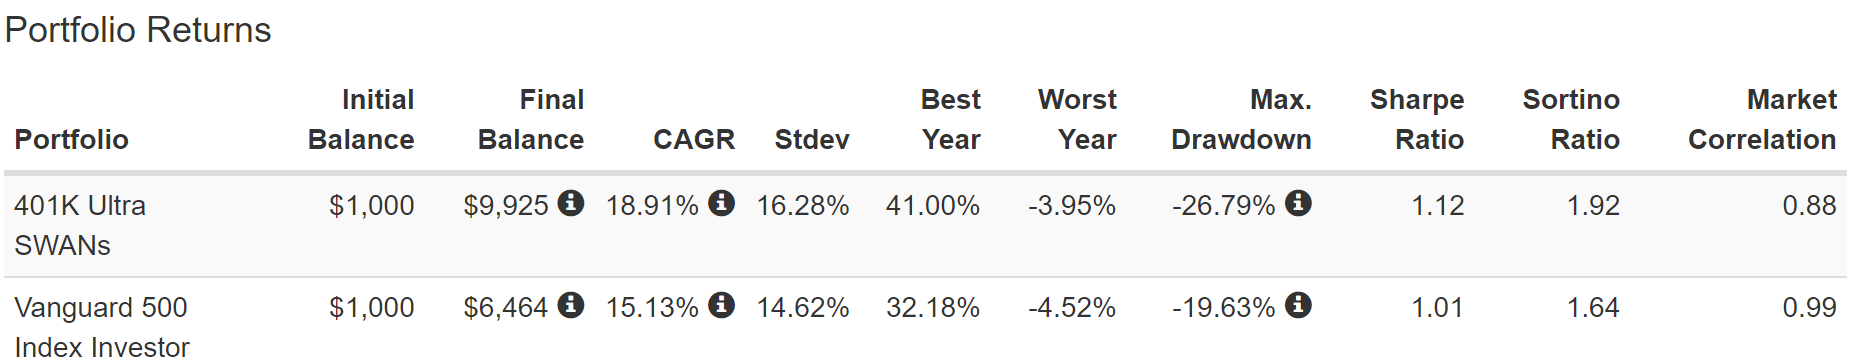
Since 2009 the S&P has been flying high on the back of one of the hottest tech rallies in history, while half of these Ultra SWANs have been in multi-year bear markets.
And yet these Ultra SWANs still delivered 19% annual returns, beating the S&P 500 by 4% per year.
- 19% annual returns vs. 17.6% analysts expect in the future
(Source: Portfolio Visualizer)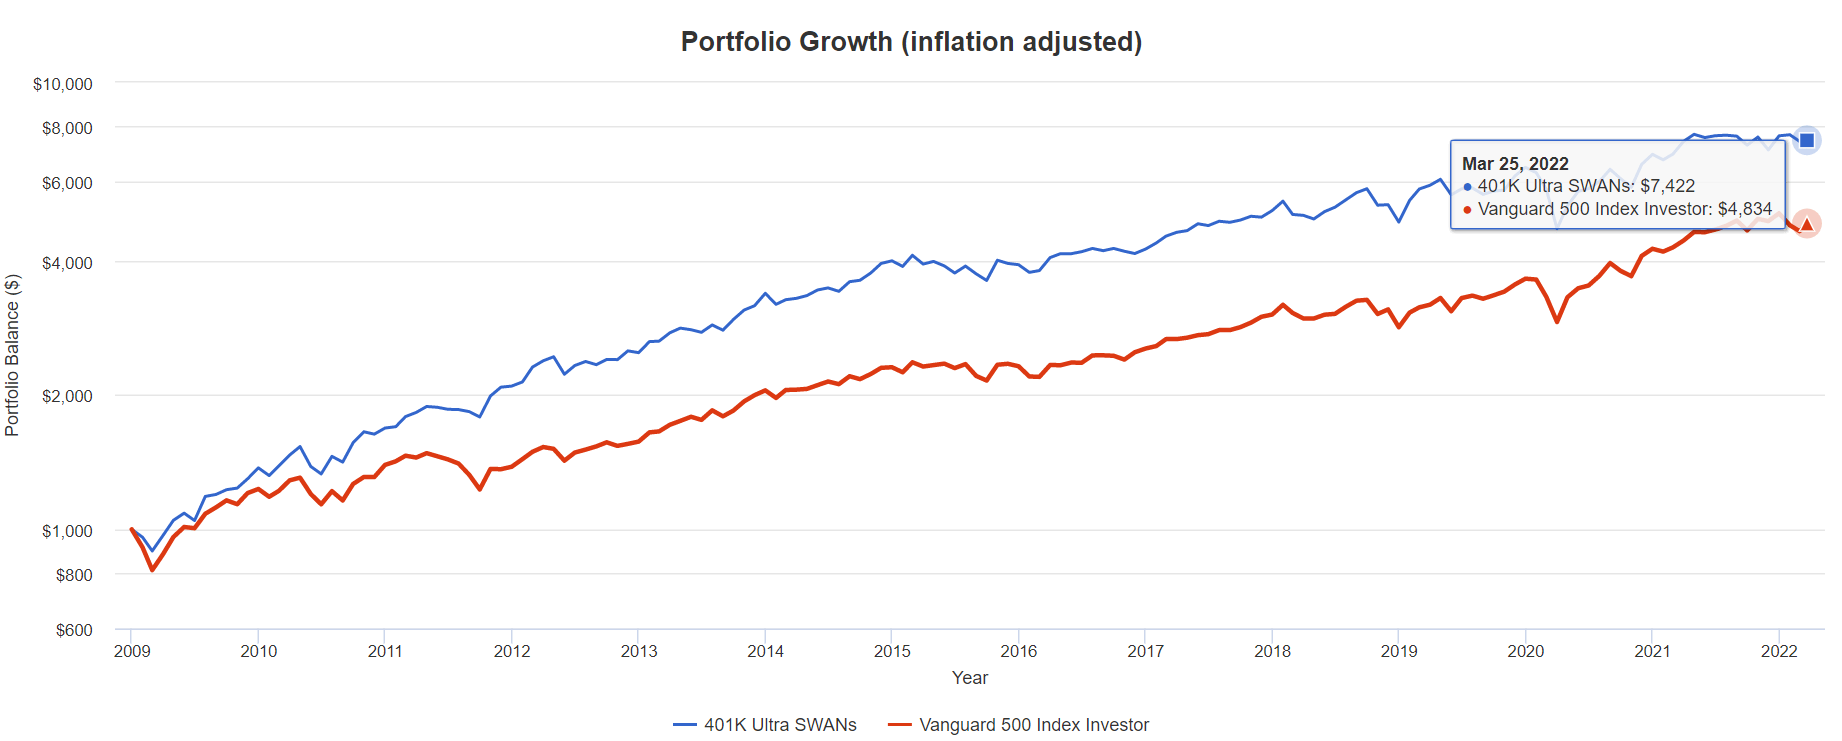
That means 54% better inflation-adjusted returns, (7.4X return), AND these Ultra SWANs are still 16% undervalued!
- 24% upside to fair value in just the next year
- which analysts expect them to deliver
(Source: Portfolio Visualizer)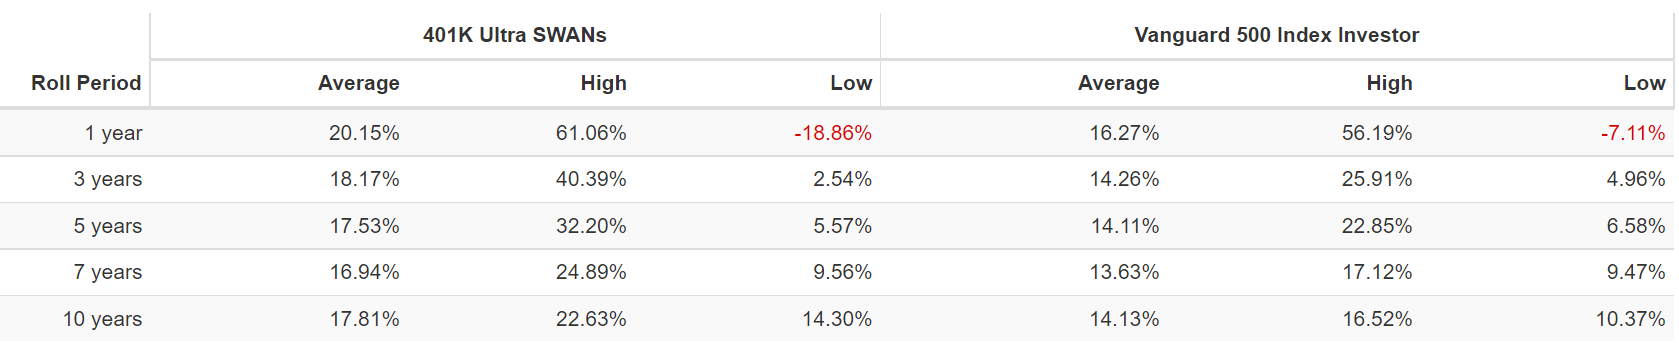
Across every average rolling time frame these Ultra SWANs delivered far superior returns than the broader market.
And take a look at their income growth!
| Portfolio | 2009 Income Per $1,000 Investment | 2021 Income Per $1,000 Investment | Annual Income Growth | Starting Yield | 2021 Yield On Cost |
| 401(k) Ultra SWANs | $45 | $401 | 19.99% | 4.5% | 40.1% |
(Source: Portfolio Visualizer)
These Ultra SWANs, thanks to dividend reinvestment and annual rebalancing, delivered 20% annual income growth, turning a 4.5% starting yield into a 40% yield on cost in 12 years.
| Analyst Consensus Income Growth Forecast | Risk-Adjusted Expected Income Growth | Risk And Tax-Adjusted Expected Income Growth |
Risk, Inflation, And Tax Adjusted Income Growth Consensus |
| 18.6% | 13.0% | 11.1% | 8.9% |
(Source: DK Research Terminal, FactSet)
In the future analysts expect similar income growth, which adjusted for the risk of companies now growing as expected, inflation, and taxes are about 9% expected income growth.
- S&P 500’s historical inflation- and tax-adjusted income growth rate is 3%
- these Ultra SWANs can potentially triple the income growth rate of the S&P 500
- FactSet consensus for a 60/40’s inflation and tax-adjusted income growth rate is 0.5%
- These high-yield aristocrats have 18x the real income growth potential of a 60/40 portfolio
Bottom Line: These 8 Rich Retirement Dream Stocks Can Help You Retire In Safety And Splendor
When investing for your future you can’t obsess over the Fed, the war, or even a potential recession in 2024.
And when you trust the world’s highest quality companies with your hard-earned savings, and own a diversified and prudently risk-managed portfolio you don’t have to.
- 3.9% very safe yield
- higher quality than the dividend aristocrats
- 16% undervalued vs. S&P 500’s 19% premium
- 13.7% long-term growth potential
- 17.6% long-term return potential vs. 18.9% CAGR returns since 2009
- 20% annual income growth vs. 19% consensus income growth over in the future (9% actually likely)
In fact, with just two low-cost index funds you can turn these Ultra SWANs into the Ultimate Sleep Well At Night Retirement Portfolio that can potentially help the typical retired couple
- generate an extra $2.2 million in inflation-adjusted retirement income over 30 years compared to a 60/40 retirement portfolio
- deliver $11.0 million more inflation-adjusted wealth over 30 years
- turn $555,000 in median retirement savings into $13.5 million inflation-adjusted wealth after 30 years
This is how you practice disciplined financial science, focusing on safety and quality first, and prudent valuation and sound risk-management always.
This is how you master the math for getting and staying rich on Wall Street.
This is how you stop gambling in the casino that is the stock market and build a bunker sleep well at night recession-resistant retirement portfolio that turns you into the house that always wins.
Today ENB, EPD, PM, MO, MA, ADSK, LOW, and VFC, represent the kind of Ultra SWANs that aren’t just potentially strong buys, they are potential rich retirement dream stocks.
And this is how, no matter what happens with the economy, interest rates, the war, inflation, or the stock market in the coming years and decades, you can retire in safety and splendor.
Be the first to comment