

There are many approaches and tools that can be applied to trading Forex or any other financial markets. They can mainly be divided into technical and fundamental. When it comes to technical analysis there is price action, indicator-based, chart pattern recognition, Elliott wave theory, Wyckoff, and more.
With each talented analyst making chart observations, a new approach is born. This is also the case with Harmonics. They were first introduced in 1930 by H.M. Gartley in his book “Profits in the Stock Market” which is why the first pattern was named the Gartley pattern.
At first, Fibonacciratios weren’t applied to pattern recognition but other market analysts later built upon this. Namely, it was Larry Pesavento who introduced Fib levels to define and distinguish patterns, and finally, Scott M. Carney defined all the variations according to those rules and ratios.
The best known are Gartley, Crab, Butterfly, and Bat variations, distinguished by their shape and corresponding Fibonacci ratios. You can use a harmonic bat pattern for stocks, Forex, cryptos*, and even commodities. You can try these instruments at FXOpen.
What Is the Harmonic Bat Pattern?
The harmonic bat pattern is one variation of the harmonic patterns. It was first discovered by Scott M. Carney in 2001, and according to Carney, it is the most accurate of them all.
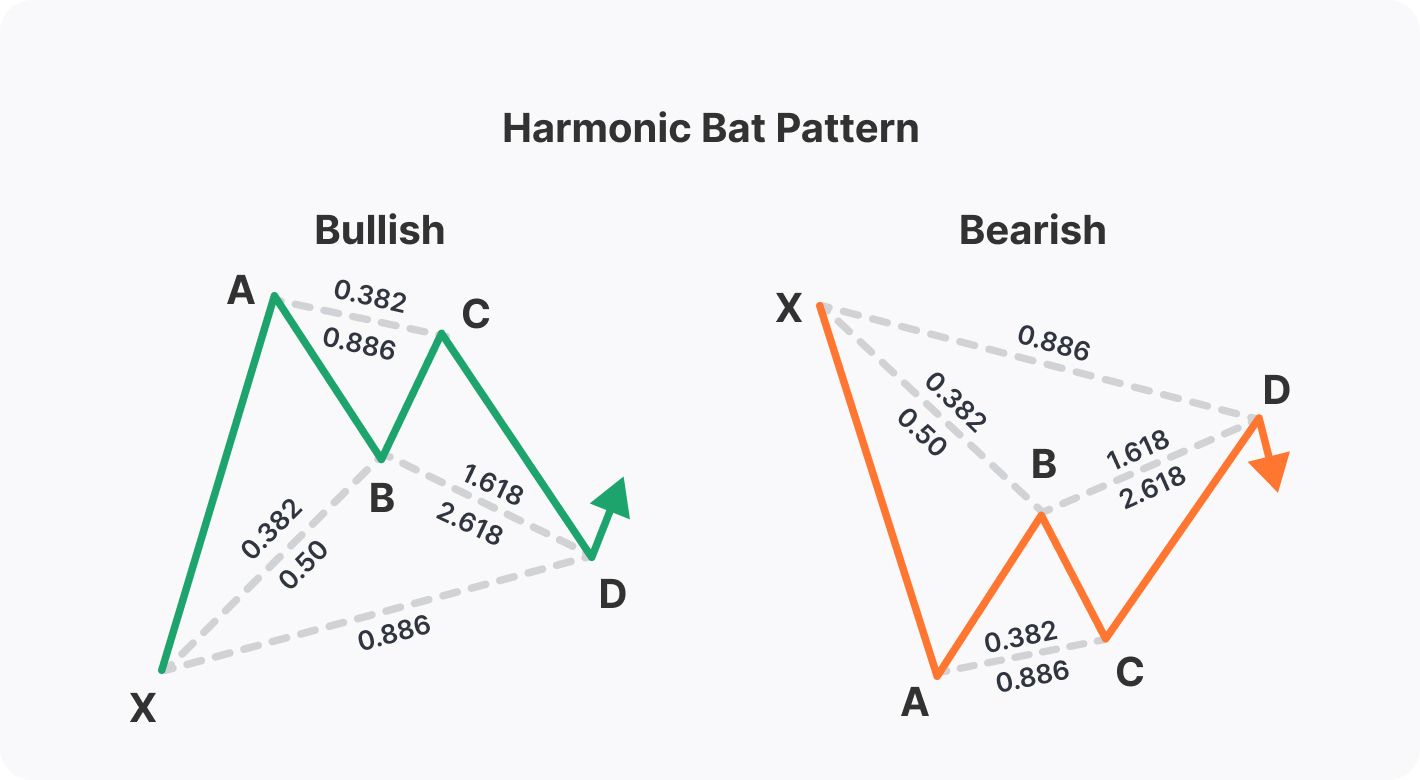
Like the rest, it is a chartpattern used to spot reversals and is labelled with five points of the price swings X, A, B, C, and D with the D point being more of a zone than a point.
The pattern’s use case is to outline a Potential Reversal Zone (PRZ) and it typically plays out as a deep retest of the previous support or resistance and continues with the price advancing in the direction of the first impulse wave labelled with its starting point X to A.
Considering the market structurewe have a bearish bat pattern and a bullish bat pattern. The key distinguishing factor between other harmonic patterns is the bat-like shape, with the left and right triangles looking like bat wings, and its Fibonacci retracement levels. While trading forex, a bat pattern can be found in any time frame, but the higher the time frame, the more reliable it can be.
Bat pattern rules are:
- XA: it is the first leg drawn from the first swing’s low to the second swing’s high and vice versa.
- B: 0.382 or 0.50 Fibonacci retracement of the XA length.
- C: it is usually 0.618 retracement of the AB length but no more than 1, otherwise the pattern is invalid.
- D: the target at 0.886 Fib retracement of the XA length.
How to Identify the Bat Harmonic Pattern
Now, in order to fully get a grasp of the pattern, we are going to apply the bat pattern rules to live charts using our trading platform TickTraderto see if we can identify the harmonic bat pattern.
The price of Bitcoin has increased by 8.86% from December 12th to December 16th. Let’s examine whether there was any chance we could have foreseen this rise using harmonic bat patternrecognition.
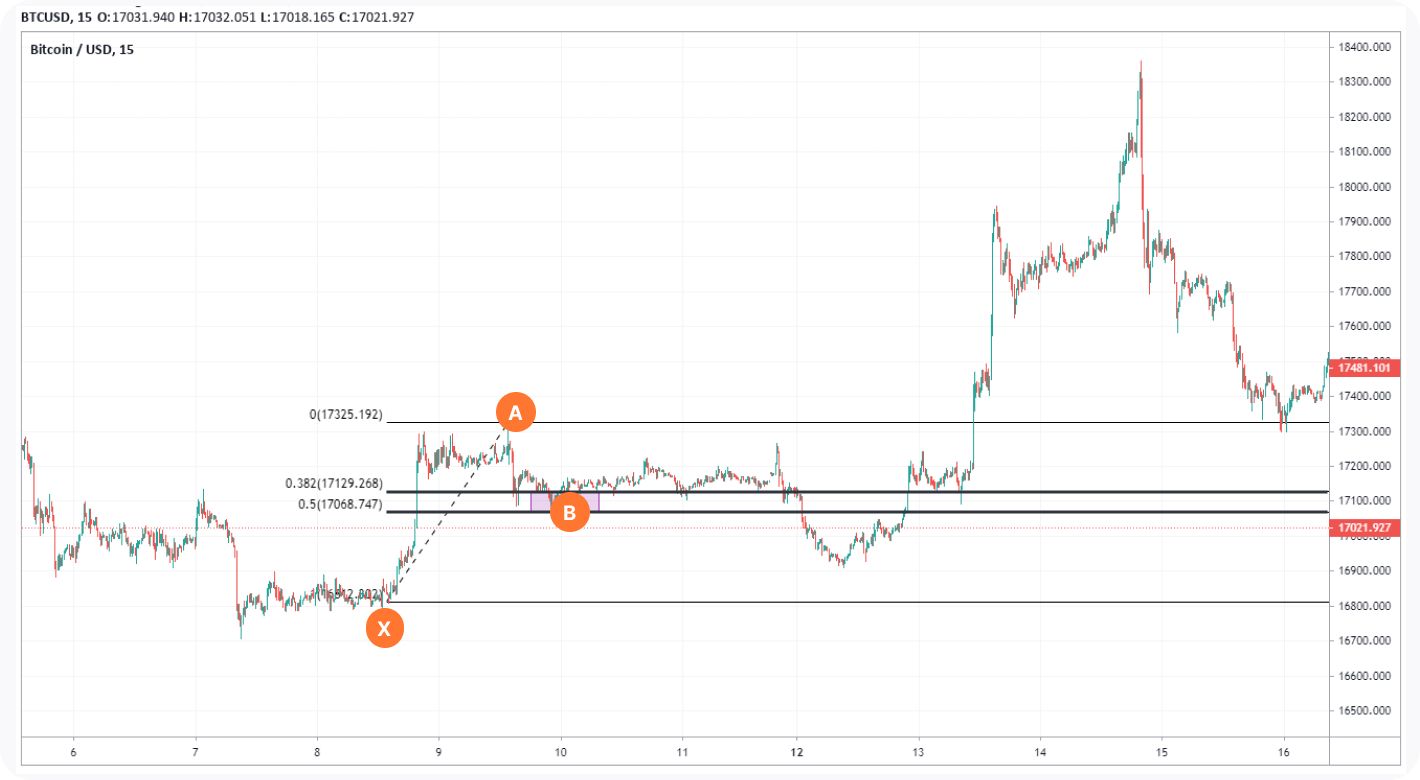
First, we are going to label the prior swing low with X and draw a line to the swing high, which we are labelling A. Next, let’s validate the B wave using Fibonacci retracementdrawn from X to A. As you can see, the B wave comes just at the 0.382 Fibonacci retracement level. So far, so good.
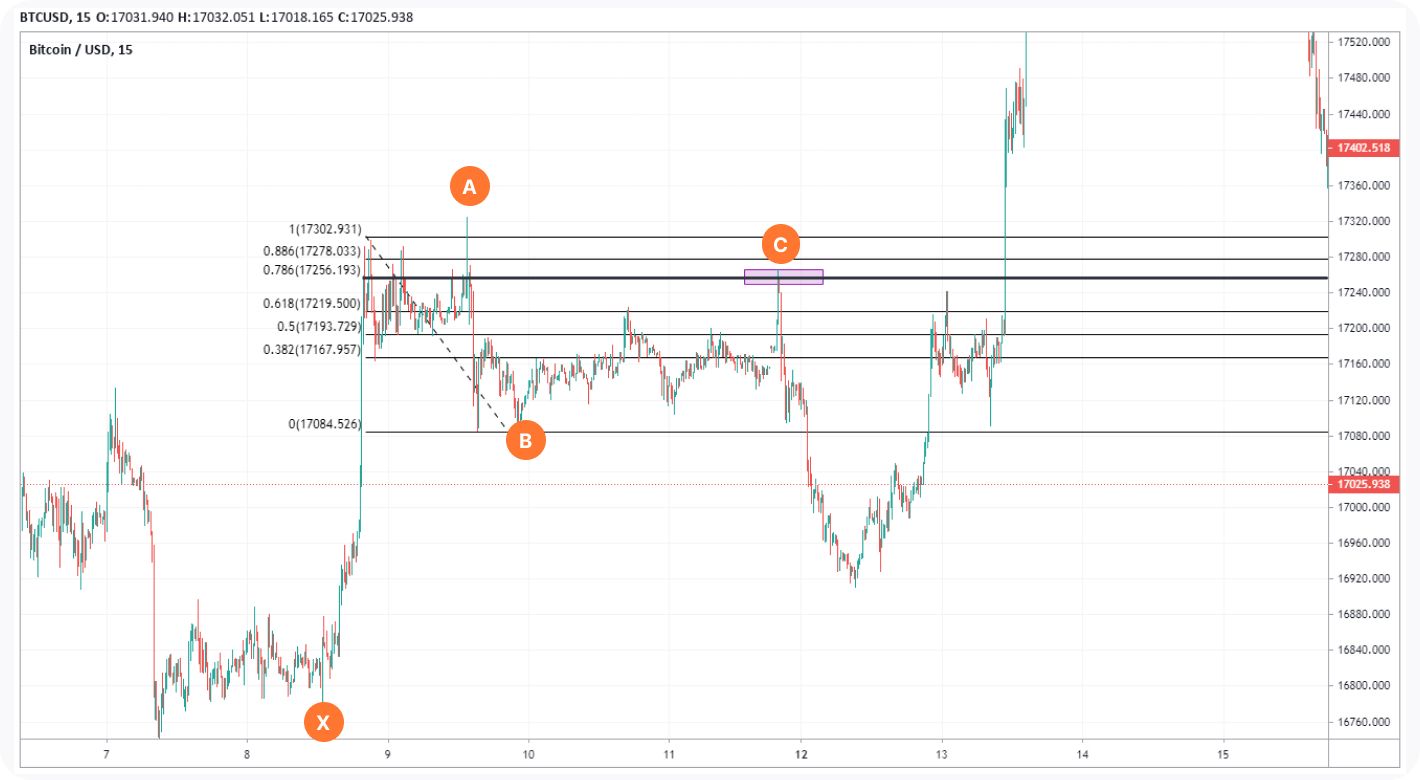
Now let’s establish the C wave by drawing another Fibonacci retracement from point A to pointB. The next lower high comes to 0.786, which confirms the C point because this is the ideal zone for the C wave to end.
Lastly, we are going to measure the target for the D point or Potential Reversal Zone. In this case, we already have another swing low so we are just going to examine its length compared to the length of XA with the Fib retracement tool.

The PRZ is from 0.786 to 0.886, which is where the price found support and surged. This validated the bullish bat pattern and we have added the right and left bat wings to confirm our analysis.
How to Trade the Harmonic Bat Pattern
Using the same example, let’s see how we can trade the harmonic bat pattern and outline a position in accordance with our analysis. Bat pattern trading is always done by opening a position in the Potential Reversal Zone.

It is important to be mindful of the horizontal support or resistance the zone correlates with, as this confluence points out the highest probability reversal level. In the case of Bitcoin, the price interacted with the 0.786 Fib retracement (D), which was on the horizontal support at $16,923.
You could look to set up a buy limit order or multiple ones in that area which would be your entry in this example. The stop loss could be set below the 0.886 Fib retracement or, in this case, $16,872.
Now that the entry and risk levels have been set, we will measure the risk/reward ratio to see if this is a position favourable for entry.
Using the Fibonacciextension first drawn from X to A and then to the D point, we could place the first target at $17,183 at the 0.618 Fib level. That comes far above the 1:3 minimum of a favourable risk/reward, thus making this position viable.
However, considering that the harmonic bat pattern is a reversal pattern, usually, the price makes a higher high in a bullish pattern, or a lower low in a bearish one, compared to its first swing high point A. This is why the theory suggests traders divide a trade into three positions and close them when the price targets are met to ensure the maximum trade potential.
The next significant Fib levels are 1 and 1.618, which is why our targets 2 and 3 are there. In the Bitcoin example, we can see that the price indeed found resistance at those levels which again validates their significance.
Create Your Strategy
The Bat pattern is an advanced pattern for traders that first and foremost understand the market structure, candlesticks, and Fibonacci levels. Without this foundation, it can be hard to apply it to trading.
However, this is a helpful reversalpattern that can offer a high risk/reward ratio, and incorporating it into your trading arsenal can make a great difference. This is why it is best to experiment with a free demo account to start applying bat pattern trading today.
*At FXOpen UK, Cryptocurrency CFDs are only available for trading by those clients categorised as Professional clients under FCA Rules. They are not available for trading by Retail clients.
Be the first to comment