

SolStock
The stock market is selling off again, thanks to still rising interest rates and a Fed that has pretty much said that their only focus is on beating inflation.
I just published an article exploring why stocks are likely to fall about 20% more before bottoming and why this shouldn’t matter to long-term income investors.
Bloomberg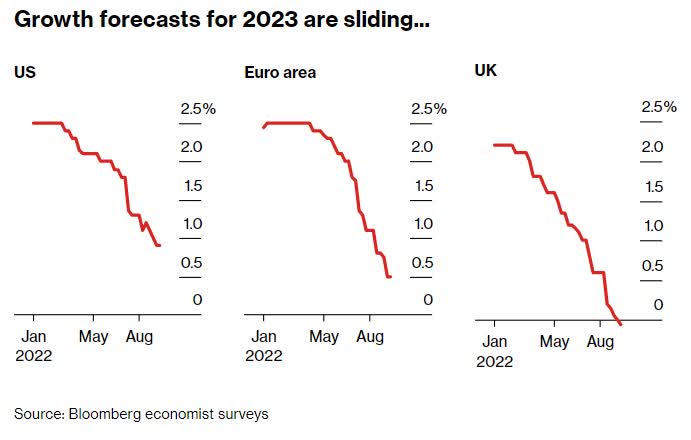
We’re likely headed for a global recession, which will likely mean short-term pain, but incredible long-term gains.
But as I explain in that article, unless you’re a creature of pure logic, it’s natural to fear a 20% further stock decline.
Daily Shot 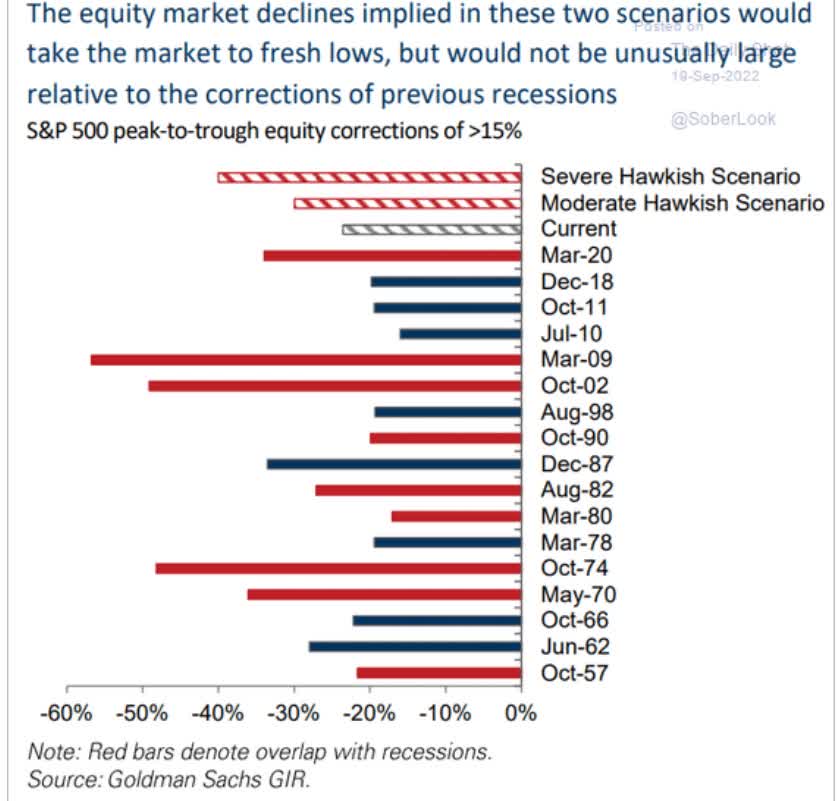
Especially given the trauma so many balanced portfolios (such as 60/40) investors have experienced so far in 2022.
- the worst year for bonds in history
Charlie Bilello
Through August alone, it was the worst year for a 60/40 since 1931, worse than the Tech crash and even the Great Recession.
After an investing lifetime in which the standard retirement portfolio never experienced a double-digit decline, asking the typical investor to ride out another 20% decline from here is asking more than many can stomach.
Fortunately, bonds aren’t likely to keep cratering along with stocks should the market decline another 20%.
And high-yield low volatility blue-chips, especially recession and inflation-resistant ones like healthcare and consumer staples, offer a great way to stay invested and profit from the incredible bull market that will almost certainly begin a lot sooner than most of us expect.
Today I wanted to expand on that article and provide you with X world-beater high-yield low volatility defensive blue-chips that you can safely buy today.
Companies with generous, very safe, and steadily rising dividends in all economic conditions. But also companies that are likely to deliver solid long-term returns. Returns that can, as part of a diversified and prudently risk-managed portfolio, help you sleep well at night during what’s likely coming next but still help you retire in safety and splendor in the decades ahead.
How To Find The Best High-Yield Low Volatility Blue-Chips For Today’s Market…In 1 Minute
Let me walk you through a very simple and quick screen using the Dividend Kings 500 Master List to show how easy it is to find the best low-volatility, defensive, high-yield world-beaters, you can trust today.
I’m using the Dividend Kings Zen Research Terminal, which I use to screen for almost all of my recommendations.
| Step | Screening Criteria | Companies Remaining | % Of Master List |
| 1 | Select “Low Volatility” DK Watchlist (20% or lower annual volatility) | 50 | 9.92% |
| 2 | Reasonable Buy, Good Buy, Strong Buy, Very Strong Buy, Ultra Value Buy (Never Overpay For Stocks) | 23 | 4.56% |
| 3 | Dividend Yield 3+% | 11 | 2.18% |
| 4 | 8+% Consensus LT Total Return Potential | 10 | 2.18% |
| 5 | 81+% dividend safety score (2% or lower severe recession cut risk) | 8 | 1.79% |
| Total Time | 1 Minute |
In 60 seconds, I found the eight high-yield ultra-low volatility blue-chips perfect for today’s bear market.
- for context, the average annual volatility for standalone companies is 28%
- for aristocrats, 24%
- the DK low volatility list is 20% or less average annual volatility over the last 15 years
- which includes the Great Recession, the Pandemic, and three other bear markets (including this one)
8 High-Yield Retirement Dream Blue-Chips For This Volatile Market
(Source: Dividend Kings Zen Research Terminal)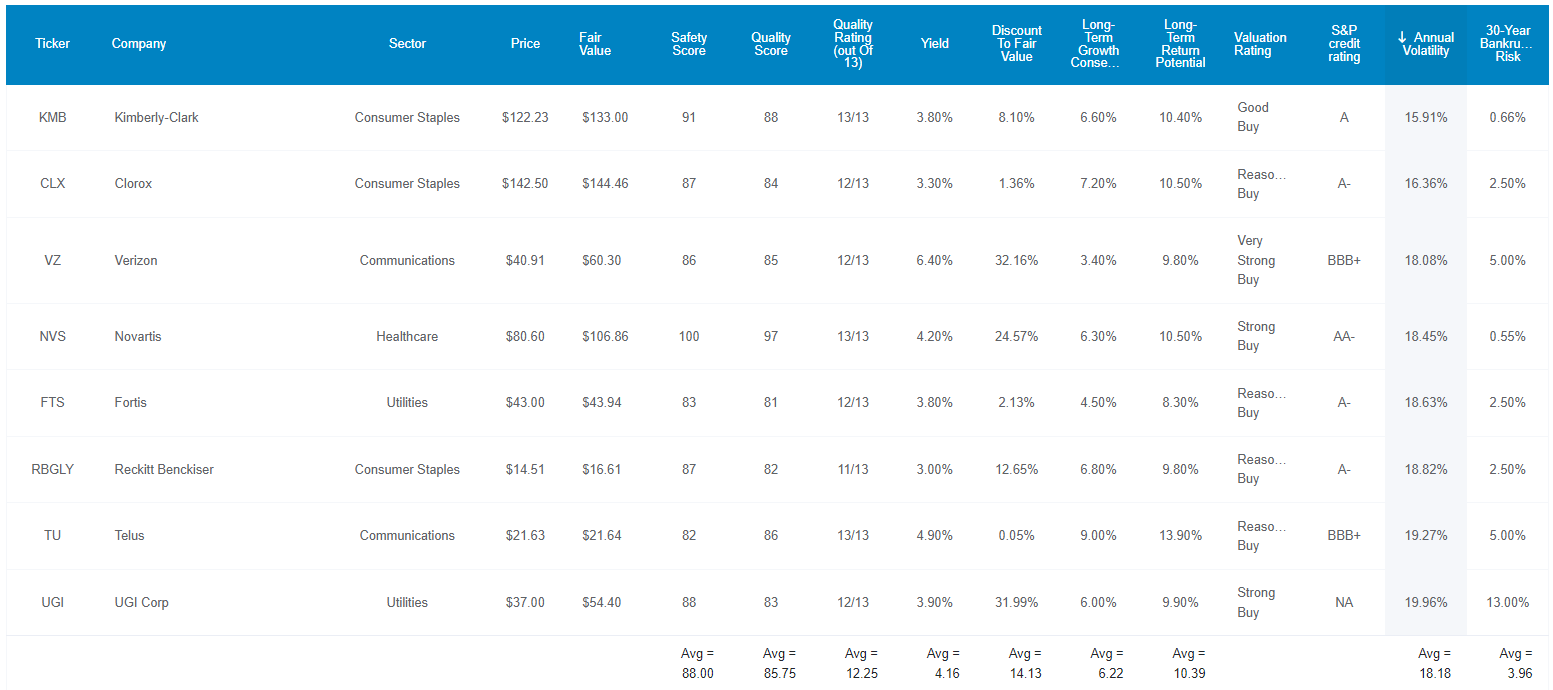
I’ve linked to articles exploring each company’s growth outlook, risk profile, valuation, and return potential.
Here they are in order of lowest to highest 15-year average annual volatility.
Tax Implications
- FTS and TU are Canadian companies
- 15% withholding in taxable accounts (NOT in retirement accounts)
- tax credit available in taxable accounts to recoup withholding
- own in retirement accounts to automatically avoid the withholding
Why You Can Trust These High-Yield Blue-Chips
(Source: Dividend Kings Zen Research Terminal)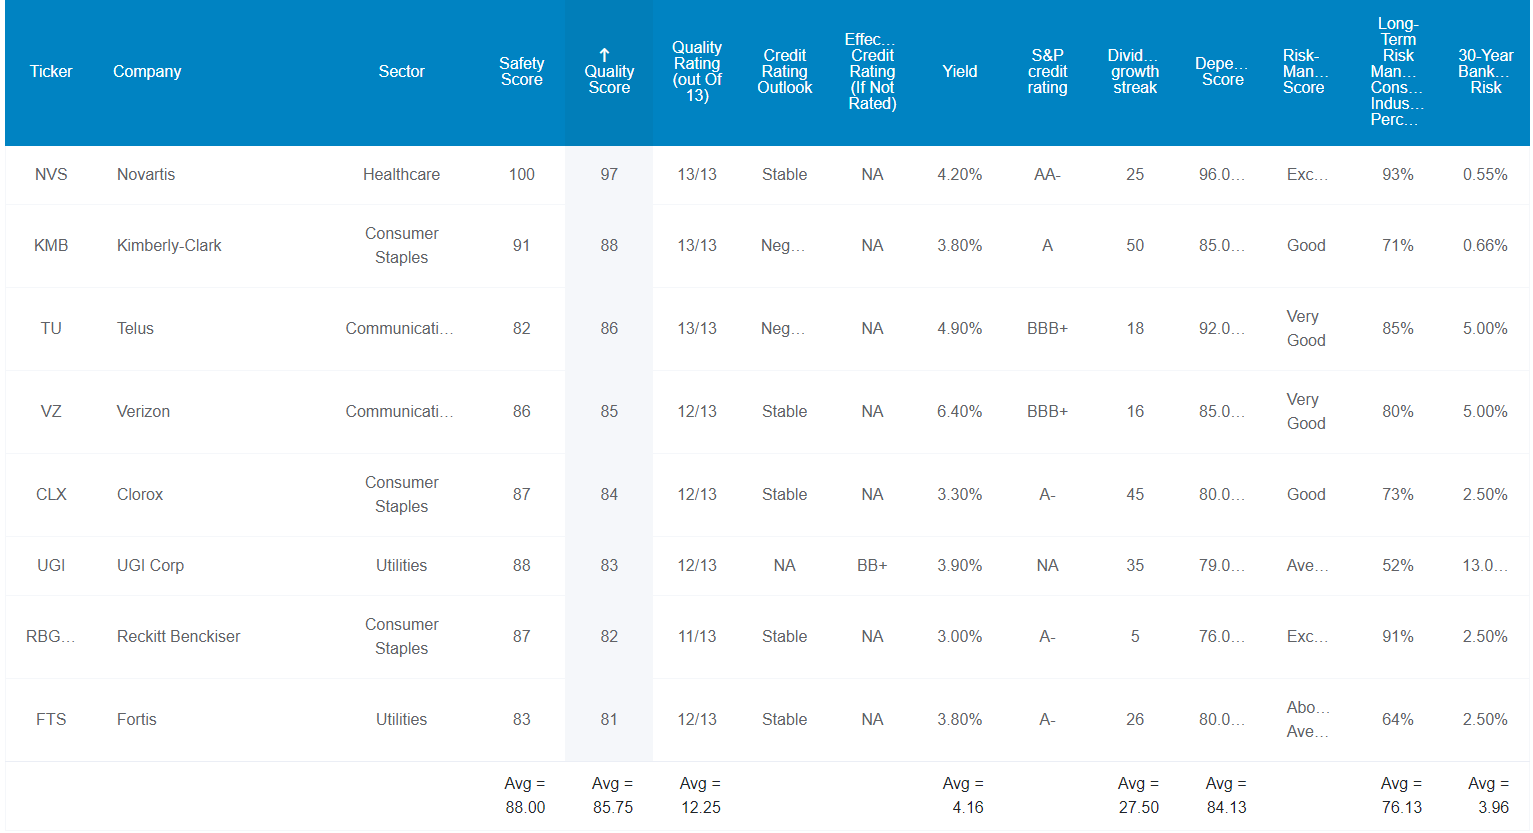
These aren’t just blue-chips they are super SWAN (sleep well at night) blue-chips with some of the safest and most dependable dividends on earth. How do we know? By comparing their quality to the bluest of blue-chips, the dividend aristocrats.
Similar Quality, Safety, And Dependability To The Dividend Aristocrats
| Metric | Dividend Aristocrats | 8 High-Yield Ultra Low Volatility Blue-Chips |
Compared To Aristocrats |
| Quality | 87% | 86% | 99% |
| Safety | 90% | 88% | 98% |
| Average Recession Dividend Cut Risk | 0.5% | 0.5% | 100% |
| Severe Recession Dividend Cut Risk | 1.5% | 1.6% | 109% |
| Dependability | 84% | 84% | 100% |
| Dividend Growth Streak (Years) | 44.8 | 27.5 | 61% |
| Long-Term Risk Management Industry Percentile | 67% | 76% | 113% |
| Average Credit Rating | A- Stable | BBB+ Stable | NA |
| Average Bankruptcy Risk | 3.04% | 3.96% | 130% |
| Average Return On Capital | 105% | 89% | 85% |
| Average ROC Industry Percentile | 83% | 77% | 93% |
| 13-Year Median ROC | 89% | 104% | 117% |
| Forward PE | 19.3 | 18.9 | 98% |
| Discount To Fair Value | 5% | 14% | 280% |
| DK Rating | Good Buy | Good Buy | NA |
| Yield | 2.6% | 4.2% | 161% |
| LT Growth Consensus | 8.6% | 6.2% | 72% |
| Total Return Potential | 11.2% | 10.4% | 93% |
| Risk-Adjusted Expected Return | 7.6% | 6.9% | 91% |
| Inflation & Risk-Adjusted Expected Return | 5.4% | 4.7% | 87% |
| Conservative Years To Double | 13.3 | 15.3 | 115% |
| Average | 111% |
(Source: Dividend Kings Zen Research Terminal)
These Super SWANs compare favorably with the dividend aristocrats with an average historical recession dividend cut risk of 0.5% and a severe recession cut risk of 1.6%.
Their average dividend growth streak is 28 years, making this an aristocrat portfolio.
S&P estimates their average 30-year bankruptcy risk is 4%, a BBB+ stable credit rating.
And according to Joel Greenblatt, one of the greatest investors in history, these are wide and stable moat aristocrats.
That’s due to their returns on capital, or ROC, Greenblatt’s gold standard proxy for quality and moatiness.
- ROC = annual pre-tax profit/the cost of running the company
- 14.6% for the S&P 500 in 2021
- 105% for the aristocrats over the last year
These wide-moat aristocrats have 89% ROC or 6X higher than the S&P 500.
That’s in the 77th percentile of their respective industries, and their 13-year median ROC is 104%.
According to six rating agencies, their average long-term risk management is in the 76th percentile, low-risk companies with good risk management.
- taking into account all company risks including stability of moats, supply chain management, balance sheets over time, labor relations, and even climate change strategies
These 8 Aristocrats’ Long-Term Risk Management Is The 95th Best In The Master List (81st Percentile)
| Classification | Average Consensus LT Risk-Management Industry Percentile |
Risk-Management Rating |
| S&P Global (SPGI) #1 Risk Management In The Master List | 94 | Exceptional |
| Strong ESG Stocks | 78 |
Good – Bordering On Very Good |
| 8 High Yield Low Volatility Blue-Chips | 76 | Good |
| Foreign Dividend Stocks | 75 | Good |
| Ultra SWANs | 71 | Good |
| Low Volatility Stocks | 68 | Above-Average |
| Dividend Aristocrats | 67 | Above-Average |
| Dividend Kings | 63 | Above-Average |
| Master List average | 62 | Above-Average |
| Hyper-Growth stocks | 61 | Above-Average |
| Monthly Dividend Stocks | 60 | Above-Average |
| Dividend Champions | 57 | Average bordering on above-average |
(Source: DK Research Terminal)
These aristocrats’ risk-management consensus is in the top 19% of the world’s highest quality companies and similar to that of such other blue-chips as
- Texas Instruments (TXN): Ultra SWAN
- Royal Bank of Canada (RY): Ultra SWAN
- Canadian National Railway (CNI): Ultra SWAN global aristocrat
- QUALCOMM (QCOM): Ultra SWAN
- Federal Realty Investment Trust (FRT): Ultra SWAN dividend king
The bottom line is that all companies have risks, and these low-volatility aristocrats are good at managing theirs.
How We Monitor Their Risk Profiles
- 175 analysts
- 4 credit rating agencies
- 8 total risk rating agencies
- 20 experts who collectively know this business better than anyone other than management
- and the bond market for real-time fundamental risk assessment
When the facts change, I change my mind. What do you do, sir?” – John Maynard Keynes
There are no sacred cows at iREIT or Dividend Kings. Wherever the fundamentals lead, we always follow. That’s the essence of disciplined financial science, the math behind retiring rich and staying rich in retirement.
So now that you see why these are some of the best low volatility high-yield blue-chips you can own, here’s why it might be worth buying some or all of them today.
Wonderful Companies At Reasonable Prices
It’s far better to buy a wonderful company at a fair price than a fair company at a wonderful price.” – Warren Buffett
Source: Dividend Kings Zen Research Terminal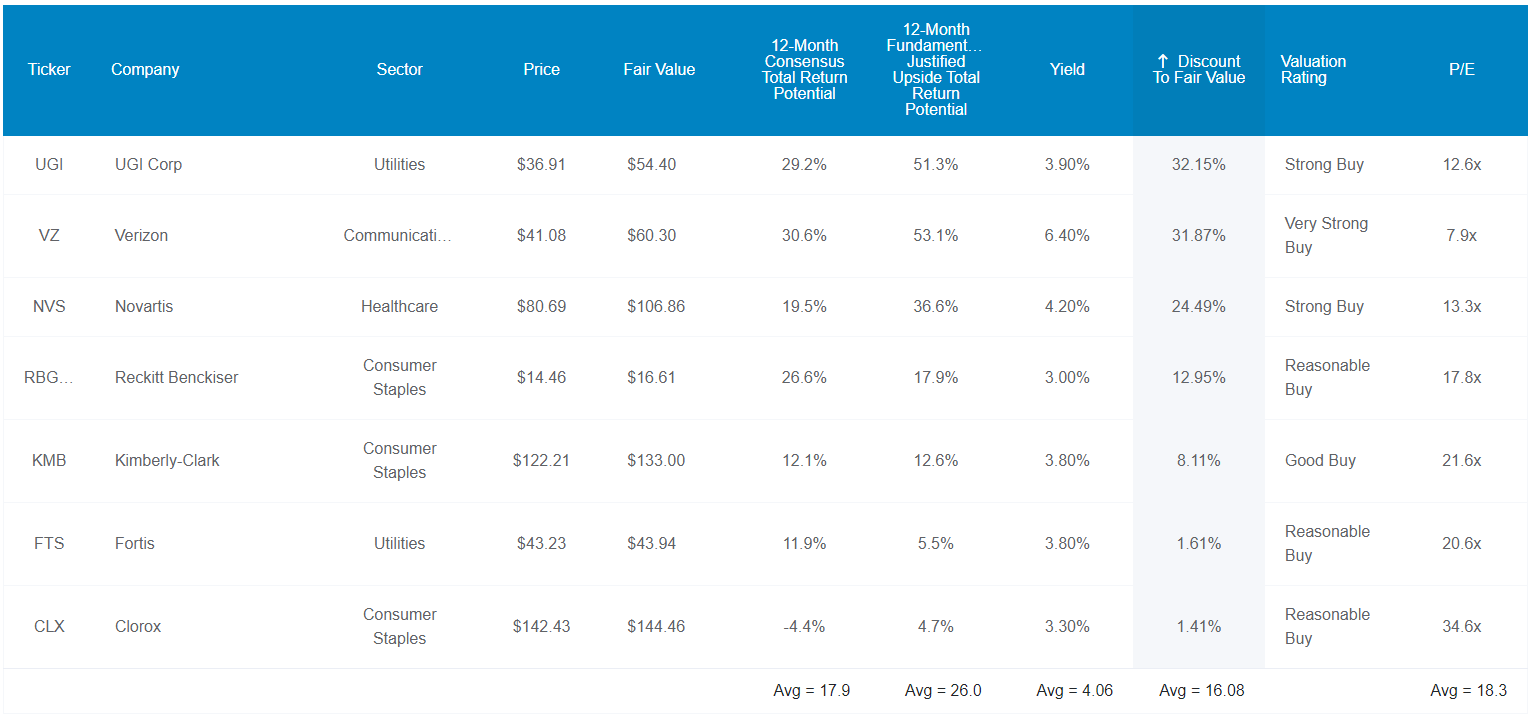
For context, the dividend aristocrats trade at about 20X earnings and the S&P 500 around 17, both close to historical fair value.
These low volatility defensive aristocrats historically trade at 21.8X earnings and today trade at a 16% historical discount of 18.3X.
Analysts expect them to deliver 18% total returns in the next year, but their 12-month fundamentally justified total return potential is 26%.
- If they all grow as expected and return to historical market-determined fair value, you will earn 26% in 12 months
But my goal isn’t to help you score a quick 18% or even 26% return in a year. My goal is to help you sleep well in this and all future bear markets while earning long-term returns that can help you retire in safety and splendor.
High-Yield, Ultra-Low Volatility, And Potentially Life-Changing Long-Term Returns
(Source: Dividend Kings Zen Research Terminal)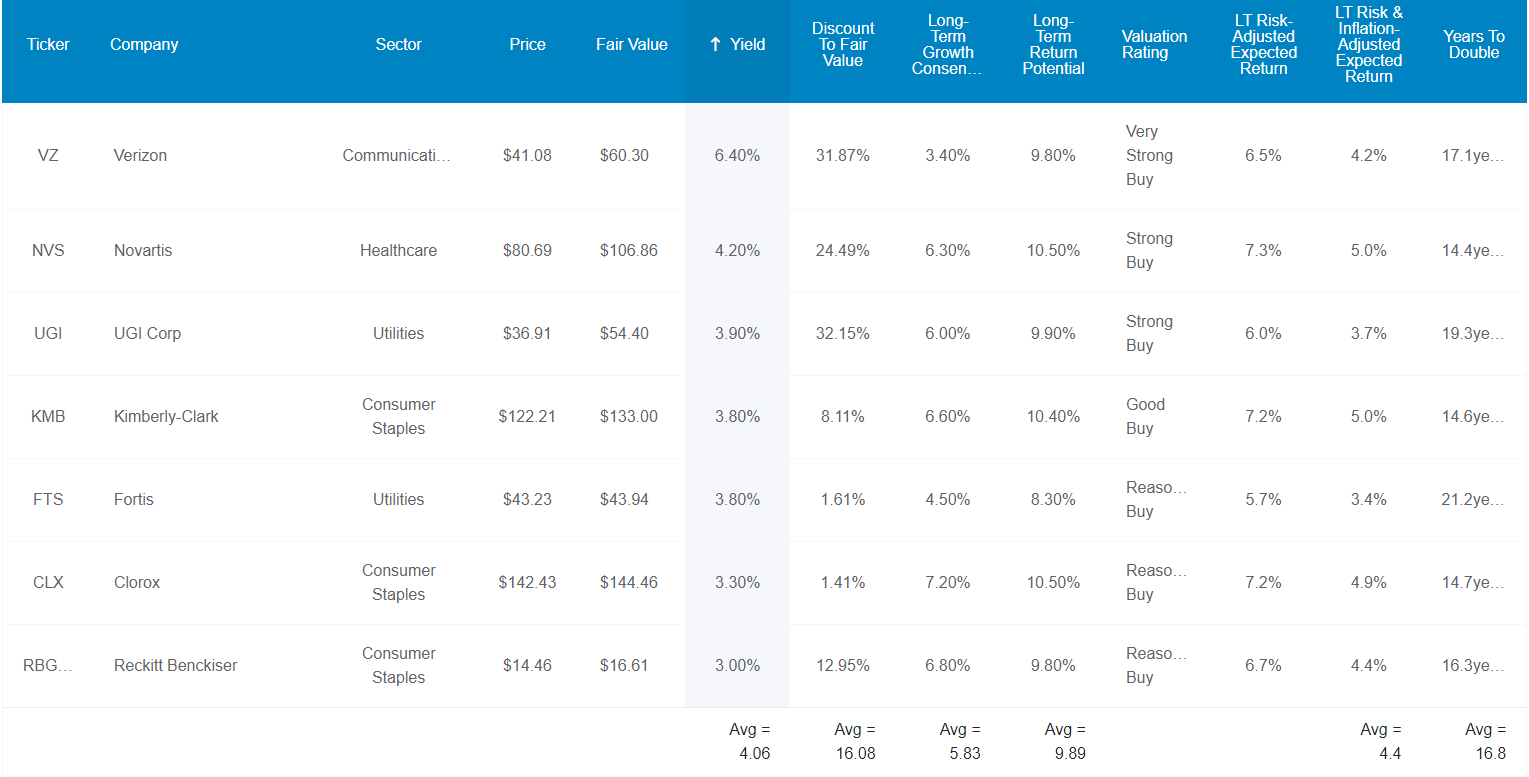
Not only do these high-yield low volatility Super SWANs offer one of the world’s safest 4.1% yields in one of the lowest volatility packages, but they are growing at a decent rate of almost 6% and offering almost double-digit long-term return potential.
- they should conservatively double your inflation-adjusted wealth every 17 years
- market-like return potential but with 2.5X the much safer yield
- and much lower volatility
What might that mean for you?
Inflation-Adjusted Consensus Total Return Potential: $1,000 Initial Investment
| Time Frame (Years) | 7.9% CAGR Inflation-Adjusted S&P 500 Consensus | 8.1% CAGR Inflation-Adjusted 8 High-Yield Ultra Low Volatility Blue-Chip Consensus | Difference Between Inflation-Adjusted 8 High-Yield Ultra Low Volatility Blue-Chip Consensus And S&P Consensus |
| 5 | $1,461.18 | $1,476.83 | $15.64 |
| 10 | $2,135.06 | $2,181.02 | $45.96 |
| 15 | $3,119.71 | $3,220.98 | $101.27 |
| 20 | $4,558.47 | $4,756.83 | $198.36 |
| 25 | $6,660.75 | $7,025.01 | $364.25 |
| 30 (retirement time frame) | $9,732.58 | $10,374.71 | $642.13 |
| 35 | $14,221.09 | $15,321.64 | $1,100.56 |
| 40 | $20,779.62 | $22,627.40 | $1,847.79 |
| 45 | $30,362.83 | $33,416.74 | $3,053.91 |
| 50 | $44,365.65 | $49,350.71 | $4,985.05 |
| 55 | $64,826.35 | $72,882.41 | $8,056.06 |
| 60 (investing lifetime) | $94,723.18 | $107,634.63 | $12,911.46 |
| 100 (institutional time frame) | $1,968,311.27 | $2,435,492.15 | $467,180.89 |
(Source: DK Research Terminal, FactSet)
Over 30 years, analysts think these low volatility high-yield aristocrats could deliver 10X inflation-adjusted returns. Over an investing lifetime, they are a potential 108X bagger.
| Time Frame (Years) | Ratio Inflation And Inflation-Adjusted KEYUF Management Guidance vs. S&P consensus |
| 5 | 1.01 |
| 10 | 1.02 |
| 15 | 1.03 |
| 20 | 1.04 |
| 25 | 1.05 |
| 30 | 1.07 |
| 35 | 1.08 |
| 40 | 1.09 |
| 45 | 1.10 |
| 50 | 1.11 |
| 55 | 1.12 |
| 60 | 1.14 |
| 100 | 1.24 |
(Source: DK Research Terminal, FactSet)
No, they aren’t likely to do much better than the market, but beating the S&P isn’t everyone’s goal.
The best way to measure your investing success is not by whether you’re beating the market but by whether you’ve put in place a financial plan and a behavioral discipline that are likely to get you where you want to go.” – Benjamin Graham
So let me show you the glory of achieving market-level long-term 10% returns but with incredibly low volatility.
Historical Returns Since December 1996 (Equal Weighting, Annual Rebalancing)
The future doesn’t repeat, but it often rhymes. – Mark Twain
In our case, “past performance is no guarantee of future results.”
Still, studies show that over time, blue chips with relatively stable fundamentals offer predictable returns based on yield, growth, and valuation mean reversion.
Bank of America 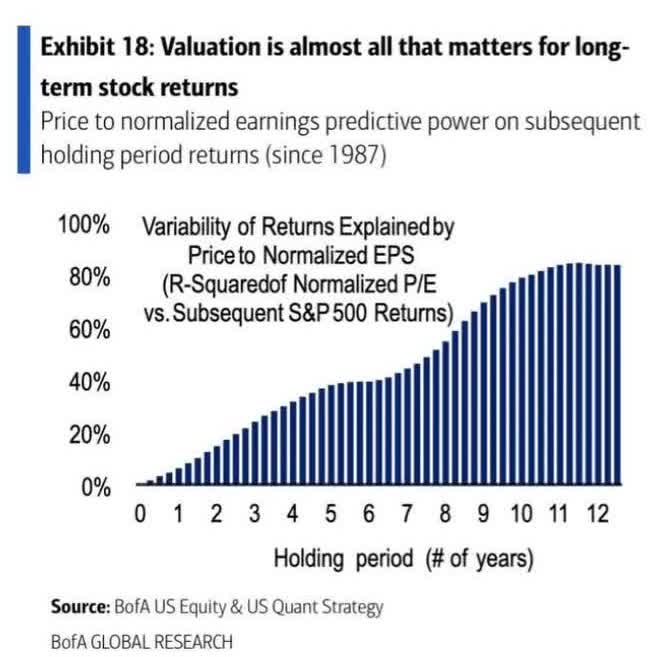
So let’s take at how these 8 high-yield low volatility aristocrats performed over the last 26 years when 91% of total returns resulted from fundamentals and not luck.
(Source: Portfolio Visualizer Premium)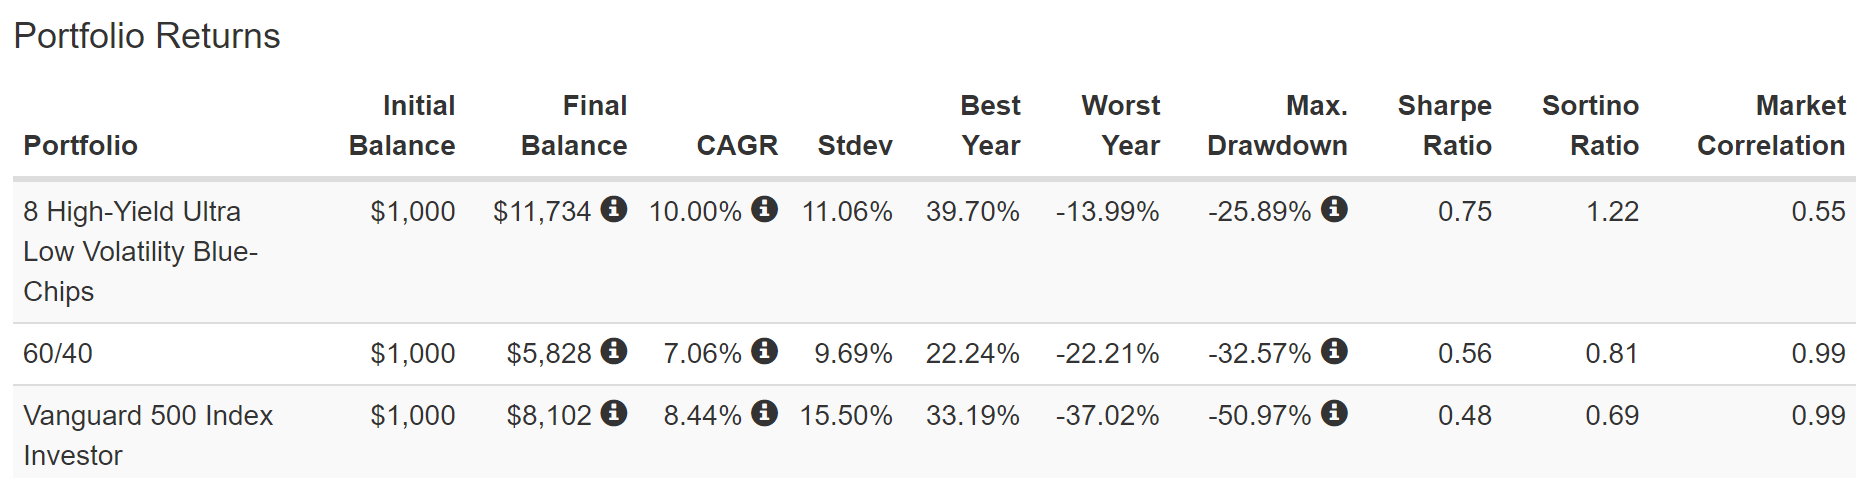
Analysts expect 10% long-term returns for decades to come from these mature wide moat aristocrats. Just as they’ve delivered for the last quarter century.
During this time, they actually beat the S&P 500 but with 30% less annual volatility (just 11% per year).
- their peak decline of 26% during the Great Recession was 7% less than a 60/40, but with zero bonds
- almost 2X higher negative-volatility adjusted total returns than the S&P 500 (Sortino ratio)
(Source: Portfolio Visualizer Premium)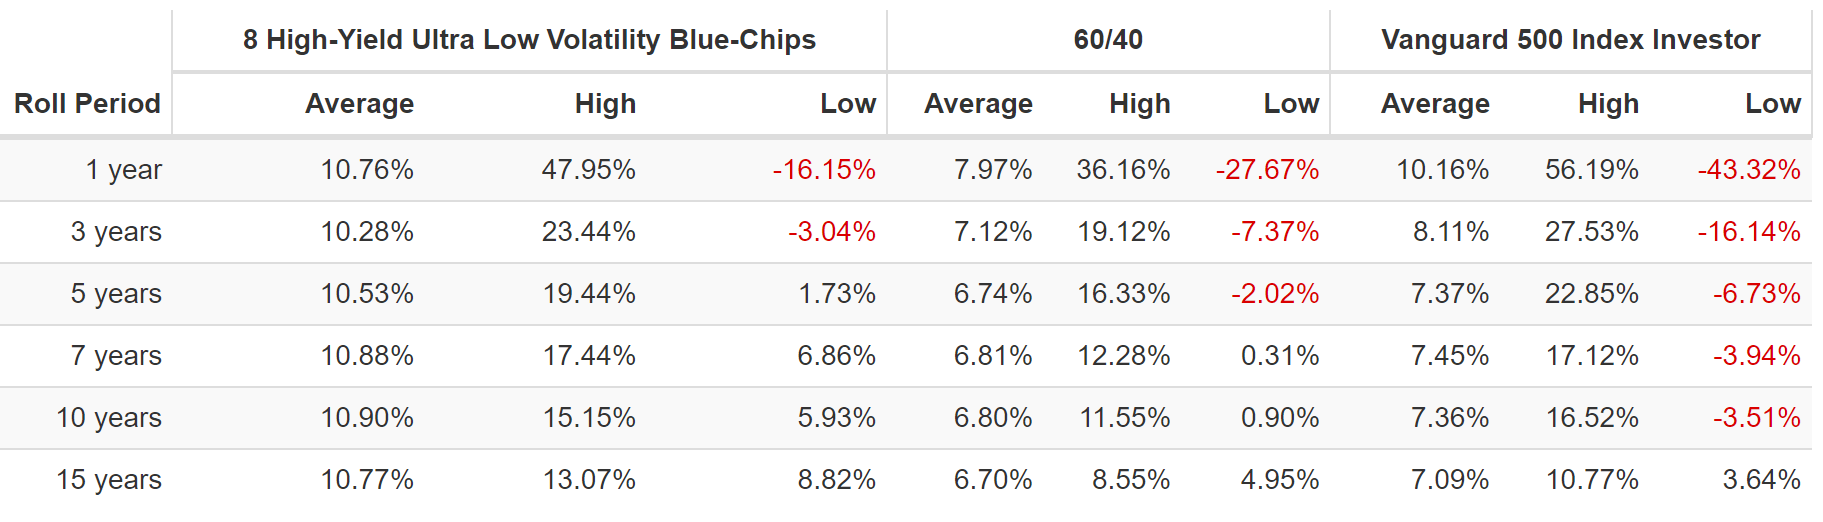
10% to 11% average rolling returns across every time frame. Great returns but with a much smoother ride.
- like driving over market potholes in a Cadillac
(Source: Portfolio Visualizer Premium)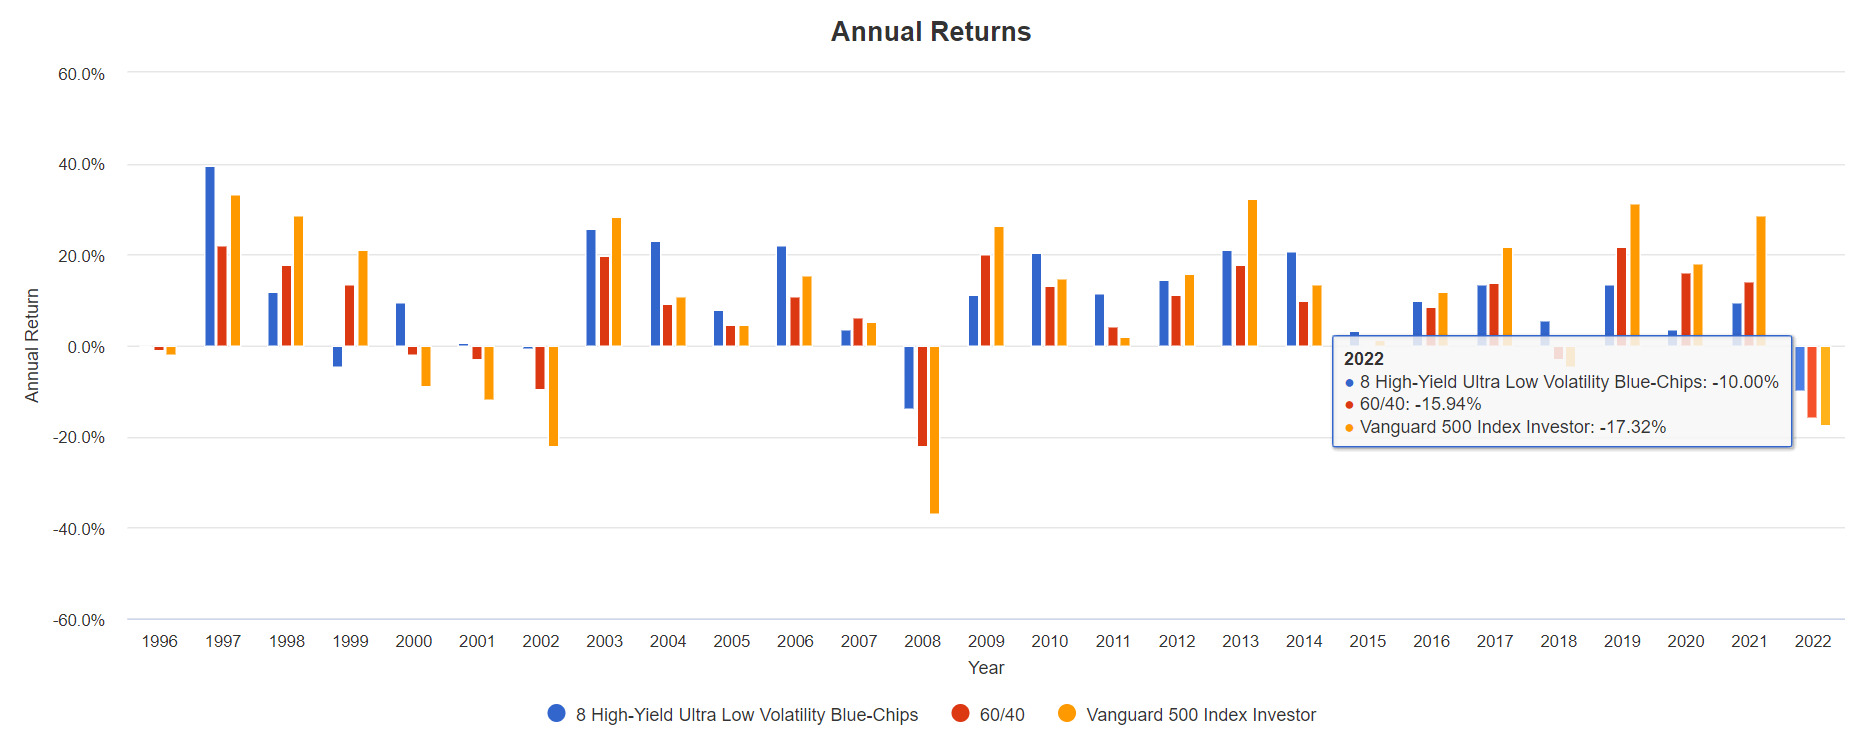
They are down just 10% in 2022 compared to a 60/40’s -16% and the market’s -17%.
(Source: Portfolio Visualizer Premium)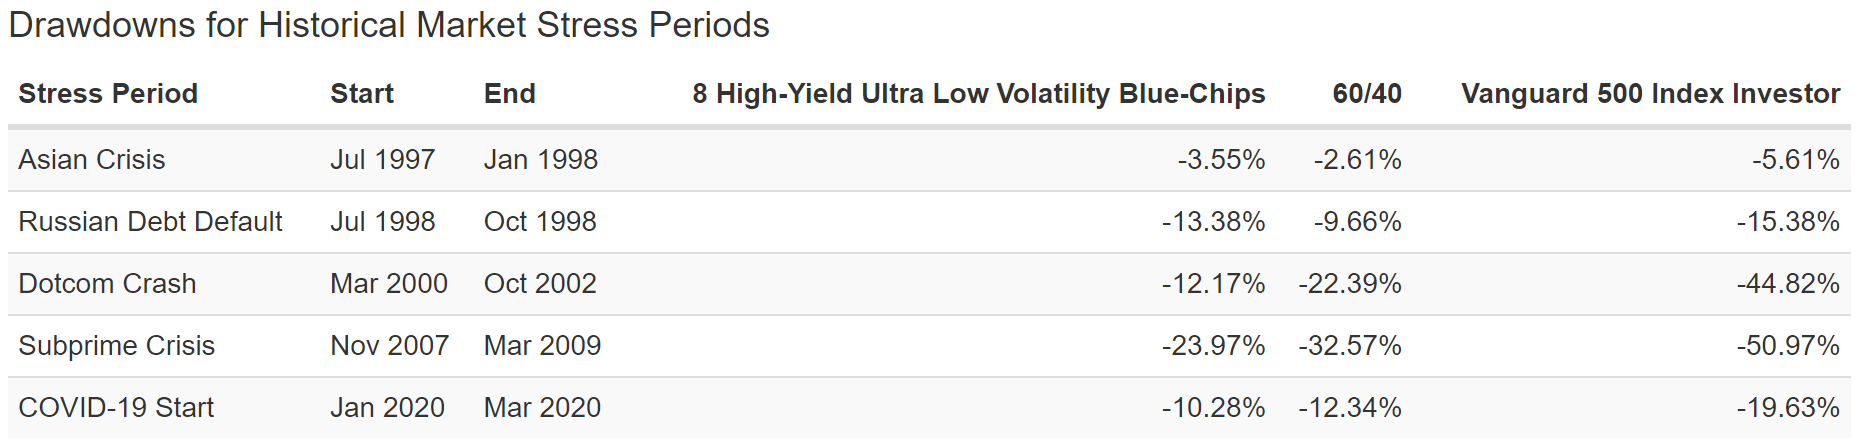
In every major market crisis, they fell significantly less than the market, and in the last three major bear markets, they fell less than a 60/40.
(Source: Portfolio Visualizer Premium)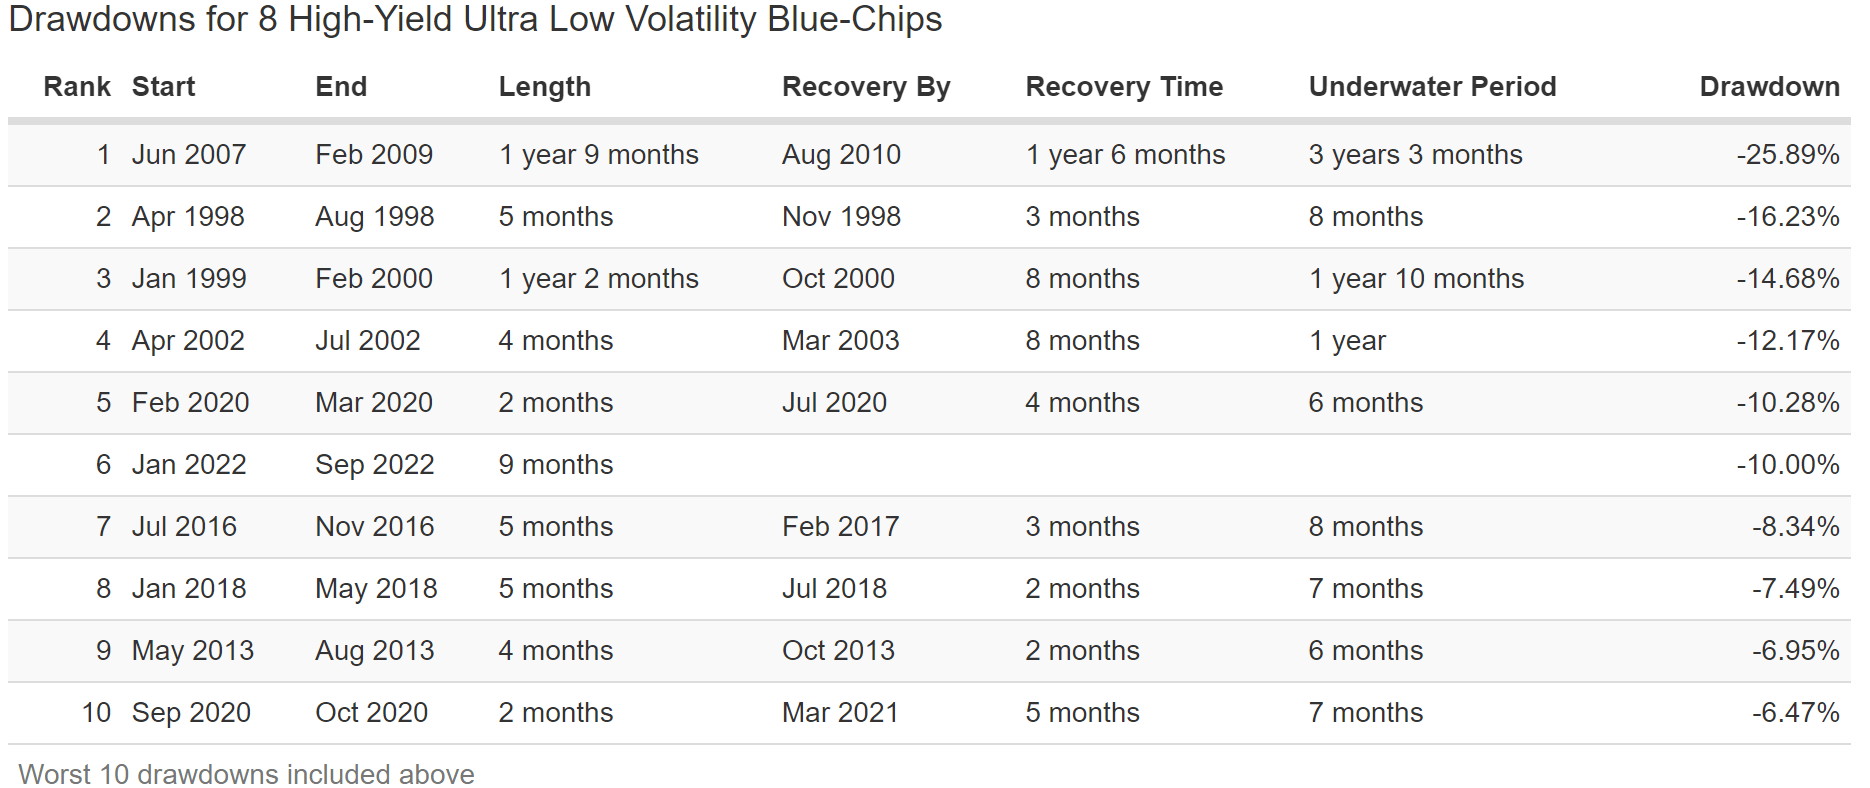
In this bear market, they are down half as much as the S&P 500 and 7% less than a 60/40.
In fact, over a quarter century, they have only experienced a bear market once, during the 2nd worst market crash in US history.
Income Growth You Can Depend On
Income Per $1,000 Initial Investment (Source: Portfolio Visualizer Premium)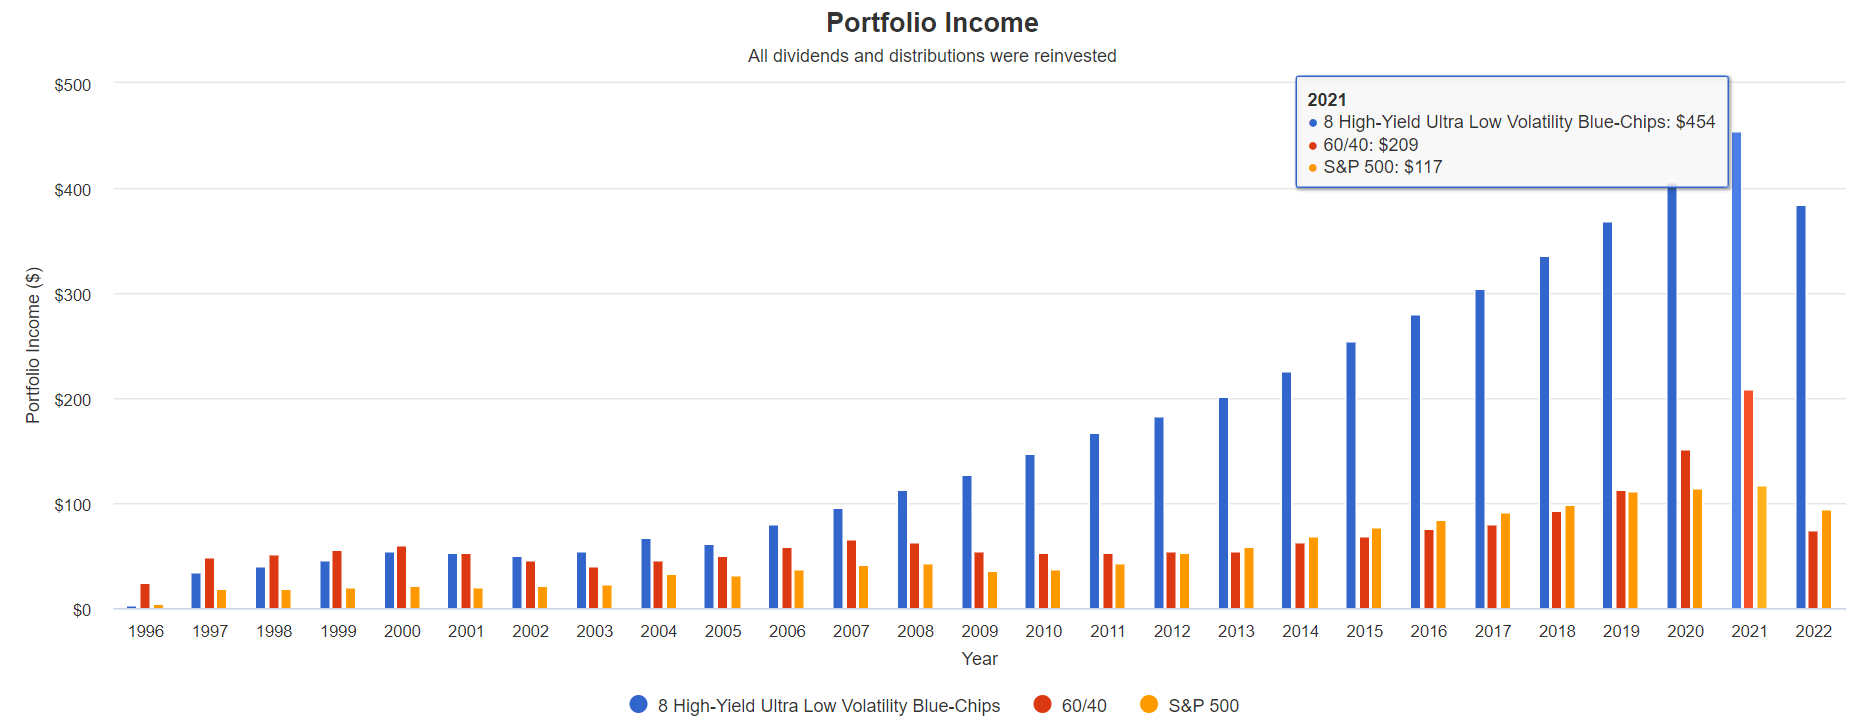
Just take a look at what a quarter century of dependable 10% annual dividend growth can do.
And now, behold the power of dividend reinvestment.
Cumulative Dividends Since 1997: $1,000 Initial Investment
| Metric | 60/40 | S&P 500 | 8 High-Yield Ultra Low Volatility Blue-Chips |
| Total Dividends | $1,861 | $1,444 | $4,713 |
| Total Inflation-Adjusted Dividends | $1,000.54 | $776.34 | $2,533.87 |
| Annualized Income Growth Rate | 3.2% | 8.8% | 12.4% |
| Total Income/Initial Investment % | 1.86 | 1.44 | 4.71 |
| Inflation-Adjusted Income/Initial Investment % | 1.00 | 0.78 | 2.53 |
| More Inflation-Adjusted Income Than S&P 500 | 1.29 | NA | 3.26 |
| Starting Yield | 4.9% | 1.8% | 3.5% |
| Today’s Annual Dividend Return On Your Starting Investment (Yield On Cost) | 10.0% | 12.5% | 51.3% |
| Today’s Inflation-Adjusted Annual Dividend Return On Your Starting Investment (Inflation-Adjusted Yield On Cost) | 5.4% | 6.7% | 27.6% |
(Source: Portfolio Visualizer Premium)
Slow growth high-yield aristocrats? Yes. But thanks to the magic of dividend compounding, they delivered 12.4% annual income growth over the last quarter century.
They delivered 2.5X your initial investment in inflation-adjusted dividends, 3.3X more than the S&P 500. And for anyone investing in 1997, the yield on cost is now approaching 30%.
Ok, these are some amazing companies. But what if even a 25% decline in the Great Recession is too much for you?
Cranking Up The Low Volatility To 11
In this article, I explain the importance of asset allocation and how combining blue-chip asset buckets can build the retirement portfolio of your dreams.
This article explains why the Dynamic Beta Managed Futures (DBMF) ETF is the Vanguard of hedge funds and my favorite way to hedge stagflation.
And here are three great 5-star rated managed futures alternatives to DBMF, for those who want active management and longer track records in their hedge funds.
So let me show you how to reduce volatility, even more, using the two best historical hedges, bonds, and managed futures.
Stocks Help Us Eat Well, Bonds Help Us Sleep Well
“Stocks help us eat well, bonds help us sleep well” is a popular adage on Wall Street, and it stems from William Benson’s seminal 1994 paper on the 60/40 portfolio, which created the modern 4% rule that’s the basis of retirement planning.
Fortune 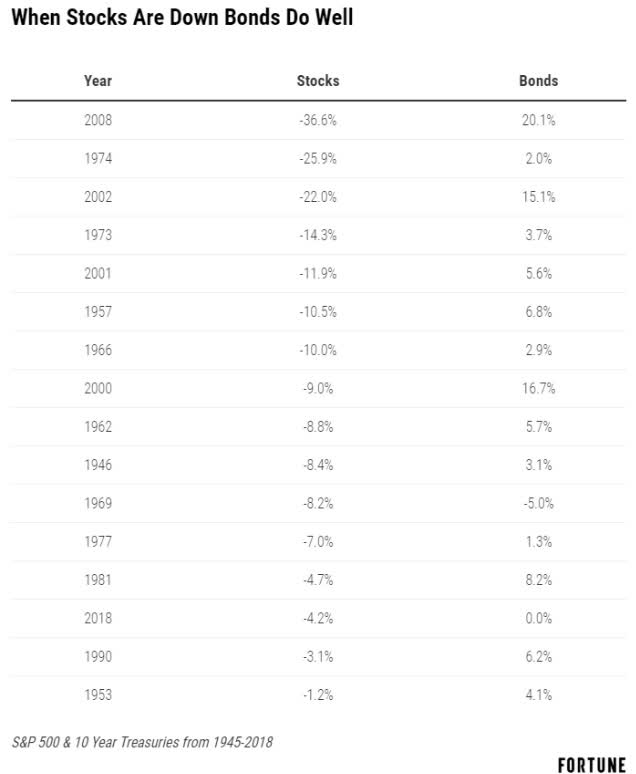
Since WWII, 92% of the time, stocks are falling bonds are stable or going up.
JPMorgan Asset Management 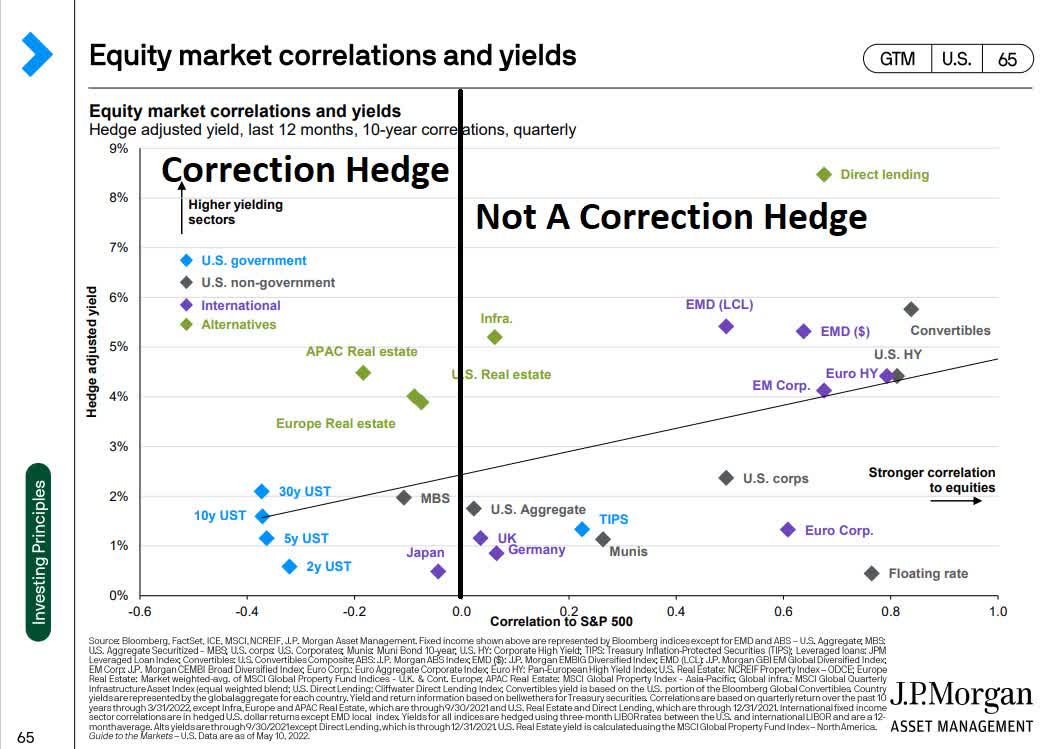
That’s because negatively correlated assets (vs. stocks) provide powerful hedging and diversification power for most bear markets and corrections.
But what makes bonds so wonderful (in the 82% of times, we’re not in stagflation) is that they tend to deliver positive real returns.
Duke University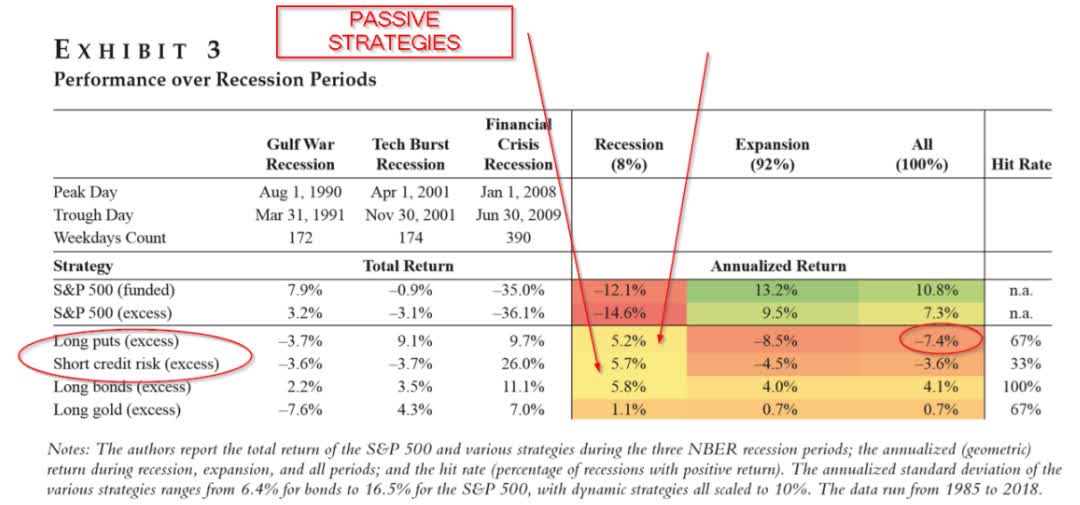
In fact, according to a study from Duke, long bonds are the best historical hedges, in most recessionary bear markets. They go up the most during downturns and deliver the best long-term positive returns, unlike options.
So let me show you what kind of low volatility magic we can achieve if we add a 33% allocation of long-duration US Treasuries (TLT) to this high-yield ultra-low volatility portfolio.
Why 33% bonds? Because of the work of Ritholtz Wealth Management’s chief data scientist, Nick Maggiulli, who has found that historically 67% stocks and 33% hedging assets are the optimal allocation to deliver strong returns and minimize bear market declines.
- optimizes for the Sortino ratio
- excess total returns (compared to risk-free treasuries) divided by negative volatility (the only kind that most investors fear)
Zen High-Yield Ultra Low Volatility Portfolio (33% Bonds)
| Metric | 60/40 | Zen High-Yield Ultra Low Volatility Portfolio | X Better Than 60/40 |
| Yield | 2.2% | 4.00% | 1.85 |
| Growth Consensus | 5.1% | 4.1% | 0.80 |
| LT Consensus Total Return Potential | 7.3% | 8.1% | 1.12 |
| Risk-Adjusted Expected Return | 5.1% | 5.7% | 1.12 |
| Safe Withdrawal Rate (Risk And Inflation-Adjusted Expected Returns) | 2.8% | 3.4% | 1.21 |
| Conservative Time To Double (Years) | 25.8 | 21.3 | 1.21 |
(Source: DK Research Terminal, FactSet)
Even with a 33% allocation to lower yielding and returning bonds (3.5% right now), this Zen High-Yield Ultra Low Volatility Portfolio offers 2X the yield of a 60/40 and nearly 1% higher long-term return potential.
- 27% more inflation-adjusted wealth over 30 years
And just take a look at how it helped investors sleep well at night over the last two decades.
Total Returns Since August 2002 (Annual Rebalancing)
(Source: Portfolio Visualizer Premium)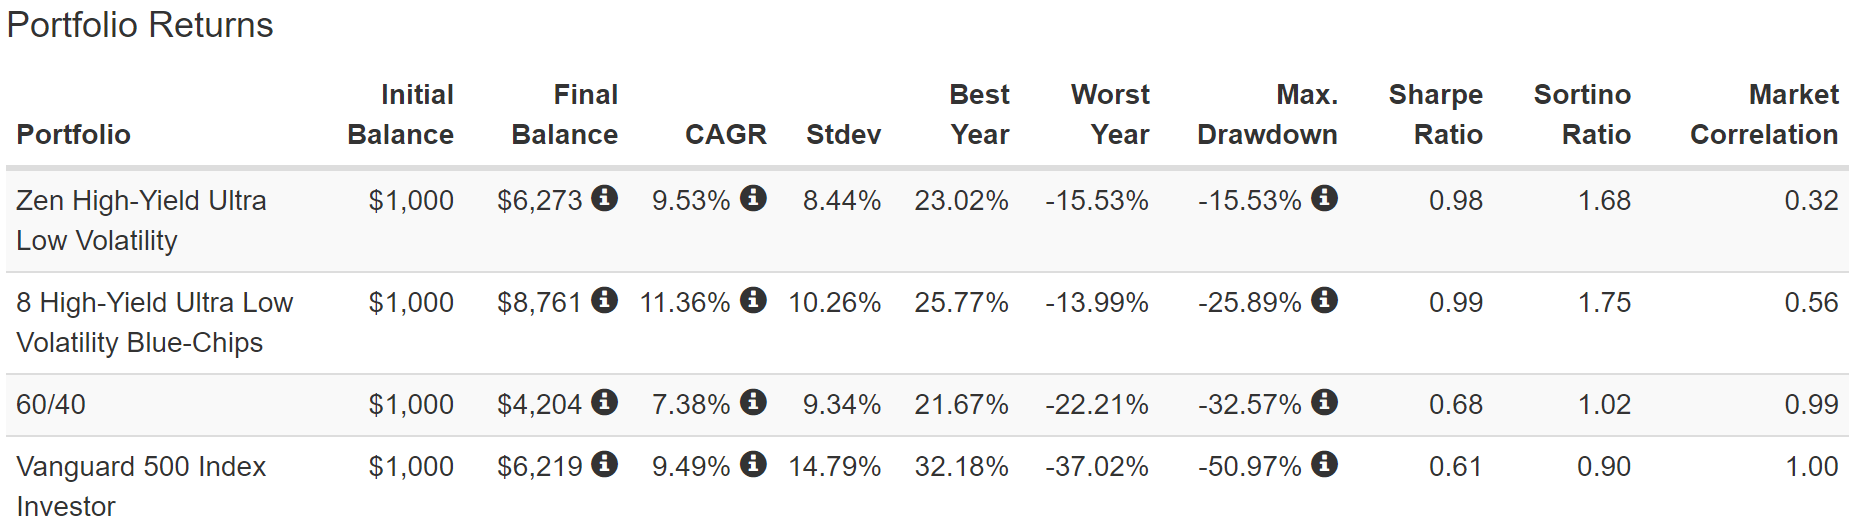
In exchange for a little smaller annual return (it still beat the 60/40 and matched the S&P 500) investors experienced just 8% annual volatility and a peak decline of just 16% during the Great Recession.
- 50% smaller peak decline than a 60/40
- 70% smaller peak decline than the S&P 500
That’s 66% better negative volatility-adjusted returns than a 60/40 and almost double the Sortino of the S&P 500.
(Source: Portfolio Visualizer Premium)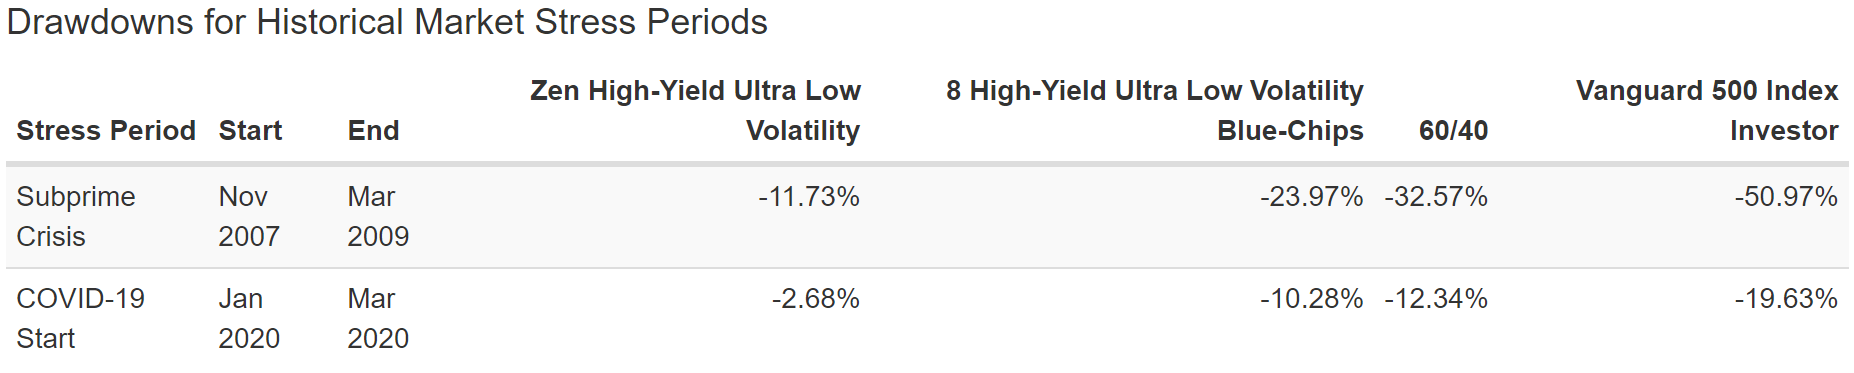
How does a 3% dip during the Pandemic crash strike you? Seems pretty SWANy to me.
(Source: Portfolio Visualizer Premium)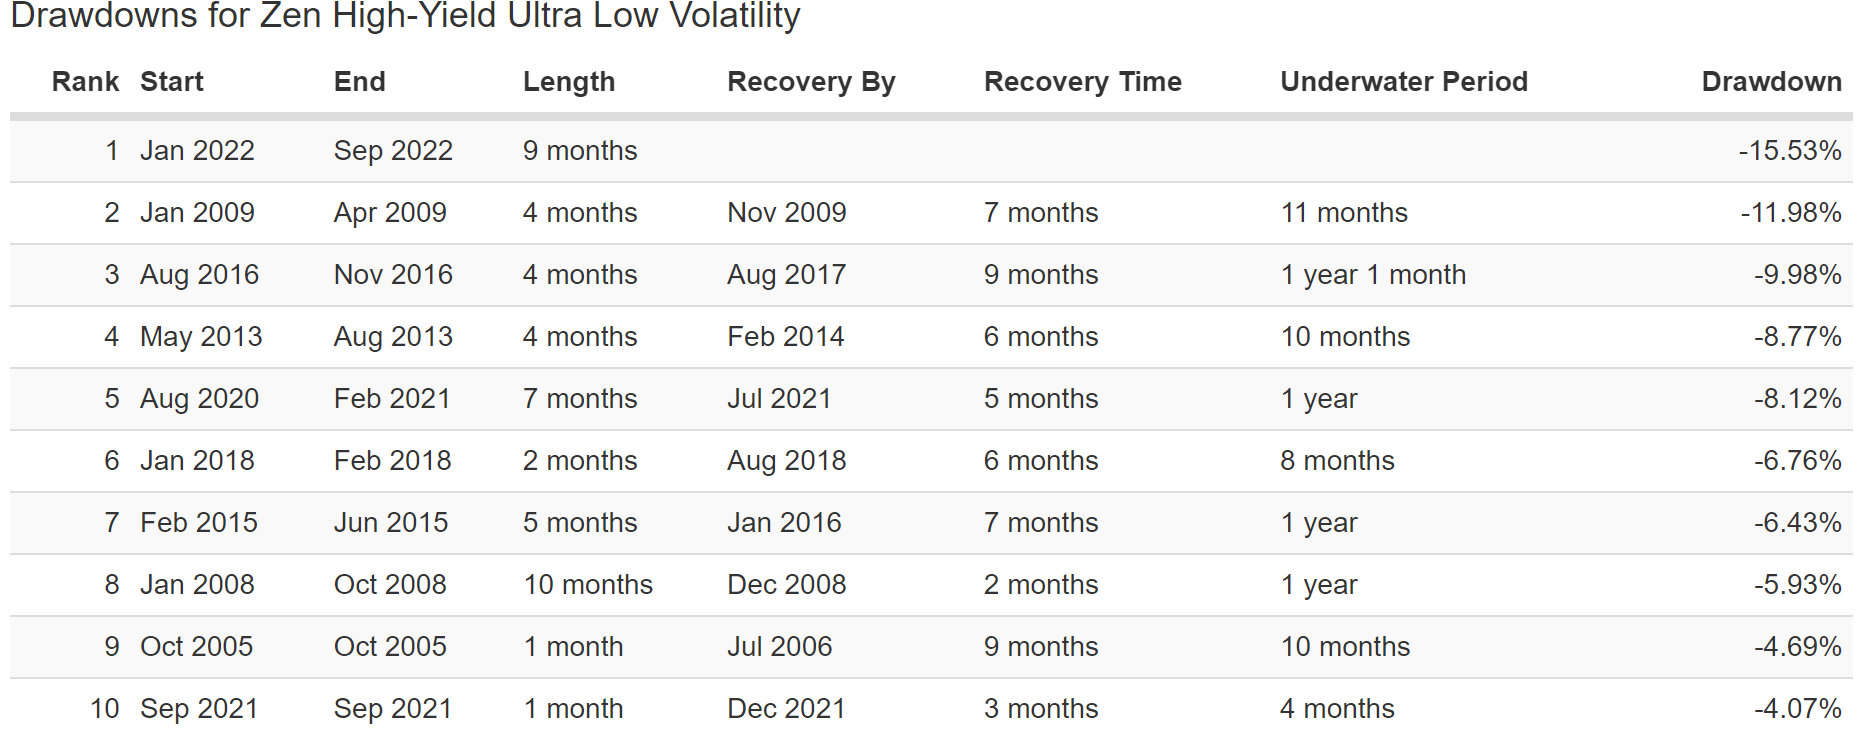
In fact, in the last 15 years, this portfolio hasn’t once experienced a bear market, and it’s had just two corrections.
OK, but now that we’re in stagflation, bonds aren’t working.
Managed Futures: When Bonds Fail, They Hedge Your Hedges
Daily Shot 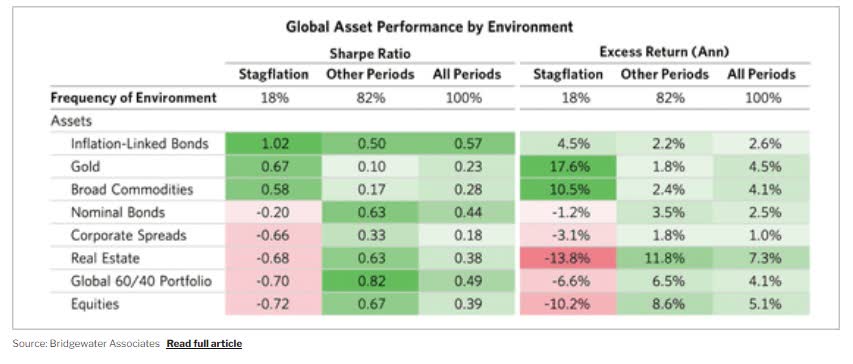
18% of the time, the US is in stagflation, commodities, and gold shine. The rest of the time, they underperform or even deliver negative real returns.
Wouldn’t it be amazing if you could own a blue-chip asset that knows when to go long or short, not just commodities but also stocks, bonds, and even currencies?
That’s what blue-chip managed futures funds do, by going long or short these four asset classes to provide any asset’s most consistent zero or even negatively correlated returns.
- especially during stagflation
- and during market downturns
RCM Alternatives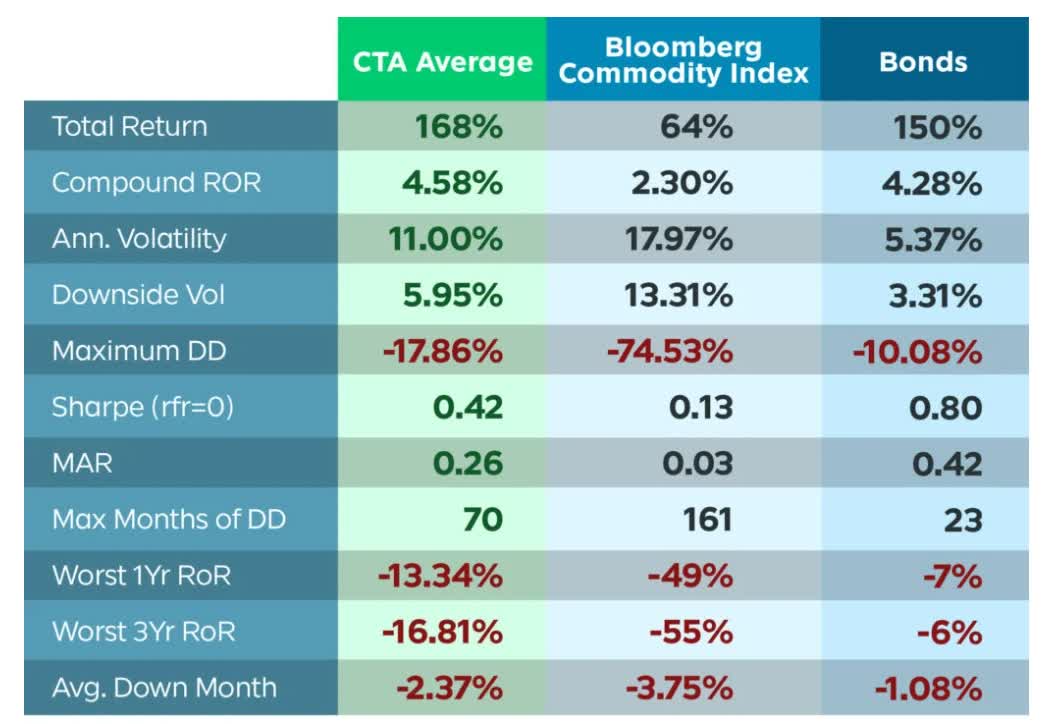
Since 2001 managed futures have delivered about 0.5% higher real returns than bonds (though with higher volatility).
Gold and commodities and options work sometimes but at the cost of negative real returns over decades. Bonds and managed futures deliver positive real returns and are the most effective hedging strategies ever discovered.
So now let me show you what happens when we cut our 33% hedging bucket in half and build the following Zen High-Yield Ultra Low Volatility portfolio.
- 67% 8 High-Yield Ultra Low Volatility Blue-chips (8.4% each)
- 16.7% long-bonds (EDV)
- 16.7% AlphaSimplex Managed Futures Fund (AMFAX)
Zen High-Yield Ultra Low Volatility Portfolio (17% Bonds, 17% Hedge Fund)
| Metric | 60/40 | Zen High-Yield Ultra Low Volatility Portfolio | X Better Than 60/40 |
| Yield | 2.2% | 4.1% | 1.90 |
| Growth Consensus | 5.1% | 4.2% | 0.82 |
| LT Consensus Total Return Potential | 7.3% | 8.3% | 1.14 |
| Risk-Adjusted Expected Return | 5.1% | 5.8% | 1.14 |
| Safe Withdrawal Rate (Risk And Inflation-Adjusted Expected Returns) | 2.8% | 3.5% | 1.25 |
| Conservative Time To Double (Years) | 25.8 | 20.6 | 1.25 |
(Source: Portfolio Visualizer Premium)
The yield, long-term return potential, and withdrawal rate increased by 0.1%.
- even after accounting for the higher expense ratio of AMFAX
In theory, we’ve just made a wonderful portfolio even better.
Now let’s see what the historical results are.
Total Returns Since August 2010 (Annual Rebalancing)
(Source: Portfolio Visualizer Premium)
1% higher long-term returns than a 60/40, just as analysts expect in the future. But with slightly lower annual volatility AND a 67% smaller peak decline during the 2022 stagflation bear market.
- 27% higher negative-volatility-adjusted total returns than a 60/40
- 22% higher Sortino than the Zen HYULV portfolio with bonds alone
(Source: Portfolio Visualizer Premium)
How are these portfolios doing in 2022?
- S&P -18%
- Zen HYULV (Bonds) -18%
- 60/40 -16%
- 8 High-Yield Ultra Low Volatility Blue-Chips -10%
- Zen HYULV (Bonds + Hedge Fund): -5.7%
1/3rd the decline of the market and a 60/40 during this stagflationary bear market.
(Source: Portfolio Visualizer Premium)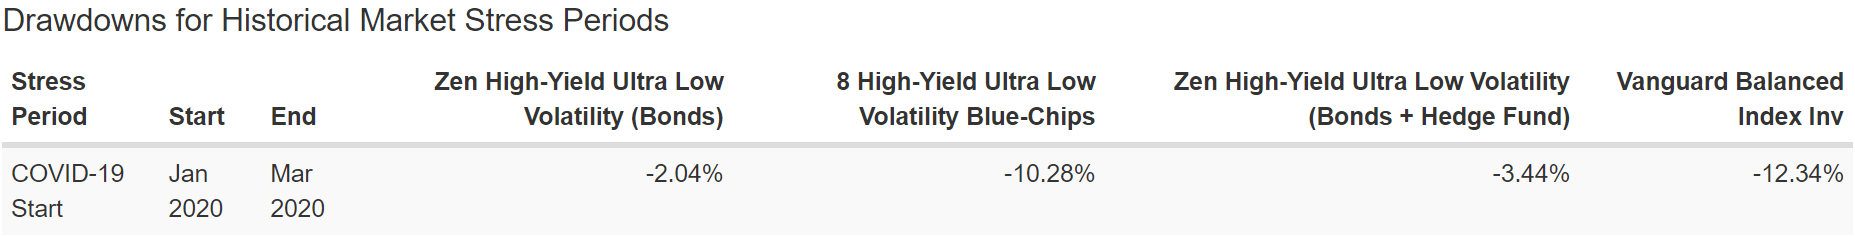
-3% during the Pandemic, 1/4th as much as a 60/40. And down 1/3rd as much in the 2022 stagflation bear market.
(Source: Portfolio Visualizer Premium)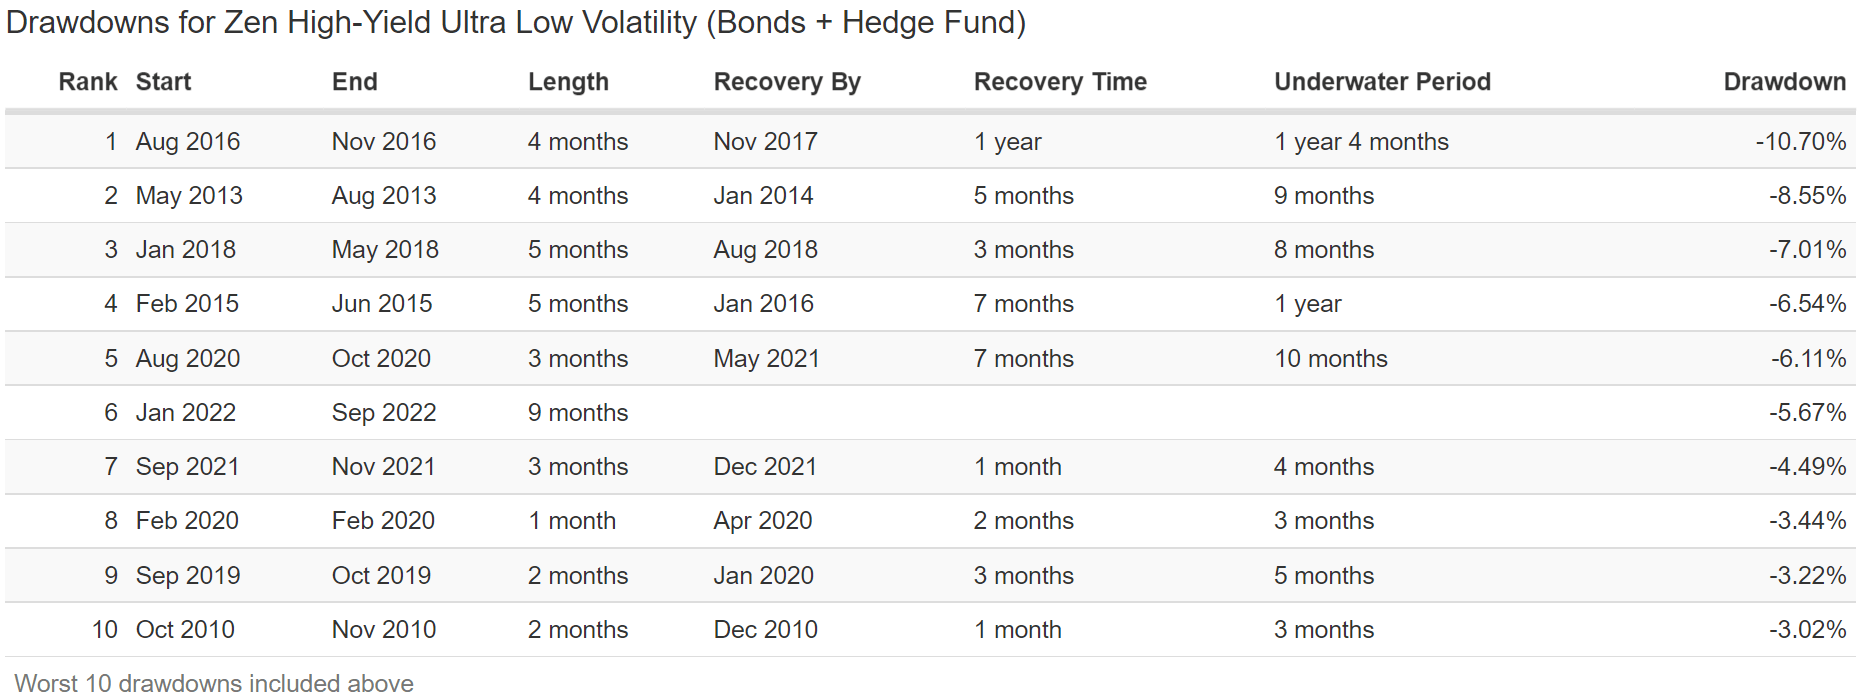
In 11 years, this portfolio has never fallen more than 11%. In fact, it’s suffered just one correction in over a decade.
Charlie Bilello 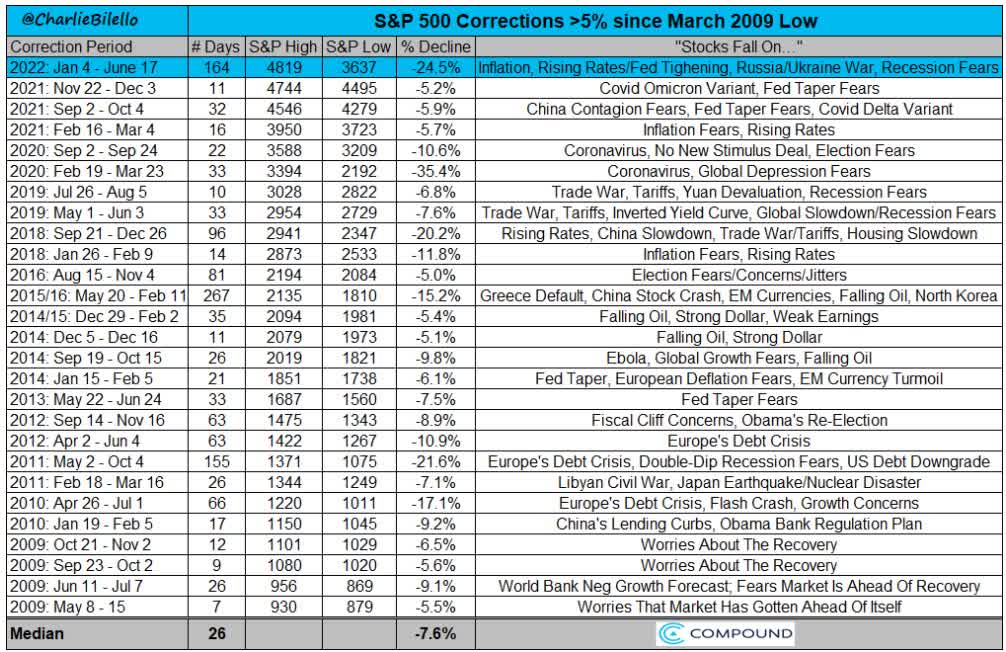
The S&P 500 has suffered 10 corrections and 27 pullbacks, corrections, and bear markets.
- one every 6 months on average
- the same frequency as since WWII
Bottom Line: These 8 High-Yield Retirement Dream Blue-Chips Can Help You Thrive In This Bear Market
Bear markets can be scary. Stagflationary bear markets can be terrifying since we haven’t had one in 41 years.
But as hard as it might be to believe, this too shall pass, and the likely reward for avoiding the siren song of market timing is likely to be exceptional.
Charlie Billelo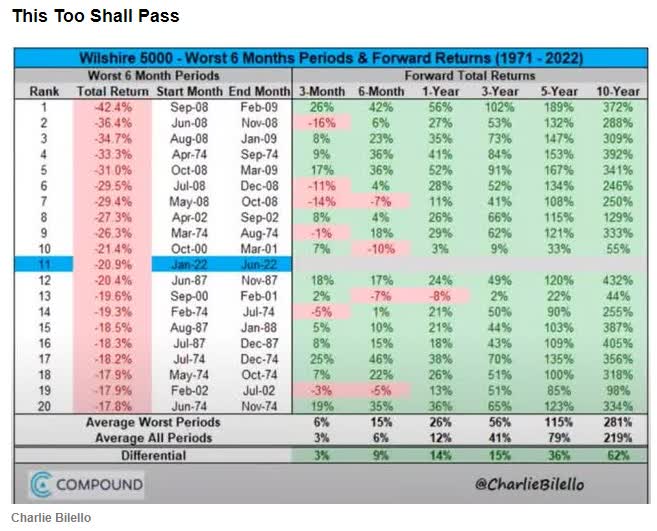
Even if the Fed doesn’t defeat inflation, which the bond market and blue-chip economist consensus are confident it will, guess what? The stock market is still likely to be almost 4X higher in a decade.
It’s likely to be up in just three years, a brand new bull market that will make us all feel like stock market geniuses. That is, as long as we avoid the dangerous temptation to time the market.
Trusting high-yield ultra-low volatility blue-chips like KMB, CLX, NVS, VZ, FTS, RBGLY, TU, and UGI is a great alternative to market timing.
- 4.1% very safe yield
- average BBB+ stable credit rating
- 28-year average dividend growth streak
- 10% CAGR long-term return potential (just as they’ve delivered over the last 26 years)
- 25% peak decline in the Great Recession
- down 10% in the 2022 stagflation bear market
Blue-chips like these, alone or combined with bonds and the world’s best hedge funds, can help you ride out the current market storm.
- 66% smaller peak declines than a 60/40 this year
- 66% smaller declines than the market this year
But more importantly, they can help you achieve double the yield of a 60/40, while achieving superior long-term returns.
Or, to put it another way, blue-chips like these let you play defense and offense simultaneously. This is how you can generate the kind of income, income growth, and total returns that can help you sleep well today while retiring in safety and splendor in the years and decades to come.
Be the first to comment