

peshkov/iStock via Getty Images
Soaring inflation and surging interest rates have caused the 2022 bear market to be one of the most painful in recent memory.
YCharts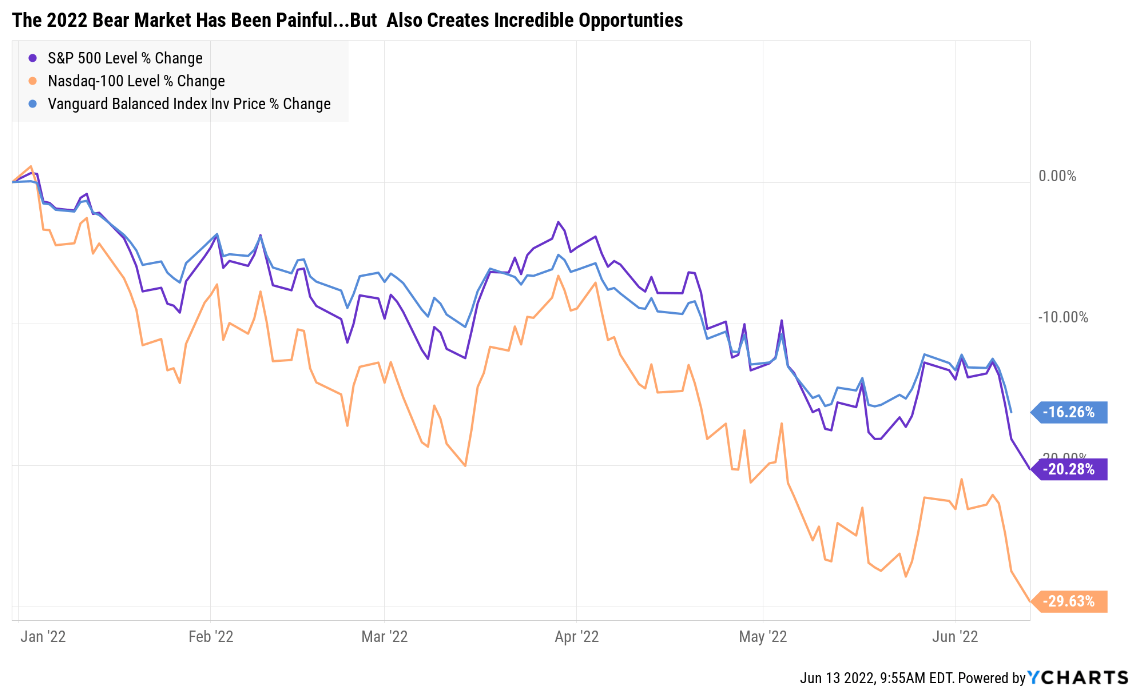
That’s because the 60/40 portfolio, one of the most time-tested ways for building and protecting long-term wealth, is down almost as much as the S&P 500.
That’s courtesy of the worst bond bear market in history, which was created by the perfect storm of risk factors.
- record-low interest rates in August 2020 (0.5% on the 10-year yield)
- followed by the worst inflation in 40 years
I know that right now a lot of investors are frightened because we’ve seen many days like June 13th, when there is simply nowhere to hide (other than cash).
- commodities are down (including oil)
- gold and silver are both down (theoretical inflation hedges)
- bonds are down
- stocks are down
- low volatility/value stocks (a major outperformed this year) are down
- crypto (a supposed inflation hedge) is down 11%
On days like this, there is no place to hide except cash, and it’s easy to give in to your emotions which is usually a mistake.
Your gut is probably screaming “This time is different! Sell everything and go to cash!”. I know mine is.
But guess what? Stocks and bonds falling together occurs 8% of the time since WWII.
Charlie Bilello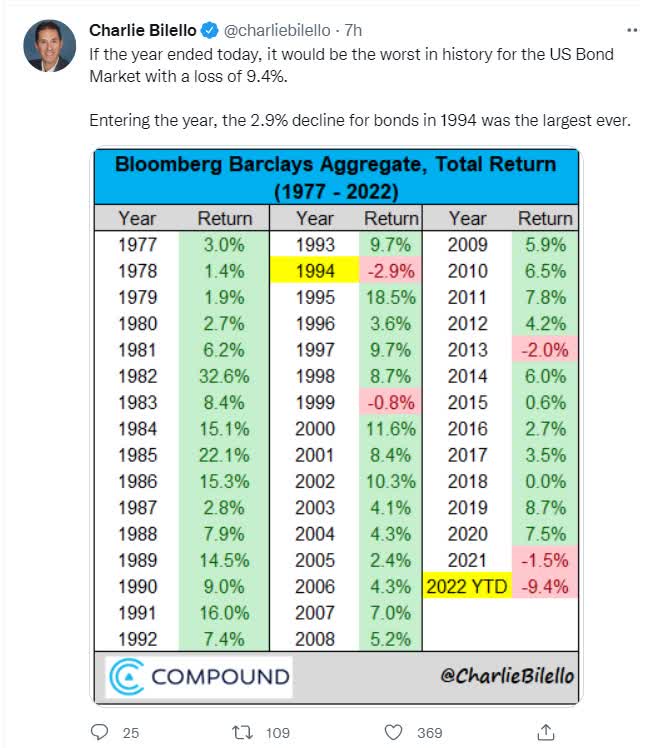
In fact, from 1977 through 1982, bonds actually outperformed stocks and went up, even in that stagflationary hell.
What is my point? That it’s easy to give in to fear and be tempted to throw out your carefully constructed long-term investment plan.
But guess what? While it may feel good, at least initially, to “do something”, decades of studies show that doing something in periods of intense market fear means usually doing the wrong thing.
Don’t just do something, stand there.” – Jack Bogle, founder of Vanguard
JPMorgan Asset Management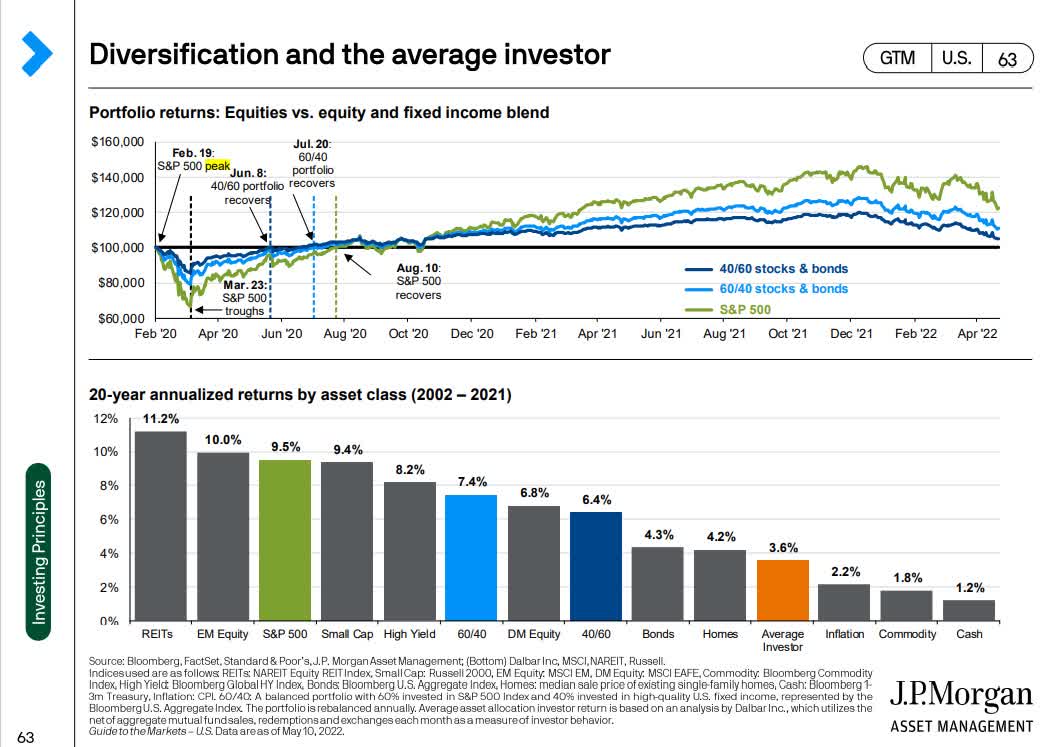
If you think you can time the market, you’re 98% likely to be wrong according to studies from Fidelity and JPMorgan.
Over the last 20 years, the average investor underperformed the S&P 500 by 62% due to market timing.
That underperformed every asset class except for commodities and cash.
So what’s a prudent long-term investor to do when the bears are ravaging Wall Street and it feels like the pain will never end?
- trust your long-term portfolio risk-management plan
- and ignore the market if you can’t afford to buy anything (let your DRIP work for you)
- take advantage of incredible blue-chip bargains if you can
Fortunes are born in bear markets.” – Value Investor Todd Sullivan
Today, I wanted to highlight seven amazing ultra-safe high-yield blue-chips.
Not just high-yield blue-chips but the safest high-yield blue-chips in seven sectors.
These are the safest source of high-yield you can buy within a diversified and prudently diversified stock portfolio.
7 Ultra-Safe High-Yield Retirement Dream Stocks
How did I screen for these ultra-safe high-yield retirement dream stocks?
Using the Dividend Kings Zen Research Terminal:
- reasonable or good buys or better
- 81+ dividend safety
- 3.4+% yield (2X the market’s yield)
- 10+% long-term consensus total return potential
I then sorted by highest dividend safety and selected the highest yielding name in each sector and then used the watchlist editor to create a watchlist of an Ultra-Safe high-yield portfolio that’s diversified and as safe as safe can be.
Dividend Kings Zen Research Terminal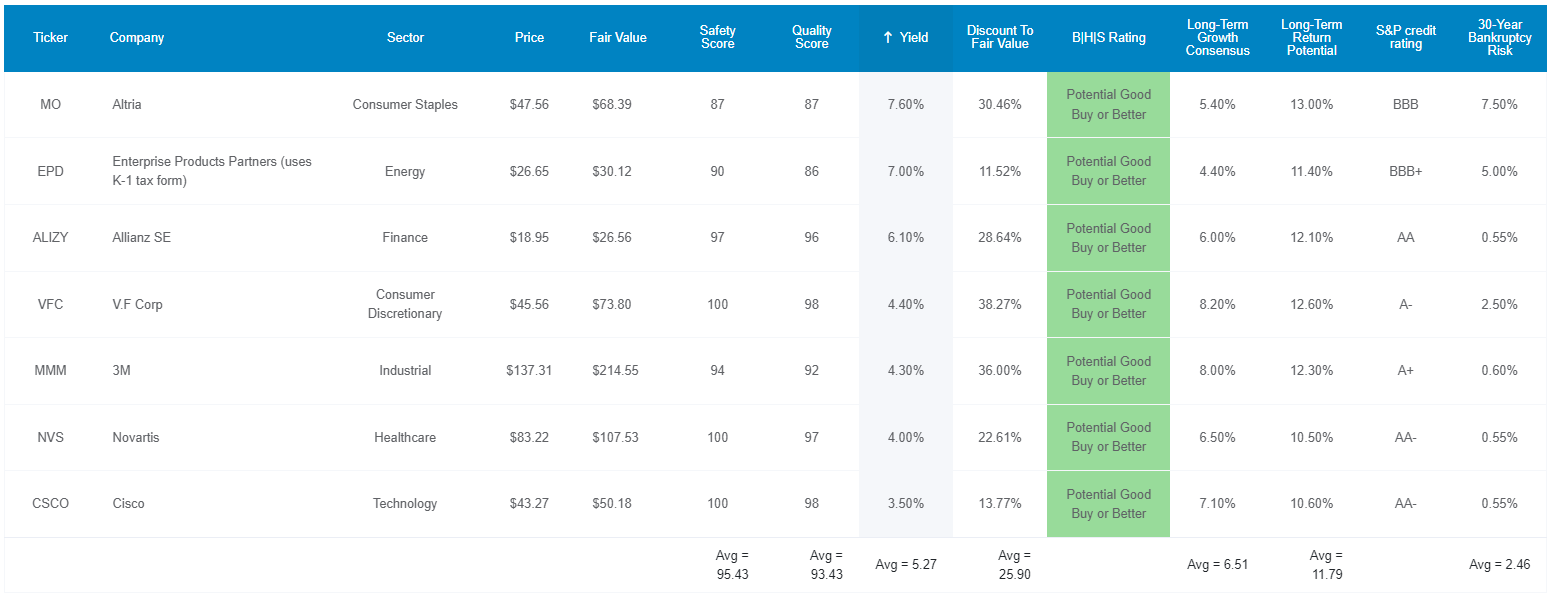
I’ve linked to articles providing a deep-dive analysis of each company’s investment thesis, growth outlook, risk profile, valuation, and total return potential.
Why are these the safest of the safe high-yield blue-chips? Just take a look at how they compare to the dividend aristocrats.
| Metric | Dividend Aristocrats | 7 Ultra Safe Retirement Dream Stocks | Winner Aristocrats |
Winner 10 Safest Dividend Blue-Chips |
| Quality | 87% | 93% | 2 | |
| Safety | 89% | 95% | 2 | |
| Dependability | 84% | 93% | 2 | |
| Long-Term Risk Management Industry Percentile | 67% (Above-Average) |
79% (Good Bordering On Very Good) |
2 | |
| Average Credit Rating | A- Stable | A- stable | 1 | 1 |
| Average 30-Year Bankruptcy Risk | 3.01% | 2.46% | 1 | |
| Average Dividend Growth Streak (Years) | 44.3 | 32.3 | 1 | |
| Average Return On Capital | 100% | 432% | 1 | |
| Average ROC Industry Percentile | 83% | 93% | 1 | |
| 13-Year Median ROC | 89% | 197% | 1 | |
| Total | 2 | 13 |
(Source: DK Research Terminal)
In almost every measure of safety and quality, these ultra-safe retirement dream stocks have the aristocrats beat.
That includes returns on capital that are more than 4X as high, and in the top 7% of their industry peers.
- return on capital is Joel Greenblatt’s gold standard proxy for quality and moatiness.
What does a 95% average safety score mean?
| Rating | Dividend Kings Safety Score (162 Point Safety Model) | Approximate Dividend Cut Risk (Average Recession) |
Approximate Dividend Cut Risk In Pandemic Level Recession |
| 1 – unsafe | 0% to 20% | over 4% | 16+% |
| 2- below average | 21% to 40% | over 2% | 8% to 16% |
| 3 – average | 41% to 60% | 2% | 4% to 8% |
| 4 – safe | 61% to 80% | 1% | 2% to 4% |
| 5- very safe | 81% to 100% | 0.5% | 1% to 2% |
| 7 Ultra Safe Retirement Dream Stocks | 95% | 0.5% | 1.30% |
| Risk Rating | Low-Risk (79th industry percentile risk-management consensus) | A- stable outlook credit rating 2.5% 30-year bankruptcy risk |
15% OR LESS Max Risk Cap Recommendation (15% Each) |
(Source: DK Research Terminal)
It means that during an average recession since WWII, the approximate risk of a dividend cut is 0.5%, and even in a Pandemic or Great Recession-level severe recession, the risk is about 1.3%.
S&P estimates a 2.5% average risk of bankruptcy over the next 30 years, slightly below that of the dividend aristocrats.
Six rating agencies estimate these blue-chips long-term risk management to be in the top 21% of their industry peers.
| Classification | Average Consensus LT Risk-Management Industry Percentile |
Risk-Management Rating |
| S&P Global (SPGI) #1 Risk Management In The Master List | 94 | Exceptional |
| 7 Ultra Safe High-Yield Retirement Dream Stocks | 79 |
Good – Bordering On Very Good |
| Strong ESG Stocks | 78 |
Good – Bordering On Very Good |
| Foreign Dividend Stocks | 75 | Good |
| Ultra SWANs | 71 | Good |
| Low Volatility Stocks | 68 | Above-Average |
| Dividend Aristocrats | 67 | Above-Average |
| Dividend Kings | 63 | Above-Average |
| Master List average | 62 | Above-Average |
| Hyper-Growth stocks | 61 | Above-Average |
| Monthly Dividend Stocks | 60 | Above-Average |
| Dividend Champions | 57 | Average |
(Source: DK Research Terminal)
Ok, so now that you can see how these ultra-safe high-yield blue-chips are names you can trust, let’s see why you might want to buy them today.
Wonderful Companies At Wonderful Prices
The S&P 500 is now trading at a forward P/E of 15.8, meaning stocks are (barring earnings estimate declines) about 6% historically undervalued.
But take a look at the incredible bargains you can get with these ultra-safe retirement dream stocks.
Dividend Kings Zen Research Terminal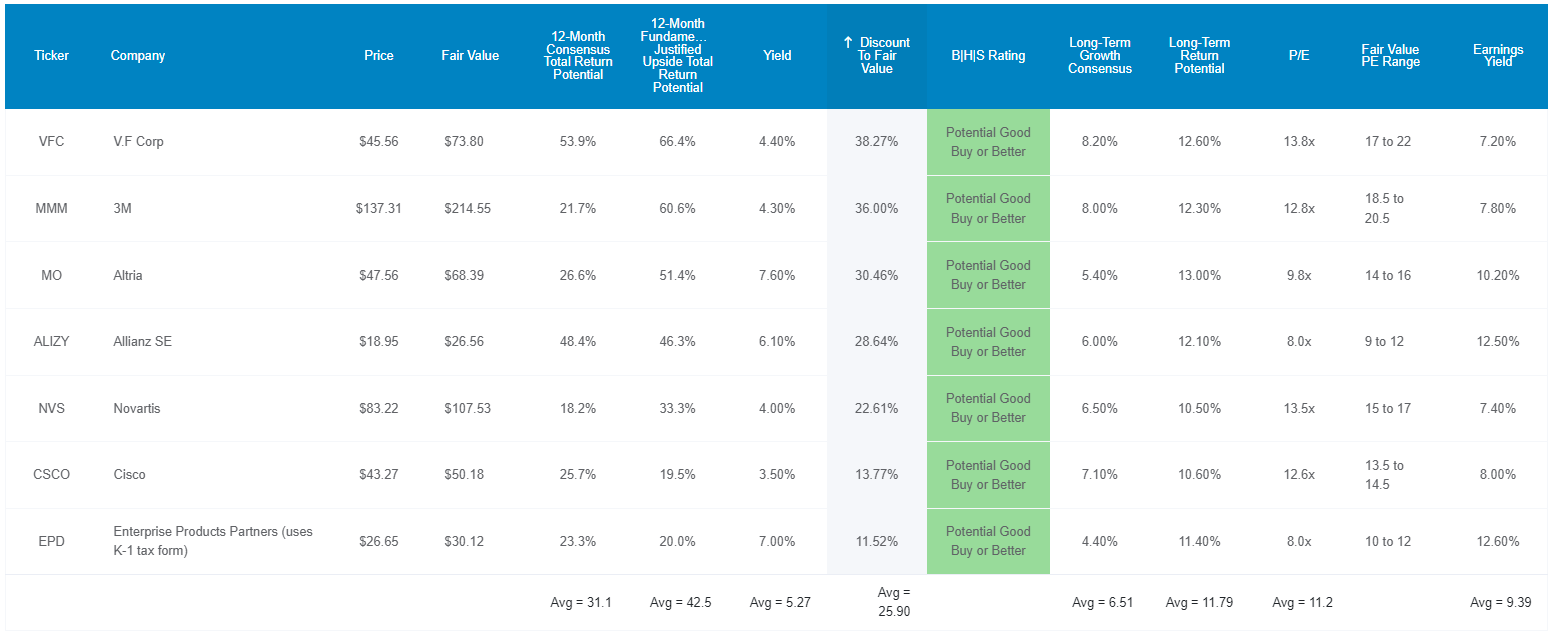
They are 26% historically undervalued and trading at a forward P/E of 11.2!
The last time the S&P 500 was undervalued was in 2009, during the Great Recession.
- literally pricing in a severe recession already
That’s why analysts expect a 31% total return in just the next year, but they are so undervalued that a 43% total return in the next 12 months would be justified by their fundamentals.
Ok, so now we can see these blue-chips quality and valuation, but here’s what makes them potential rich retirement dream stocks.
Long-Term Returns That Can Help You Retire In Safety And Splendor
Dividend Kings Zen Research Terminal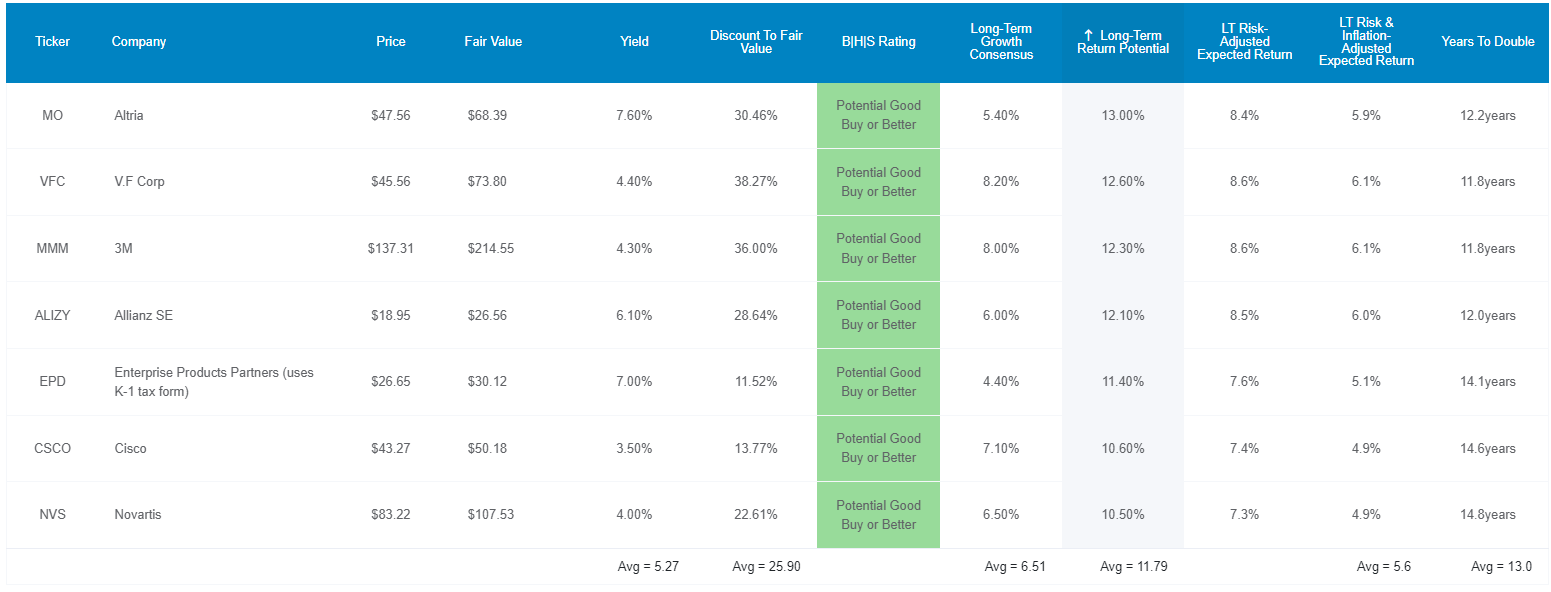
Not only do these ultra-safe retirement dream stocks yield a very safe 5.3% but analysts expect 6.5% long-term growth, meaning 11.8% long-term return potential.
- adjusting for the risk of these companies not growing as expected and the bond market’s long-term inflation expectations, that’s 5.6% long-term return potential
- vs 4.6% for the S&P 500
What does that mean?
- the S&P 500 can realistically double your wealth every 16 years
- these ultra-safe high-yield blue-chips every 13 years
Inflation-Adjusted Consensus Total Return Potential: $1,000 Initial Investment
| Time Frame (Years) | 7.6% CAGR Inflation-Adjusted S&P Consensus | 8.4% Inflation-Adjusted Aristocrats Consensus | 9.3% CAGR Inflation-Adjusted 7 Ultra-Safe Retirement Dream Stock Consensus | Difference Between Inflation Adjusted 7 Ultra-Safe Retirement Dream Stock Consensus Vs S&P Consensus |
| 5 | $1,445.67 | $1,493.29 | $1,562.06 | $116.38 |
| 10 | $2,089.97 | $2,229.92 | $2,440.02 | $350.05 |
| 15 | $3,021.42 | $3,329.92 | $3,811.45 | $790.03 |
| 20 | $4,367.98 | $4,972.54 | $5,953.70 | $1,585.72 |
| 25 | $6,314.67 | $7,425.45 | $9,300.02 | $2,985.34 |
| 30 | $9,128.95 | $11,088.36 | $14,527.15 | $5,398.20 |
(Source: DK Research Terminal, FactSet)
Analysts think these ultra-safe high-yield blue-chips could deliver almost 15X inflation-adjusted returns over the next 30 years.
| Time Frame (Years) | Ratio Aristocrats/S&P Consensus | Ratio Inflation-Adjusted 7 Ultra-Safe Retirement Dream Stock Consensus Vs S&P Consensus |
| 5 | 1.03 | 1.08 |
| 10 | 1.07 | 1.17 |
| 15 | 1.10 | 1.26 |
| 20 | 1.14 | 1.36 |
| 25 | 1.18 | 1.47 |
| 30 | 1.21 | 1.59 |
(Source: DK Research Terminal, FactSet)
That’s 60% more than the S&P 500 and 40% more than the dividend aristocrats.
What evidence is there that these ultra-safe blue-chips can actually deliver close to 12% long-term returns?
Historical Returns Since August 1998 (Annual Rebalancing)
“The future doesn’t repeat, but it often rhymes.” – Mark Twain
Past performance is no guarantee of future results, but studies show that blue-chips with relatively stable fundamentals over time offer predictable returns based on yield, growth, and valuation mean reversion.
Bank of America
So here’s how these ultra-safe high-yield blue-chips have performed over the last 24 years when over 91% of returns were the result of fundamentals, not luck.
(Source: Portfolio Visualizer Premium)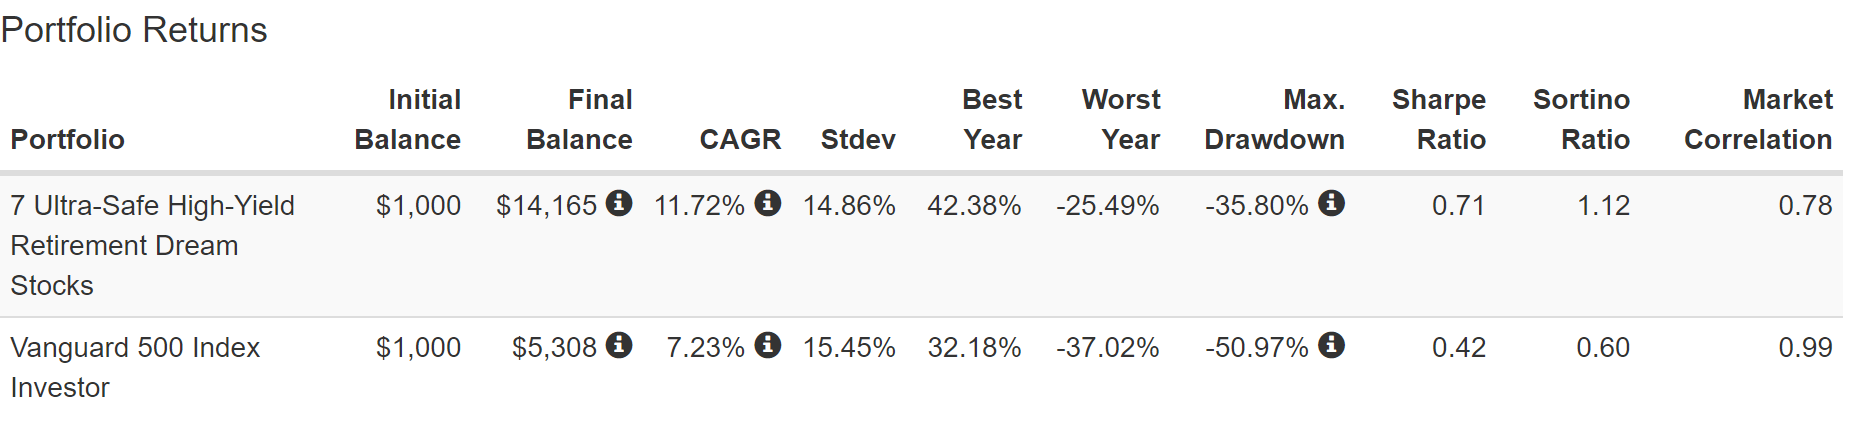
What’s the S&P 500’s risk-adjusted unexpected return? 7.1%. What returns did the market deliver over the last quarter-century? 7.2%.
What’s the long-term consensus return potential for these ultra-safe high-yield blue-chips? 11.8%. What’s their historical return? 11.7%.
Not just did they beat the market by 4.5% annually over 24 years, but they did so with almost 1% lower annual volatility (despite owning 70X fewer companies).
They also fell 36% during the Great Recession compared to the market getting cut in half.
- 87% higher negative volatility-adjusted total returns than the S&P 500
(Source: Portfolio Visualizer Premium)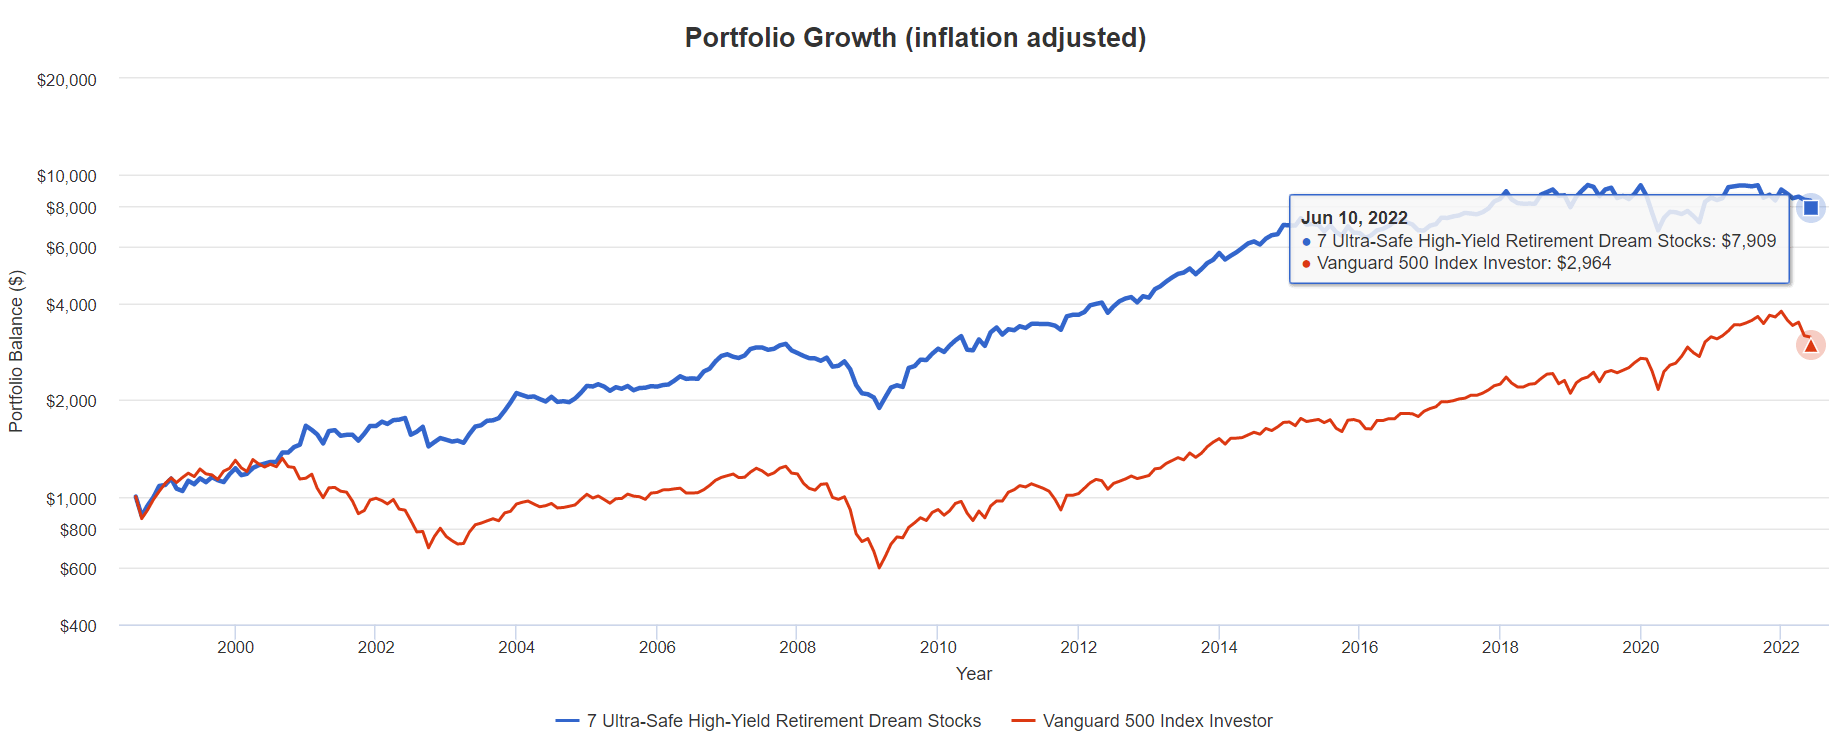
Over the last 24 years, the S&P 500 delivered 3X inflation-adjusted returns while these ultra-safe high-yield blue-chips delivered almost 3X more, 8X real returns.
(Source: Portfolio Visualizer Premium)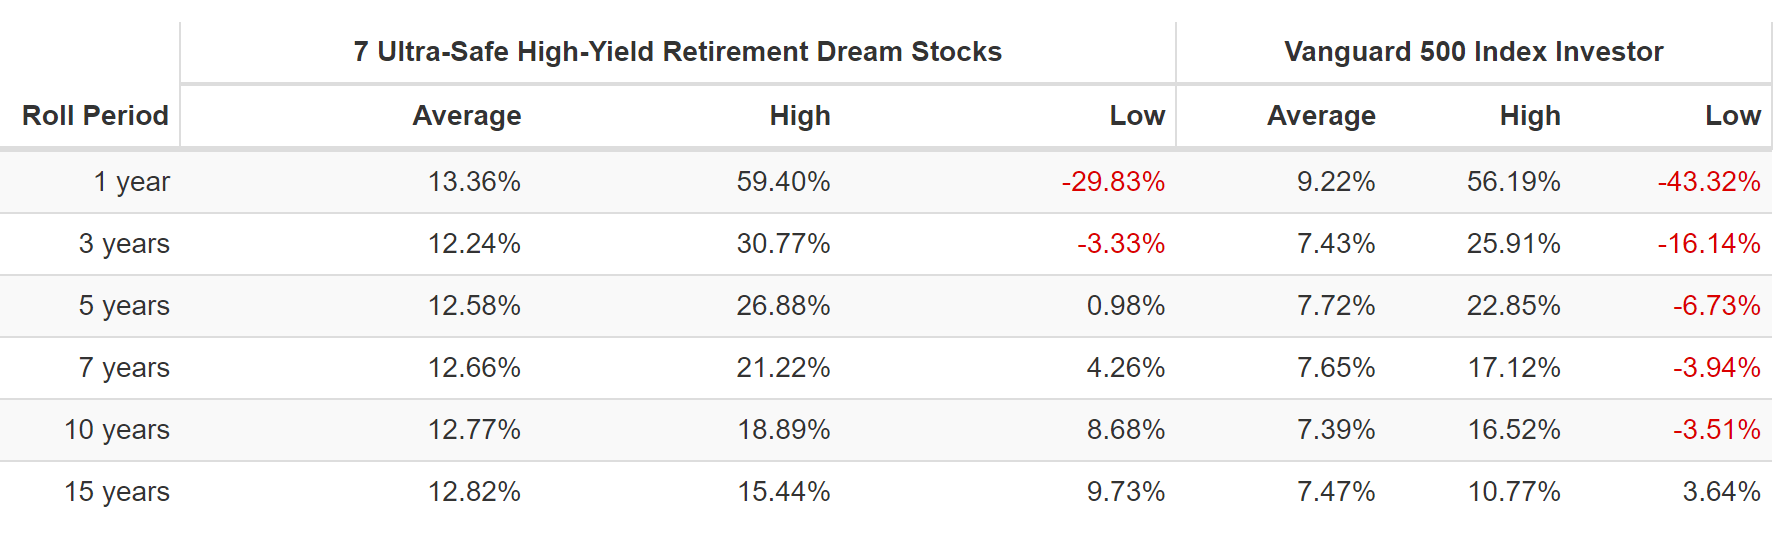
Their average rolling returns were 12% to 13% per year, and the worst 10-year return was an 8.7% return.
- worst 10-year return was +130% vs S&P 500’s -30%
(Source: Portfolio Visualizer Premium)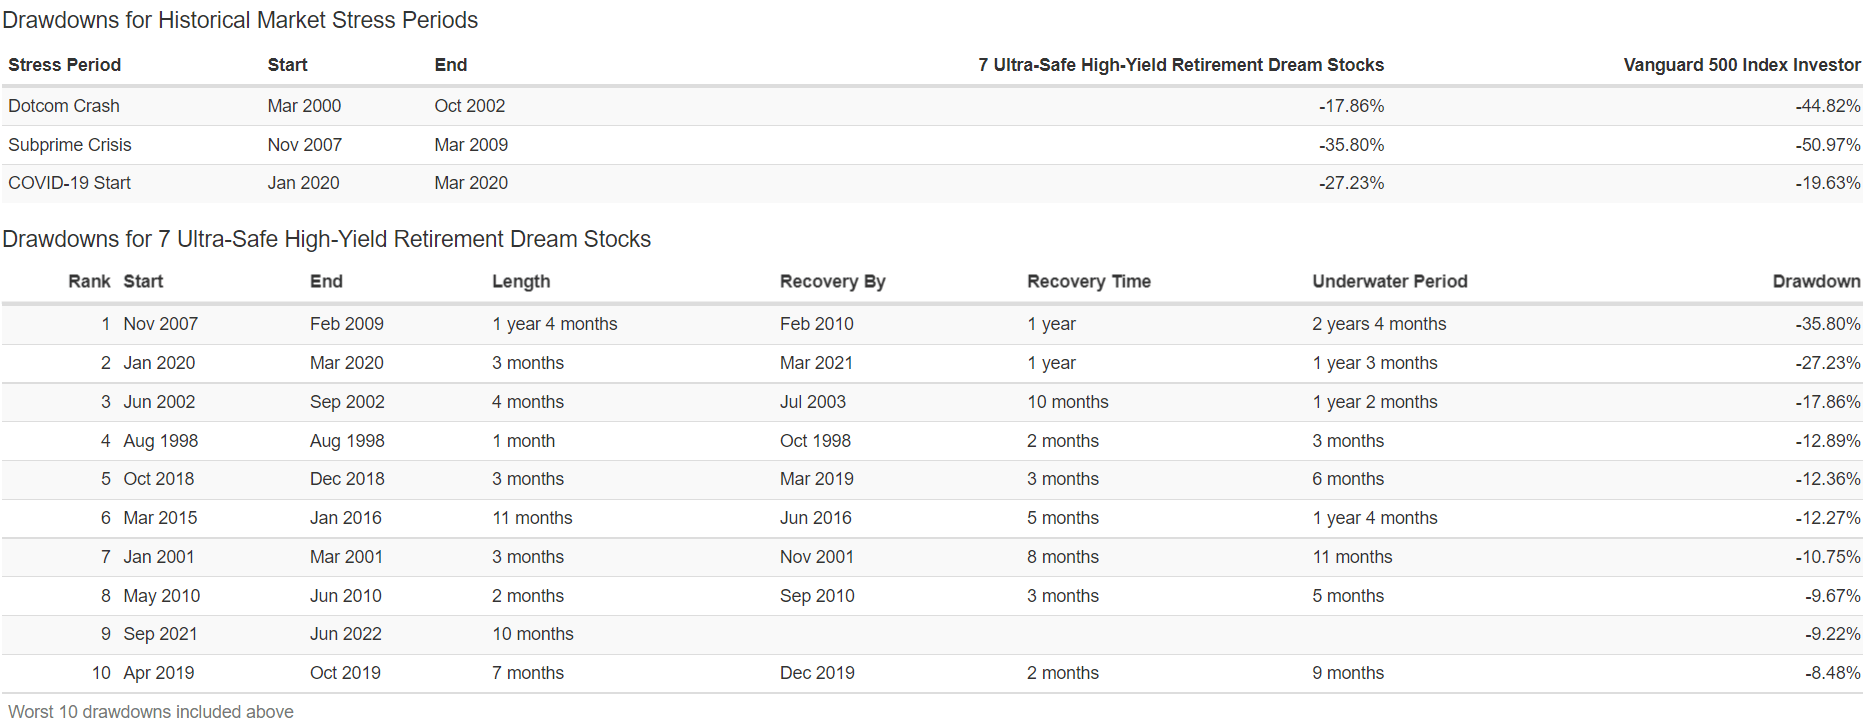
During the tech crash, they fell 18% while the market fell 45%.
During the Great Recession, they fell 36% while the market fell 51%.
- a 60/40 portfolio fell 31%
During the Pandemic, they did underperform with a 27% decline vs the market’s 20%.
But in the 2022 bear market, they are down just 9% while the market is down 20%.
- significantly outperformed the S&P 500 in three of the last four bear markets
That’s the power of ultra-safe high-yield blue-chips, to help you retire rich, and stay rich in retirement, in even the most extreme economic and market conditions.
What About Income Growth?
| Portfolio | 1999 Income Per $1,000 Investment | 2021 Income Per $1,000 Investment | Annual Income Growth | Starting Yield | 2021 Yield On Cost |
| S&P 500 | $23 | $160 | 9.22% | 2.3% | 16.0% |
| 7 Ultra-Safe High-Yield Retirement Dream Stocks | $38 | $701 | 14.17% | 3.8% | 70.1% |
(Source: Portfolio Visualizer Premium)
Over the last 22 years, the S&P 500 has delivered 9.2% annual income growth while these ultra-safe high-yield blue-chips delivered 14%.
They started out yielding a lot more and ended up with a yield on cost of 70% vs the S&P 500’s 16%.
- 65% higher starting yield vs 3.1X higher yield today
- 56% faster income growth
- 4.4X higher ending annual income
What about future income growth?
| Analyst Consensus Income Growth Forecast | Risk-Adjusted Expected Income Growth | Risk And Tax-Adjusted Expected Income Growth |
Risk, Inflation, And Tax Adjusted Income Growth Consensus |
| 14.3% | 10.0% | 8.5% | 6.0% |
(Source: Portfolio Visualizer Premium)
Thanks to a much higher starting yield, and nearly identical growth rates, analysts expect slightly higher long-term income growth of 14.3%.
- adjust for the risk of these companies not growing as expected, inflation, and taxes, and 6% real expected income growth is what investors can likely achieve.
Now compare that to what they expect from the S&P 500.
| Time Frame | S&P Inflation-Adjusted Dividend Growth | S&P Inflation-Adjusted Earnings Growth |
| 1871-2021 | 1.6% | 2.1% |
| 1945-2021 | 2.4% | 3.5% |
| 1981-2021 (Modern Falling Rate Era) | 2.8% | 3.8% |
| 2008-2021 (Modern Low Rate Era) | 3.5% | 6.2% |
| FactSet Future Consensus | 2.0% | 5.2% |
(Sources: S&P, FactSet, Multipl.com)
What about a 60/40 retirement portfolio?
- 0.5% consensus inflation, risk, and tax-adjusted income growth.
In other words, these 7 ultra-safe high-yield blue-chips offer
- 4.5X the market’s yield (and a much safer yield at that)
- 3X its long-term inflation-adjusted consensus income growth potential
- 12X better long-term inflation-adjusted income growth than a 60/40 retirement portfolio
This is the power of ultra-safe high-yield blue-chip investing in this bear market.
What About The Future?
Historical backtesting is great but we need to know what kind of returns and volatility are likely in the future.
- In the last 24 years, we’ve suffered 2 of the worst economic catastrophes since the Great Depression
- three major recessions
- 4 major bear markets
- including the 3rd worst market crash in US history
- inflation ranging from -2.5% to 8.6%
- 10-year Treasury yields ranging from 0.3% to 6.0%
In other words, the last 24 years were so extreme, that it creates a good statistical data source for stress testing for the next 75 years.
- barring recessions and bear markets worse than the Great Recession or Pandemic, this analysis is likely to be highly accurate
- 90% statistical significance with that time frame
75-Year Monte Carlo Simulation: Stress Testing Your Potential Portfolio
- 5,000 simulations
- post-tax earnings (highest tax bracket) for conservatism
- 4% withdrawals- (though can test various withdrawal rates)
- you can also stress test what happens if we get a lost decade at the start of the 75-year period
- starting value $510K average retired couple’s savings
(Source: Portfolio Visualizer Premium)
There is an 80% statistical probability that these companies can deliver between 8.9% and 13.3% annual return in the future.
- vs 11.8% consensus and 11.7% historical returns
- 6.4% to 10.8% inflation-adjusted returns
There is an 80% probability that their largest bear market in the next 75 years will be between 24% and 41%.
There is a 90% probability that the safe withdrawal rate for this 5.3% yielding ultra-safe portfolio is 5.2% with a base case of 8.3%.
What about the S&P 500?
S&P 500 75-Year Monte Carlo Simulation
(Source: Portfolio Visualizer Premium)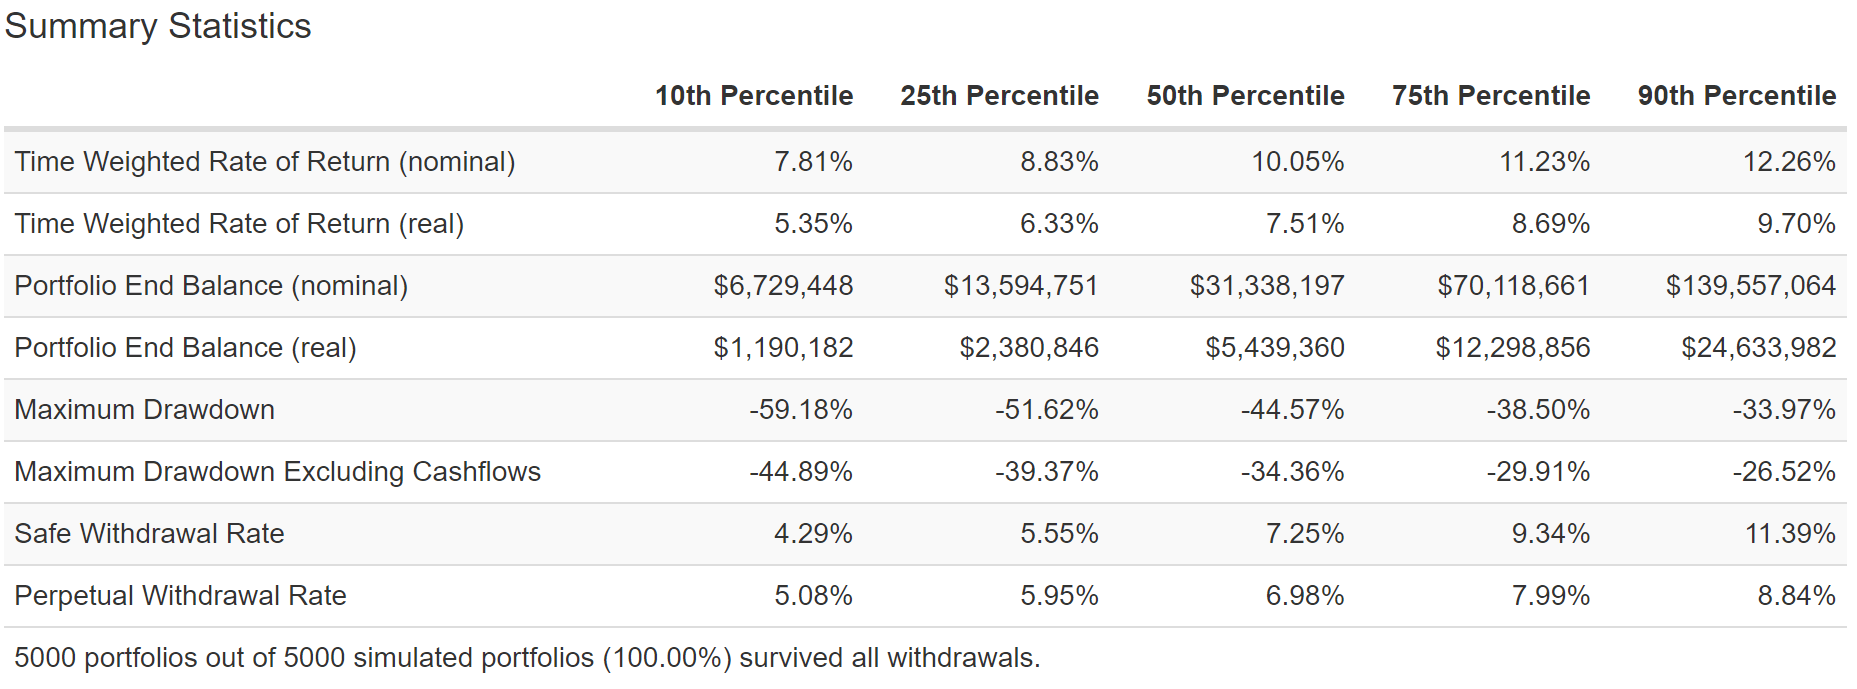
- 80% probability of 7.8% to 12.3% CAGR total returns
- 5.4% to 9.7% inflation-adjusted returns
- 26% to 45% bear market at some point in the future
- base case 34% bear market (historical average recessionary bear market since 1965 is -36%)
- a safe withdrawal rate of 4.3% to 11.4%
What about income generation over time?
Income That Can Help You Retire In Safety And Splendor
| Annual Income Year 1 (7 Ultra-Safe High-Yield Blue-Chips) | $27,046.01 | Annual Income Year 30 (7 Ultra-Safe High-Yield Blue-Chips) | $153,229.37 | ||
| Annual Social Security | $36,887 | Extra Income In Year 1 | $14,288.46 | Extra Inflation-Adjusted Income In Year 30 | $132,075.21 |
| Annual Income Year 1 | $63,933 | Extra Monthly Income In Year 1 | $1,190.70 | Extra Inflation-Adjusted Monthly Income In Year 30 | $11,006.27 |
(Source: DK Research Terminal, FactSet)
Including the average retired couple’s Social Security, this portfolio will generate $64,000 in year-one retirement income.
- vs $52K average retirement spending according to the Bureau of Labor Statistics
- and $42K average retirement spending by age 75+
That’s $14,300 more than a 60/40 portfolio in year one, $1,200 more per month.
After 30 years, this portfolio could be generating an extra $132K per year in inflation-adjusted income, or about $11K per month.
| Total Inflation-Adjusted Income Over 30 Years ($510K Average Retirement Savings) | Average Inflation-Adjusted Annual Retirement Income | Average Monthly Inflation-Adjusted Annual Retirement Income | Average Daily Inflation-Adjusted Annual Retirement Income |
| $2,704,130.68 | $90,137.69 | $7,511.47 | $246.95 |
| Total Inflation-Adjusted Income Over 30 Years ($510K Average Retirement Savings) Including Social Security | Average Annual Income (Including Social Security) | Average Monthly Income (Including Social Security) | Average Daily Inflation-Adjusted Annual Retirement Income |
| $3,810,727.48 | $127,024.25 | $10,585.35 | $348.01 |
(Source: DK Research Terminal, FactSet)
Over 30 years, this portfolio could potentially deliver an average of $127,000 per year in inflation-adjusted retirement income, or 3X more than the average retired couple actually spends.
| Extra Inflation-Adjusted Income Over 30 Years Vs 60/40 | Average Extra Annual Income | Extra Average Monthly Income |
Extra Average Daily Income |
| $2,195,454.97 | $73,181.83 | $6,098 | $200.50 |
(Source: DK Research Terminal, FactSet)
That means a potential $2.2 million in extra inflation-adjusted income compared to a 60/40 retirement portfolio.
That’s potentially an extra $73K per year in extra inflation-adjusted retirement income, or $200 per day, $6,100 per month.
And let’s not forget the incredible extra wealth that the average retired couple is likely to enjoy over the next 30 years.
7 Ultra-Safe High-Yield Blue-Chip 30-Year Monte Carlo Simulation
(Source: Portfolio Visualizer Premium)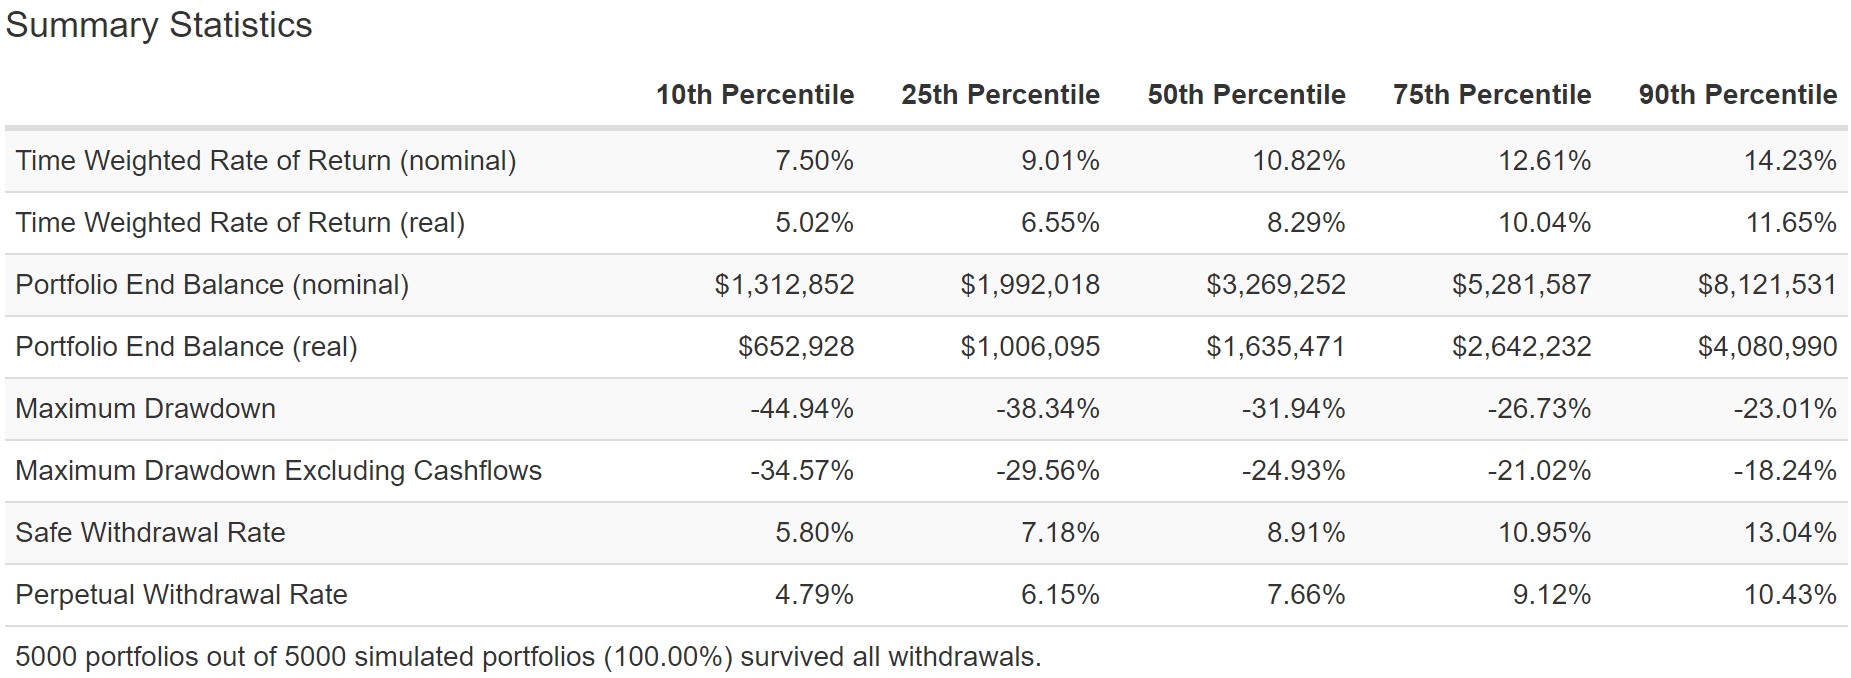
Even withdrawing 4% each year, and assuming the top marginal tax rate, there is a 90% probability that the average retired couple will end up with $653K after a 30-year retirement.
- 2.5% FactSet consensus safe 60/40 withdrawal rate
The base case is the average retired couple will more than triple their nest egg, winding up with $1.635 million AFTER withdrawing $1.35 million in inflation-adjusted dividends.
This is the power of ultra-safe high-yield blue-chip investing in a bear market.
Fortunes are born in bear markets.” – Value Investor Todd Sullivan
Bottom Line: These 7 Ultra-Safe High-Yield Retirement Dream Blue-Chips Can Help You Sleep Well At Night In All Economic And Market Conditions
I can’t tell you when this bear market will end or how severe it will be.
| Time Frame |
Historically Average Bear Market Bottom |
| Non-Recessionary Bear Markets Since 1965 |
-21% (Achieved May 20th) |
| Median Recessionary Bear Market Since WWII |
-24% (Citigroup base case) |
| Non-Recessionary Bear Markets Since 1928 |
-26% (Goldman Sachs base case) |
| Bear Markets Since WWII |
-30% (Morgan Stanley base case) |
| Recessionary Bear Markets Since 1965 |
-36% (Bank of America recessionary base case) |
| All 140 Bear Markets Since 1792 | -37% |
| Average Recessionary Bear Market Since 1928 |
-40% (Deutsche Bank, Bridgewater Severe Recessionary base case) |
|
(Sources: Ben Carlson, Bank of America, Oxford Economics, Goldman Sachs) |
That will depend on what the economy does over the next few years.
What I can tell you is that VFC, NVS, CSCO, ALIZY, MMM, EPD, and MO represent seven ultra-safe high-yield rich retirement dream blue-chips you can trust in all economic conditions.
- one of the safest 5.3% yields on earth
- diversified into seven sectors
- average dividend growth streak of 33 years (dividend aristocrat portfolio)
- average credit rating: A-stable (2.5% average 30-year bankruptcy risk)
- 11.8% CAGR long-term consensus total return potential (vs 11.7% over the last 24 years)
- a safe withdrawal rate of at least 5.3% (pure dividend withdrawals)
These blue-chips tend to be less volatile than the market, including falling just 9% in the 2022 bear market so far.
- less than half the 21% decline of the S&P 500
They also offer the average retired couple the opportunity to retire in safety and splendor.
- $1.35 million in base-case dividend income
- while generating an extra $1.1 million in inflation-adjusted capital gains
- 2.64X your investment in ultra-safe and steadily growing income
- plus more than 3X your inflation-adjusted wealth on top
Are you tired of being terrified by every market correction and bear market?
Are you sick of cursing the Fed and fretting about interest rates?
Don’t you wish that you could sleep well at night with 90% statistical certainty that you will achieve your long-term financial goals?
Well, then it’s time to stop gambling and start investing for your long-term future.
Whether you are retired today, or won’t retire for 50 years, the world’s highest quality high-yield blue-chips are ready to help you retire in safety and splendor.
No matter what interest rates, inflation, the economy, or the stock market does in the coming years and decades.
Be the first to comment