


Welcome to the facts.
Maria Vonotna/iStock via Getty Images
I aim to read research that will contradict my views. I want to see how someone reached the opposite conclusion on any investment. In this case, we’ll dismantle the arguments against Equinix (NASDAQ:EQIX). I covered these arguments recently in a slightly more explicit subscriber article on EQIX.
The bearish thesis for EQIX indicates that data centers are growing slower than cloud infrastructure services (that’s fair). However, that’s not enough to support not liking EQIX. Let’s run through the other arguments.
Jim Chanos as a Legendary Investor
Myth 1: Jim Chanos is a legendary investor who wants investors to let him manage their money for bearish bets on the sector.
Counterpoint: In the data center update for subscribers, I went over the Chanos argument and highlighted his record. Here’s a key fact:
Assets under management declined by more than 90% from their highest level. He shorted Tesla (TSLA) as it went up 20x. I will grant that publicly shorting something that goes up 20x should make someone a legend, but not in a good way. He can be bearish without it changing my view.
To be clear, the myths we are dispelling are not attributed to Jim Chanos. They are myths we’ve recently heard elsewhere. We are not disputing that he has a negative outlook. We are disputing the glorification of his investing prowess.
AFFO Growth
Myth 2: EQIX’s growth in AFFO per share was only 3%.
Counterpoint: That’s Q1 2022. It’s one quarter cherry-picked to deliver a lower growth rate. Guidance is calling for 7.3% growth in AFFO per share for 2022 over 2021.
Note: If the annual average is 7.3% and the first quarter is only 3%, what does that tell you about the other three quarters?
Capital Expenditures
Myth 3: EQIX’s recurring capital expenditures dropped to 1.4% of revenues in Q1 2022, down from 5% in Q4 2021.
Counterpoint: Expansion is not part of maintenance capital expenditures, which is the 1.4% value. Bears may believe a reduction in maintenance capex is a reduction in investing, which would be inaccurate.
We can get more details using the EQIX Q1 2022 presentation. That slide even highlighted non-recurring capital expenditures (development spending) as a separate item.

EQIX
You can also see that maintenance capex was only 1.3% of revenue in Q1 2021. I pulled the data for a few years. In 2017 and each year thereafter, maintenance capex was lowest in Q1 and highest in Q4. If a reduction in maintenance capex from Q4 to Q1 was a negative sign, it was a terrible predictor over the last several years.
Management was kind enough to visually separate recurring capital expenditures from the non-recurring ones.
Acquiring Projects
Myth 4: EQIX is unlikely to acquire many new projects unless they issue equity since debt markets are less favorable now.
Counterpoint: EQIX will probably acquire fewer new projects, but we may also see a reduction in construction which would be favorable for supply and demand. Growth for EQIX wasn’t primarily driven by issuing new shares anyway. From Q4 2017 to Q4 2021, shares outstanding only increased by 15.2%. For 4 years, that’s less than a 3% annualized rate. That’s a relatively small amount of equity being issued. Sure, EQIX gets a little boost from accretive acquisitions, but it isn’t a major factor in their performance.
The lack of acquiring many new projects wouldn’t be a material change! Remember, the status quo for EQIX is exceptional growth.
Debt to Equity
Myth 5: EQIX is loaded up heavily on debt. Debt-to-equity is 3.8x.
Counterpoint: What? No. That is really grasping at straws.
To reach a 3.8x debt-to-equity metric, an investor has to use GAAP for an equity REIT. The investor has to use historical depreciated book value for real estate. How can I politely say that using historical depreciated book value is useless?
Imagine you bought a property for $1 million. As the years go by, you depreciate the value to $600k even though the market value is $2 million. You have a mortgage for $480k.
How much leverage are you using? Debt outweighs “equity” $480k to $120k. This appears to be 4.0x leverage (or 400%). This math is completely and utterly useless. The more depreciation you record, the more your “leverage” increases in this bogus method.
If you looked at the market value of $2 million, you’d have $480k to $1,520k. That would put your leverage at 0.315x. This is the relevant value for comparing debt to “equity”. Would you agree that if your leverage was at .315x, your leverage would be low?
You should. That’s how it works. Now we need to return to EQIX.
When measuring EQIX’s assets at market value, the ratio would be significantly lower than 0.315x. This is dramatically below 3.8x debt-to-equity.
For equity REITs, we primarily use net debt to EBITDA.
For EQIX, this was 3.65x. When net debt to EBITDA is 3.65x, that’s a low multiple. This is low leverage. Moody’s gives EQIX a Baa2 rating. S&P gives them a BBB rating.
When a REIT has a BBB rating and someone says the REIT “loads heavily on debt”, it means they don’t understand leverage.
Dividend Payout Ratio
Myth 6: GAAP dividend payout ratio is around 220%. That means the dividend will be cut.
Counterpoint: Let’s use the “Dividend Safety” page from Seeking Alpha’s premium service. It provides payout ratios based on several metrics including using GAAP EPS. That can be useful for some stocks, but not for an equity REIT. You would never use it for an equity REIT.
Instead, you would scroll down a few lines to find the payout ratio based on AFFO. See if you can find it:

Seeking Alpha
Why don’t you use a payout ratio based on GAAP EPS? Mainly because it factors in depreciation as if it was a real cash expense. It’s not. We want to consider the actual cash spent on maintenance.
A payout ratio below 50% is exceptionally low. Of course, these metrics may still not be perfect as they produced a TTM (trailing twelve month) and FWD (forward) payout ratio that were nearly identical despite EQIX guiding for 7.3% growth in AFFO per share. While it isn’t perfect, this tool was vastly superior to using the GAAP payout.
Note: I prefer using REIT/BASE AFFO, which tends to be a bit below consensus analyst AFFO because it uses a slightly different set of adjustments. I believe those adjustments are more useful. However, the payout ratio would still be very low using REIT/BASE AFFO.
A Quick Review
The debt load is actually low. It is among the lowest for equity REITs. The credit ratings from each of the major rating agencies confirm that EQIX is not burdened with high debt levels. When someone incorrectly believes that leverage is high, it doesn’t change the facts.
Using AFFO, the payout ratio was exceptionally low. It’s among the lowest for equity REITs. The dividend risk is very low, because the payout ratio is very low.
If we measure normalized cash flows using AFFO (which we should), then a projected 7.3% growth rate is still strong. It’s slower growth than in some prior years, but it’s still clearly positive. If I may be so bold as to say it, a 7.3% growth rate would be positive by 7.3%. Amazing, I know.
When the debt level is exceptionally low, the payout ratio is low, and the growth rate is still positive (by a significant amount!) there is no reason the company would be forced to cut the dividend.
Our Outlook
Here’s our recent index card, which shows our position and outlook:
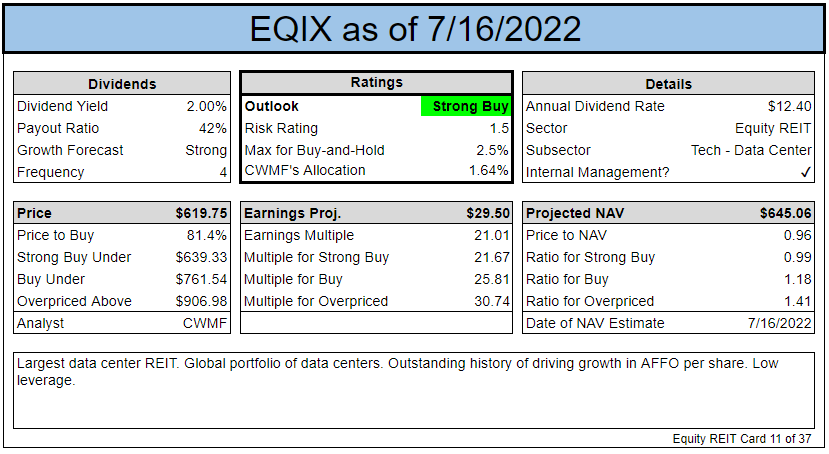
The REIT Forum
Using multiples of AFFO per share, EQIX looks unusually cheap:

TIKR.com
While the AFFO multiple has shown some volatility, the estimates for AFFO per share have a pretty clear trend. See if you can spot it:
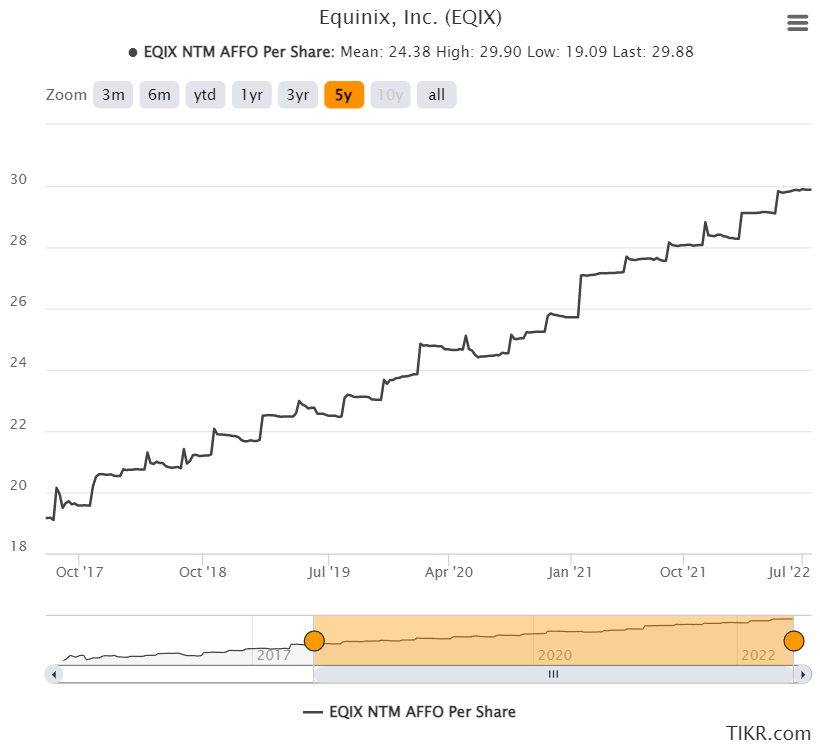
TIKR.com
Does that look like a business that is dying? They rarely go out at all-time highs.
We can also use price-to-NAV (Net Asset Value). It’s pretty clear EQIX usually trades above NAV:
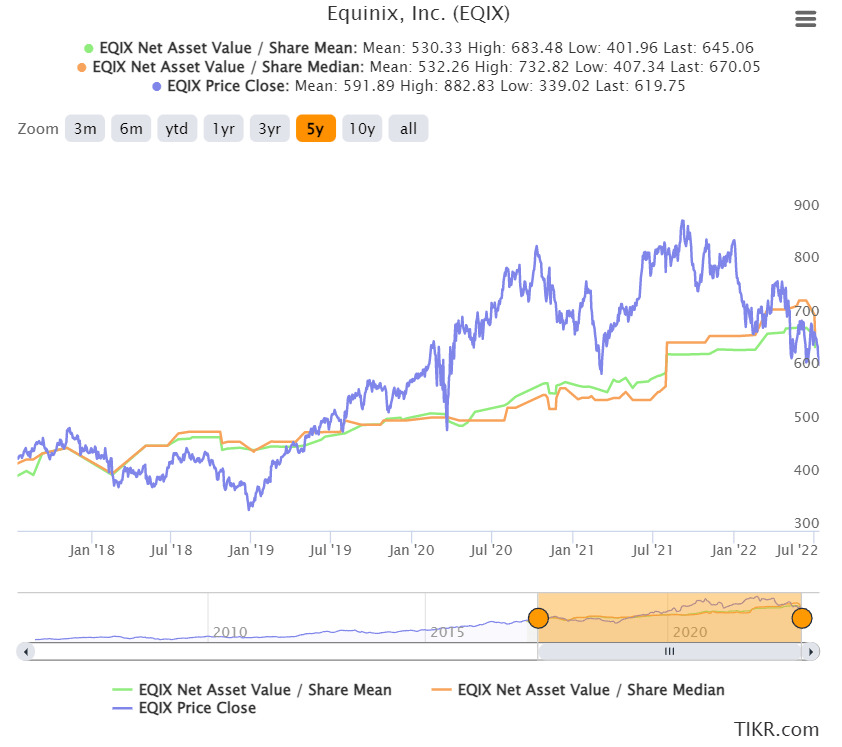
TIKR.com
However, you may see that the median and mean estimates both drop at the start of July. Did analysts just drop their ratings significantly? No, there were 5 analysts providing estimates and now there are 4. For a REIT this large, there should be more estimates, but there are not. Having one analyst removed from the sample moved the average and the median.
I don’t know by name, but you can spot them in the next chart. I removed the mean estimate and replaced it with the low estimate (which is the lowest estimate within the group):
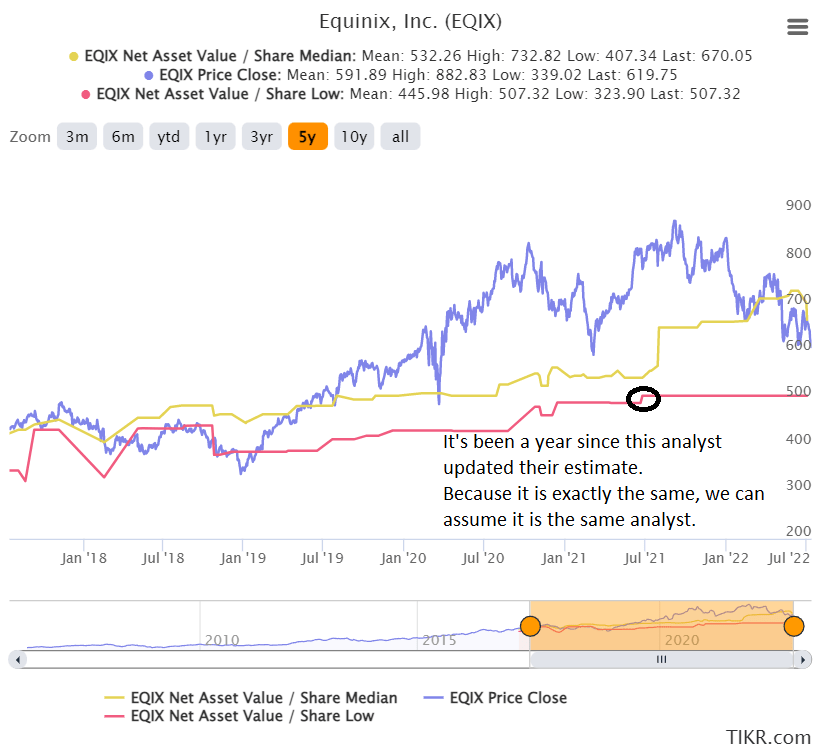
TIKR.com
It’s possible that in 2019 and 2020 there were different analysts with the lowest estimate. Perhaps not likely, but at least possible. The lowest estimate was updated about a year ago and barely updated at that (only slightly moved). In a sample size of 4 to 6 analysts (it varies), one awful estimate can drag the average materially.
Note: With 5 analysts the median is the third highest estimate. With 4 analysts the median is the average of the second and third highest estimates.
Wrapping Up
We see a REIT with a strong history of growing AFFO per share, guidance for continued growth in AFFO per share, and consistent growth in NAV per share. That’s a much better argument than calculating leverage and payout ratios using the wrong metrics. Growth of 7.3% refutes the idea of cash flows slowing, because when something increases by 7.3% it becomes larger. That’s clear, right?
Be the first to comment