

Deagreez
Stagflation is here, with US growth slowing and inflation still at 40-year highs.
Daily Shot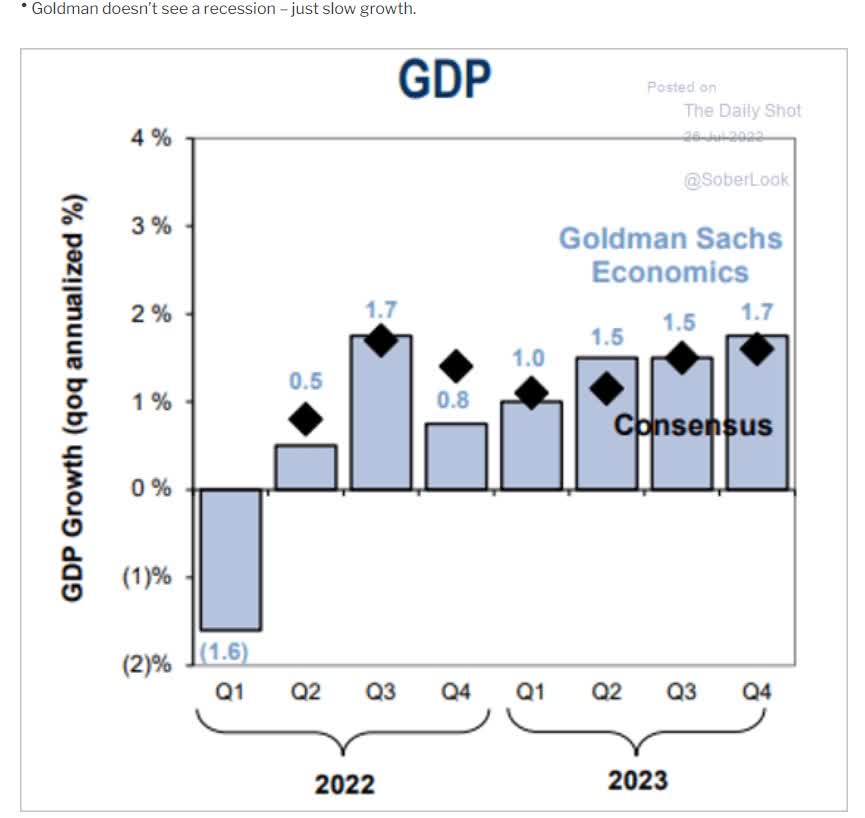
Growth estimates are falling fast, and the bond market is now pricing in a likely recession at the start of 2023.
Daily Shot 
The good news is that the blue-chip economist consensus, the 16 most accurate economist teams in the world, think that inflation will fall rapidly next year.
The bad news? The Cleveland Fed’s daily inflation forecasting model still expects high inflation to persist for several months.
Cleveland Federal Reserve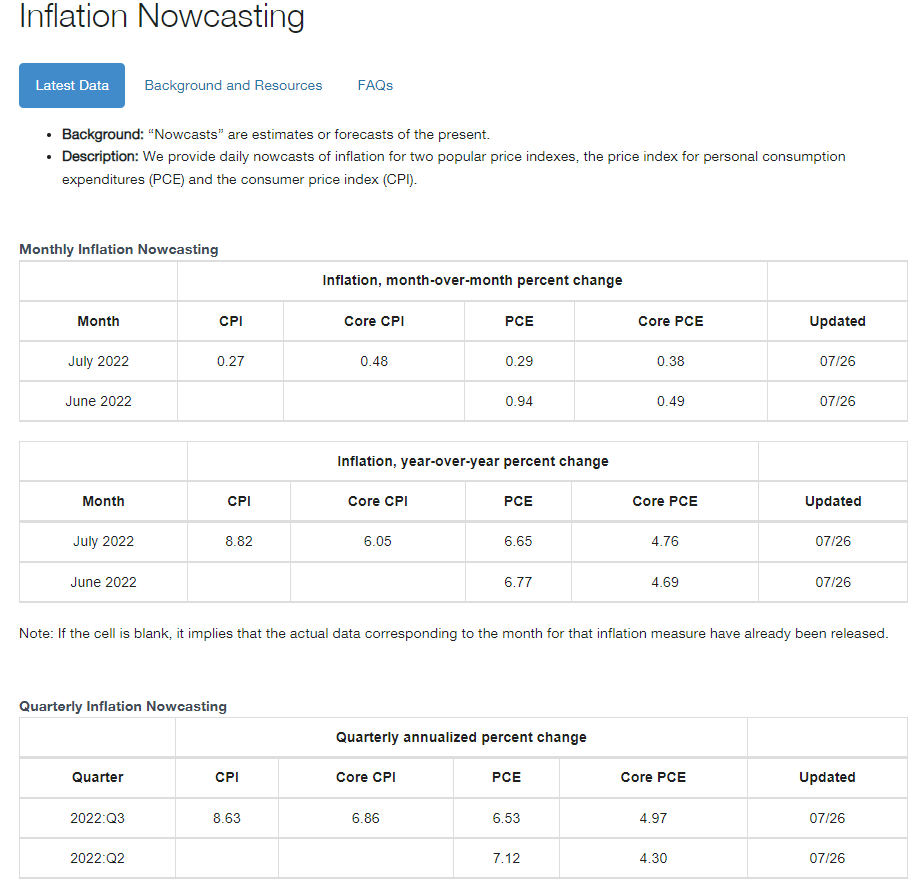
The Cleveland Fed’s model estimates that core PCE, the Fed’s favorite inflation metric, will show slightly accelerating core inflation of 4.8% in the July report in early August.
But haven’t economists been wrong for two years about inflation? Indeed they have been. And isn’t it possible that they might be wrong that inflation will fall rapidly? It’s very possible. Research Affiliates think inflation hasn’t peaked yet and might not peak until the end of the year or even early 2023.
Why? Simple math.
| Month | CPI YOY Growth |
| July 2021 | 5.4% |
| August 2021 | 5.3% |
| September 2021 | 5.4% |
| October 2021 | 6.2% |
| November 2021 | 6.8% |
| December 2021 | 7.0% |
| January 2022 | 7.5% |
| February 2022 | 7.9% |
(Source: Bureau Of Labor Statistics)
Research Affiliates believe that as long as the new month’s inflation is above last year’s, base effects mean that we’re replacing a lower inflation month with a higher inflation month.
One would assume that the world’s best economists would have mastered such simple spreadsheet math and account for this in their estimates. But then again, maybe not.
So how long might it take for inflation to peak if RA is right? Based on some economist forecasts such as UBS (UBS) and Kiplinger, who are estimating 8% inflation by the end of the year, inflation might not peak until the end of the year or even not until February 2023.
How high could it rise? The producer price index, or PPI, is a good rule of thumb for where CPI is going, representing wholesale inflation that companies want to pass onto customers if they can.
PPI was 11.1% in June and 10% to 11% is where RA thinks inflation is headed before peaking in the coming months.
But don’t despair, because the bond market is pretty confident that sky-high inflation isn’t here to stay.
Ycharts
The bond market is pricing in 2.1% to 2.8% inflation over the long-term, not far from the Fed’s 2% long-term target.
But there are reasons to be concerned about potentially higher prices for longer, which is why Blackstone (BX) thinks that the Fed might have to hike as high as 5% to tame inflation.
My own view is the Fed funds rate could exceed 4%. I think they could go above 4.5%, maybe even closer to 5%,” Joseph Zidle, chief investment strategist in Blackstone’s Private Wealth Solutions group, said in a Bloomberg Television interview and in emailed comments.” – Yahoo Finance
The bond market is currently pricing in a peak of 3.25% or 3.5% Fed funds rate by the end of the year, and then the Fed starting to cut to offset slower growth by mid-2023.
CME Group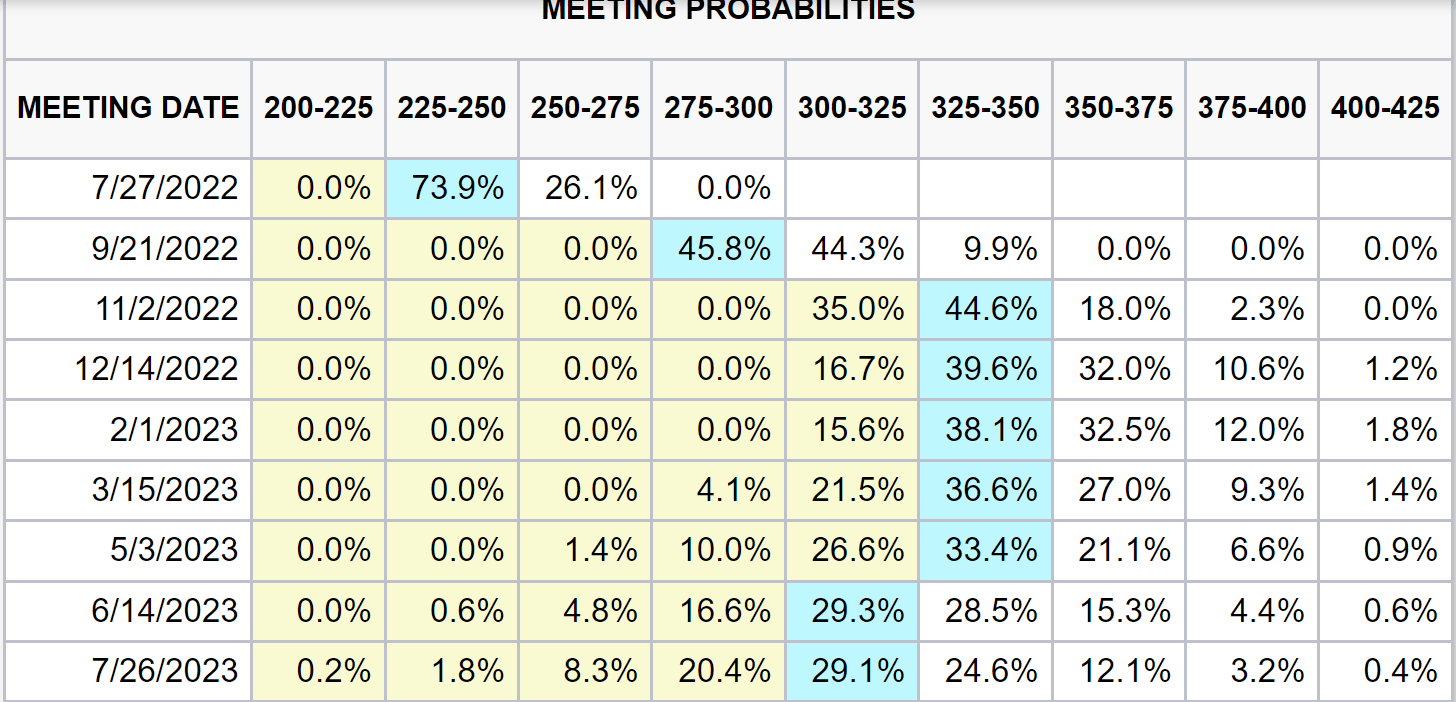
However, plenty of reputable economists think the Fed might have to hike more aggressively, even if it means a recession.
- St. Louis Fed president Bullard thinks the Fed might need to hit 4% by year-end.
- Citigroup thinks the Fed will hike to 4% by year-end
- Blackstone thinks 5% is on the table next year
- Bridgewater (the world’s largest hedge fund) thinks 5% to 6% is necessary to beat inflation.
- Deutsche Bank thinks 5% to 6% might be necessary to beat inflation.
The stock market isn’t ready for the Fed to hike to 4%, much less 5% or 6%. If the Fed has to go this high, the risk of a severe stagflationary recession rises significantly, according to Societe General and UBS.
- Soc Gen’s worst-case bear market scenario is a 48% peak decline in the S&P (a 37% further decline)
- UBS’ worst-case bear market scenario is a 52% peak decline (a 42% further decline)
My goal isn’t to terrify you because these are worst-case scenarios, not what’s likely to happen. However, avoiding becoming a forced seller for financial or emotional reasons is priority #1 for anyone who wants to achieve investing success.
So this article is meant to prepare you, emotionally and financially, for the possibility that inflation hasn’t peaked and might not for several more months.
What if the Fed is forced to hike to 4% or higher? What if inflation proves stickier than expected right now? What if stagflation worsens and becomes a full blown recession?
Stagflation Beating High-Yield Dividend Aristocrats To The Rescue
This article shows exactly why dividend growth investing and reinvesting dividends is the easiest and most effective way to grow your wealth over time.
- Dividends magnified the S&P’s returns 33X since 1930
Dividends aren’t just wonderful because they can help you double compound.
- each share pays exponentially growing dividends
- dividends are invested into exponentially more shares
- it works especially well in bear markets and for high-yield blue-chips
They are a way your companies pay you to be patient and let your skilled and adaptable management teams work hard for you so that one day you don’t have to.
Do you know the only thing that gives me pleasure? It’s to see my dividends coming in.” – John D. Rockefeller
And do you know what’s even better than safe dividends in a recession? Steadily growing dividends, such as what the dividend aristocrats offer.
- companies with 25+ year dividend growth streaks
- every year since 1997
- through three recessions
- five bear markets
- three market crashes
- dozens of corrections and pullbacks
If we are headed for prolonged stagflation then high-yield aristocrats are a great place to start looking for sleep well at night blue-chips to see you through whatever might be coming next.
But should we just buy any high-yield aristocrats? Some sectors perform especially well during stagflation.
Daily Shot 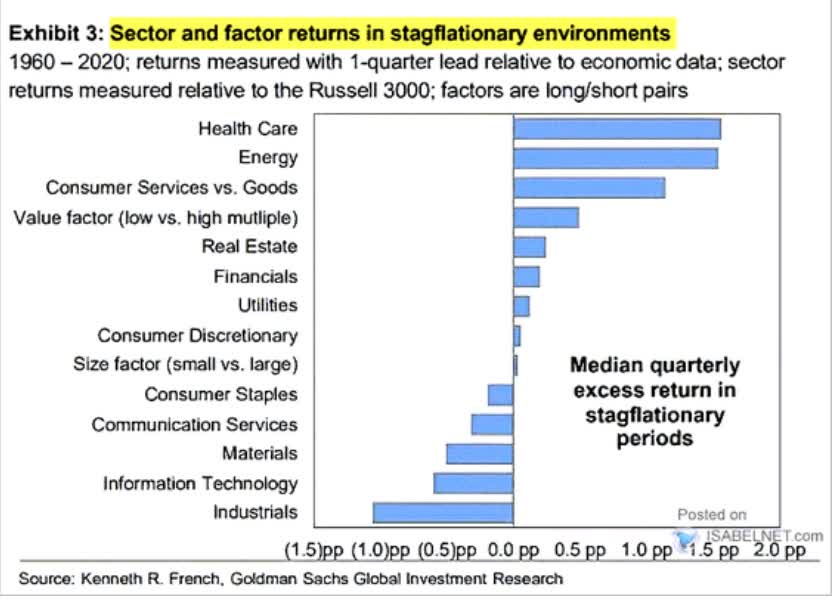
Historically, during stagflationary periods since 1960, healthcare, energy, low P/E, real estate, financials, and utilities tend to outperform the market.
So let me show you how to easily and quickly find the best stagflation-beating high-yield aristocrats you can buy today.
How To Find The Best Stagflation Beating High-Yield Aristocrats In 3 Minutes
Using the Dividend Kings Zen Research Terminal, here is how I was able to find these six high-yield, stagflation-resistant aristocrats in two minutes.
The terminal runs on the DK 500 Master List, one of the world’s best watchlists, including
- every dividend aristocrat (S&P companies with 25+ year dividend growth streaks)
- every dividend champion (every company, including foreign, with 25+ year dividend growth streaks)
- every dividend king (every company with 50+ year dividend growth streaks)
- every foreign aristocrat (every company with 20+ year dividend growth streaks)
- every Ultra SWAN (wide moat aristocrats, as close to perfect quality companies as exist)
- 40 of the world’s best growth stocks
I applied the following screen to find these amazing stagflation sleep well at night bargains.
- Potential good buy or reasonable buy (never knowingly overpay for a company) – 317 companies remain
- dividend champions (any company with a 25+ year streak, including foreign ones) – 78 aristocrats companies remain
- select for Stagflation-resistant sectors: (healthcare, energy, REIT, utilities, finance) – 31 stagflation-resistant aristocrats remain
- 3+% yield – 22 stagflation-resistant aristocrats remain
- 10+% long-term return potential (similar to what analysts expect from the S&P 500 over the long-term) – 12 stagflation-resistant aristocrats remain
- 81+ dividend safety score (2% or less severe recession cut risk, 0.5% average recession cut risk) – 9 stagflation-resistant aristocrats remain
- sort by lowest P/E to find the low P/E high-yield aristocrat
- use the watchlist creation function to select just these six stagflation-resistant high-yield aristocrats
- total time: 3 minutes
6 Stagflation Beating High-Yield Dividend Aristocrat Bargains
(Source: Dividend Kings Zen Research Terminal)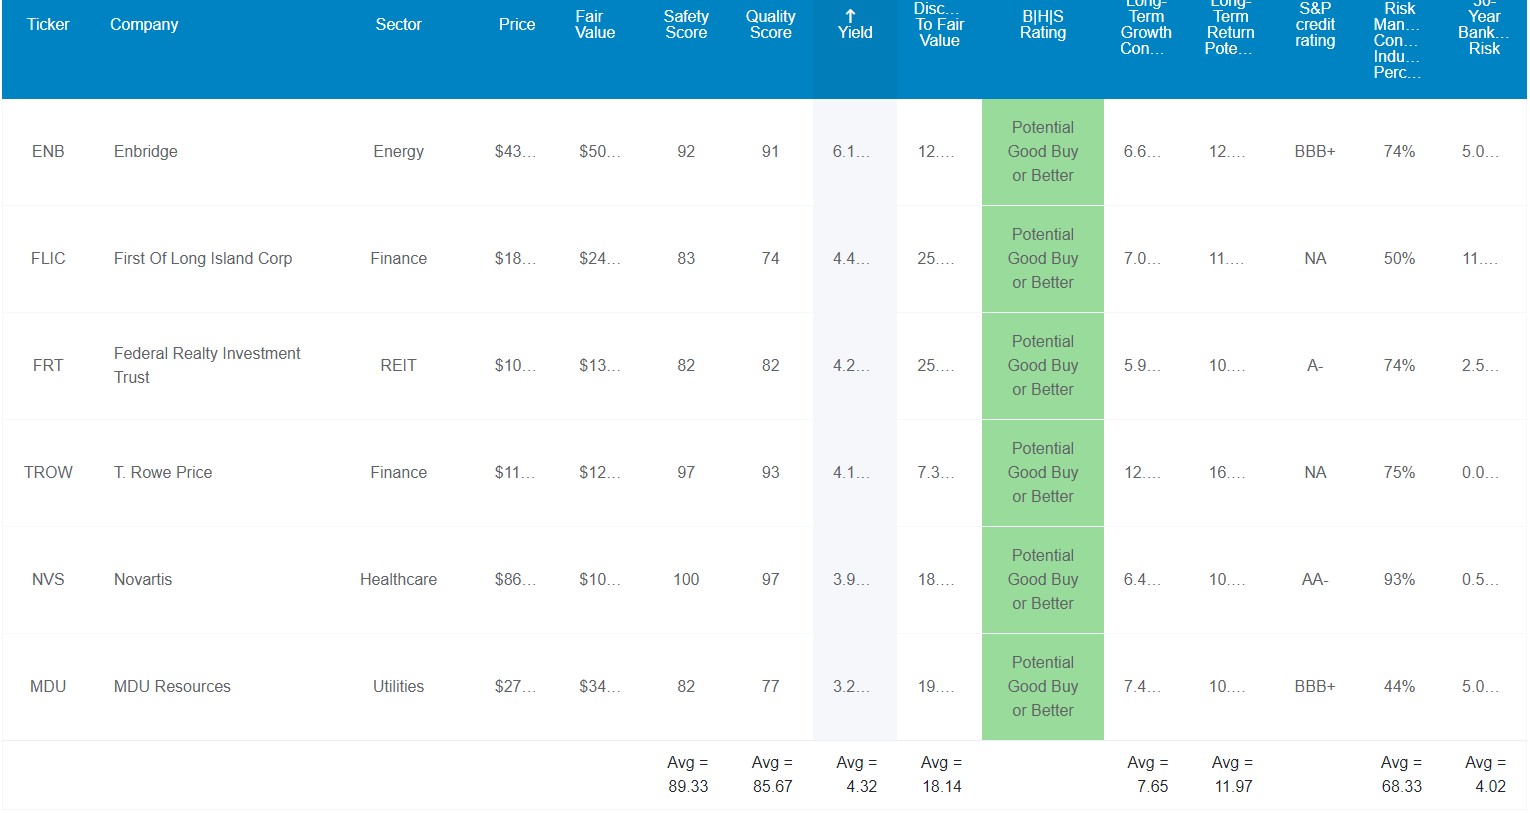
I’ve linked to articles providing more information about each company’s investment thesis, growth prospects, risk profile, valuation, and return potential.
FAST Graphs Up Front
Enbridge 2024 Consensus Return Potential
(Source: FAST Graphs, FactSet Research)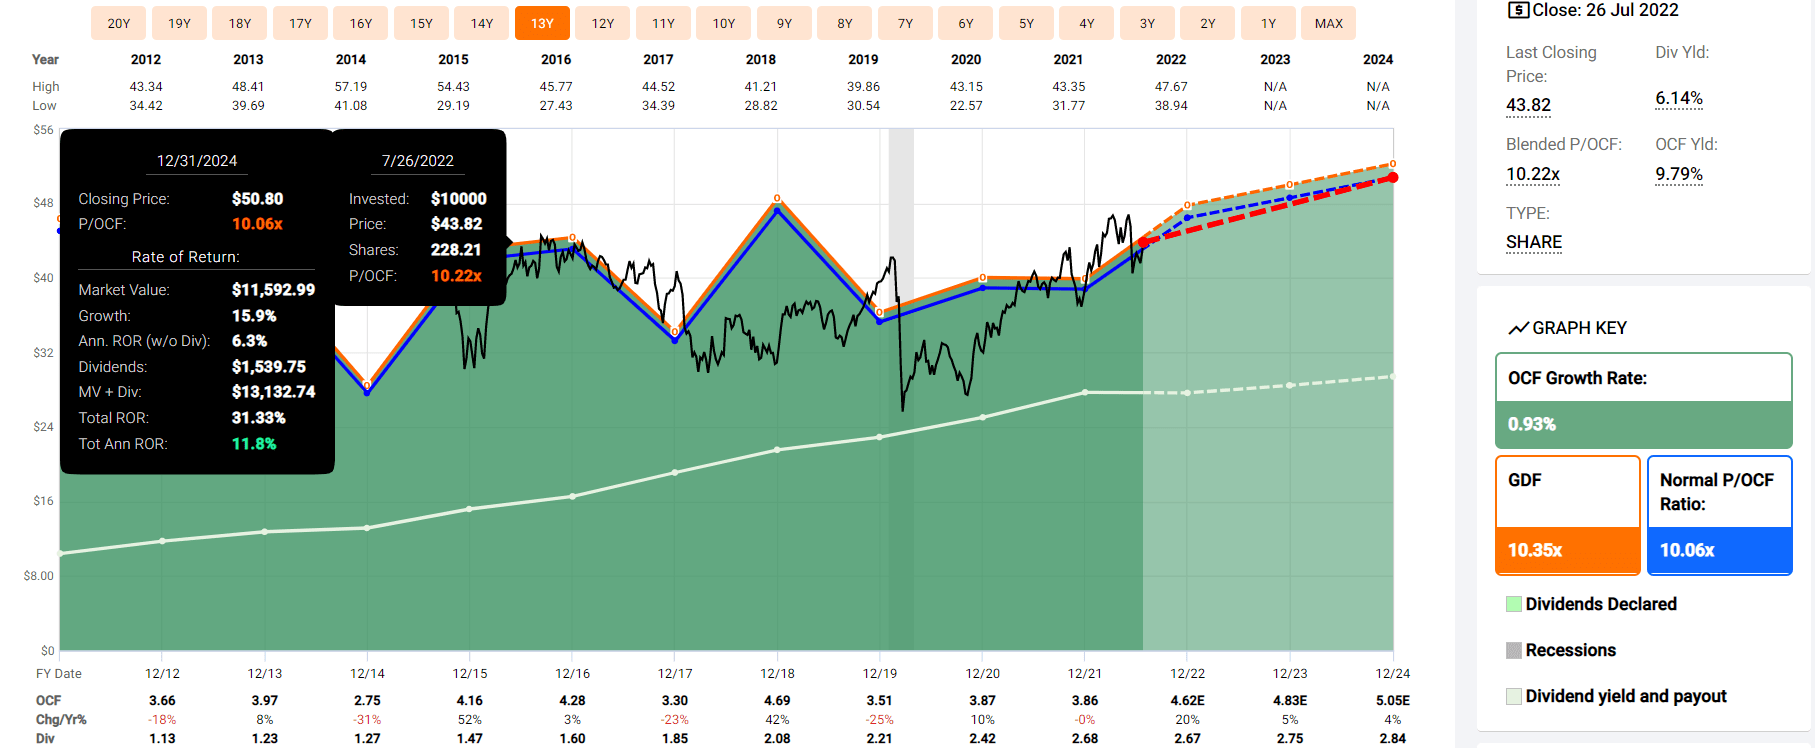
First Of Long Island Corp 2024 Consensus Return Potential
(Source: FAST Graphs, FactSet Research)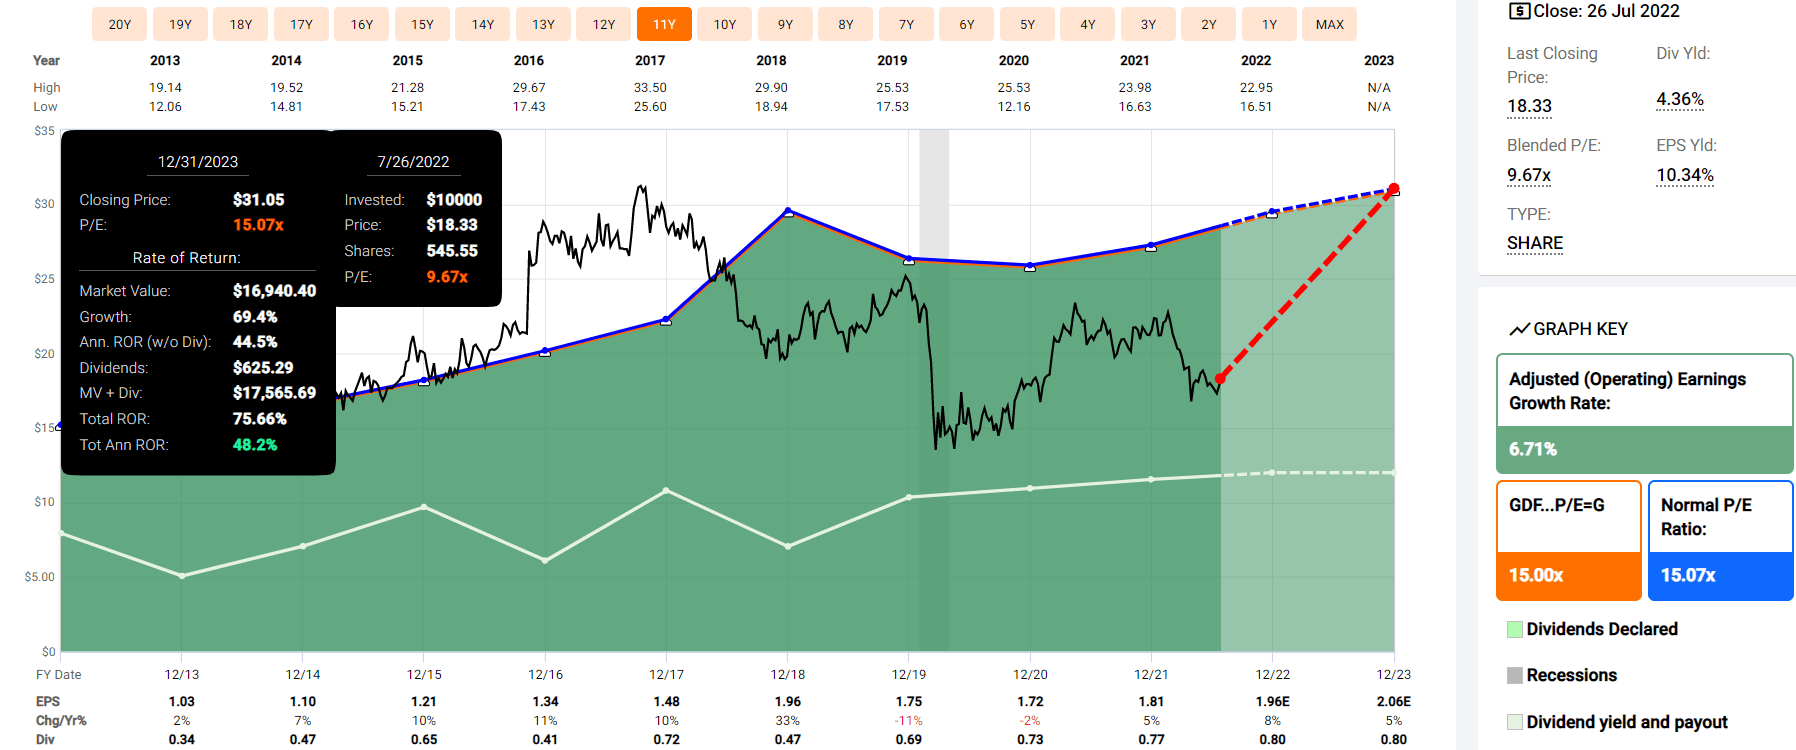
Federal Realty Investment Trust 2024 Consensus Return Potential
(Source: FAST Graphs, FactSet Research)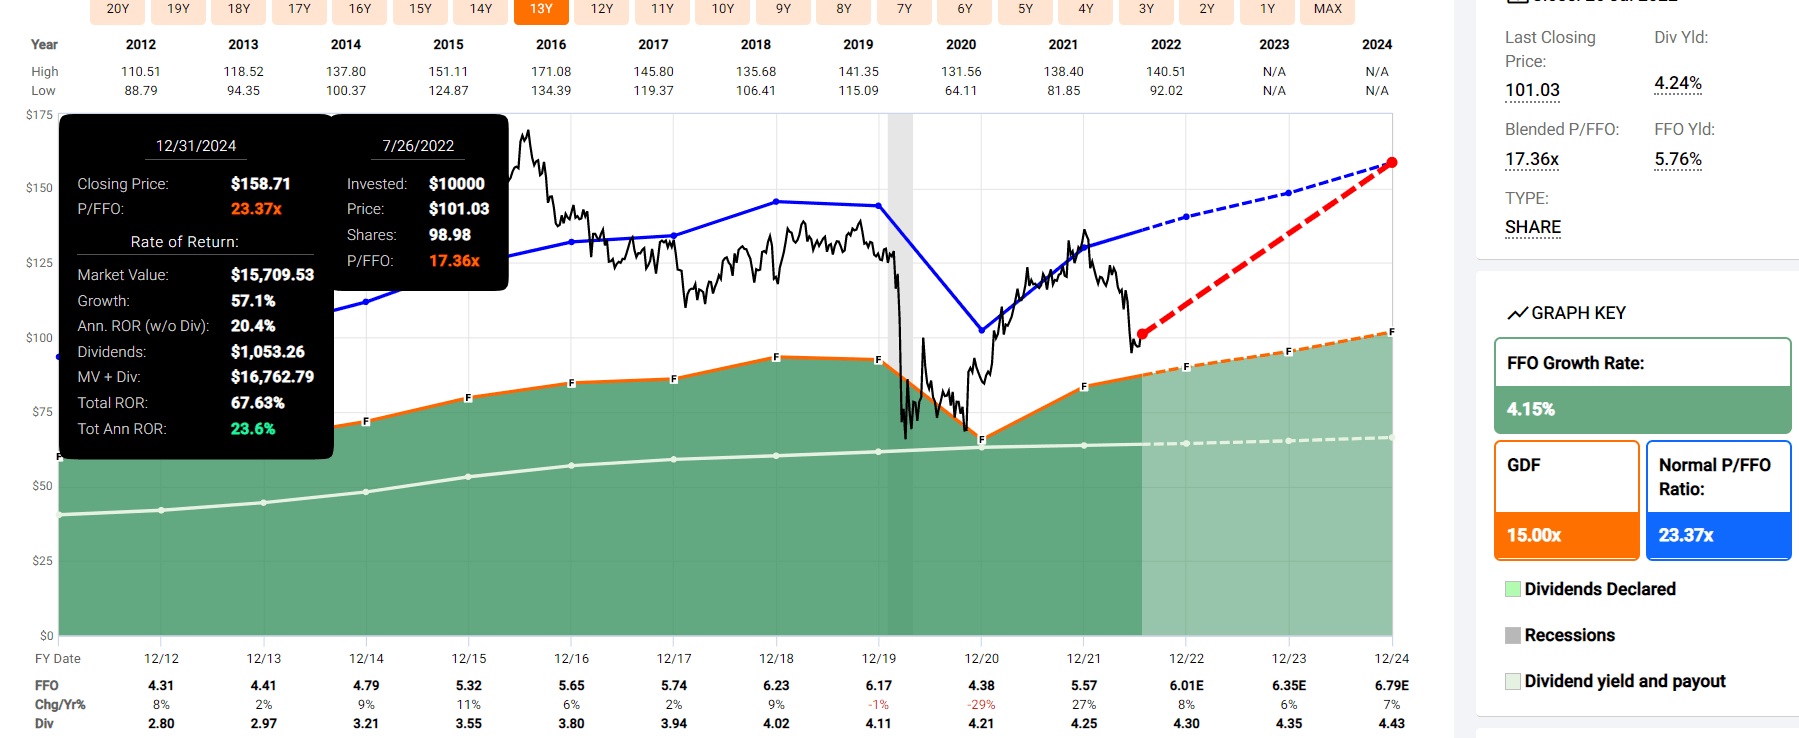
T. Rowe Price 2024 Consensus Return Potential
(Source: FAST Graphs, FactSet Research)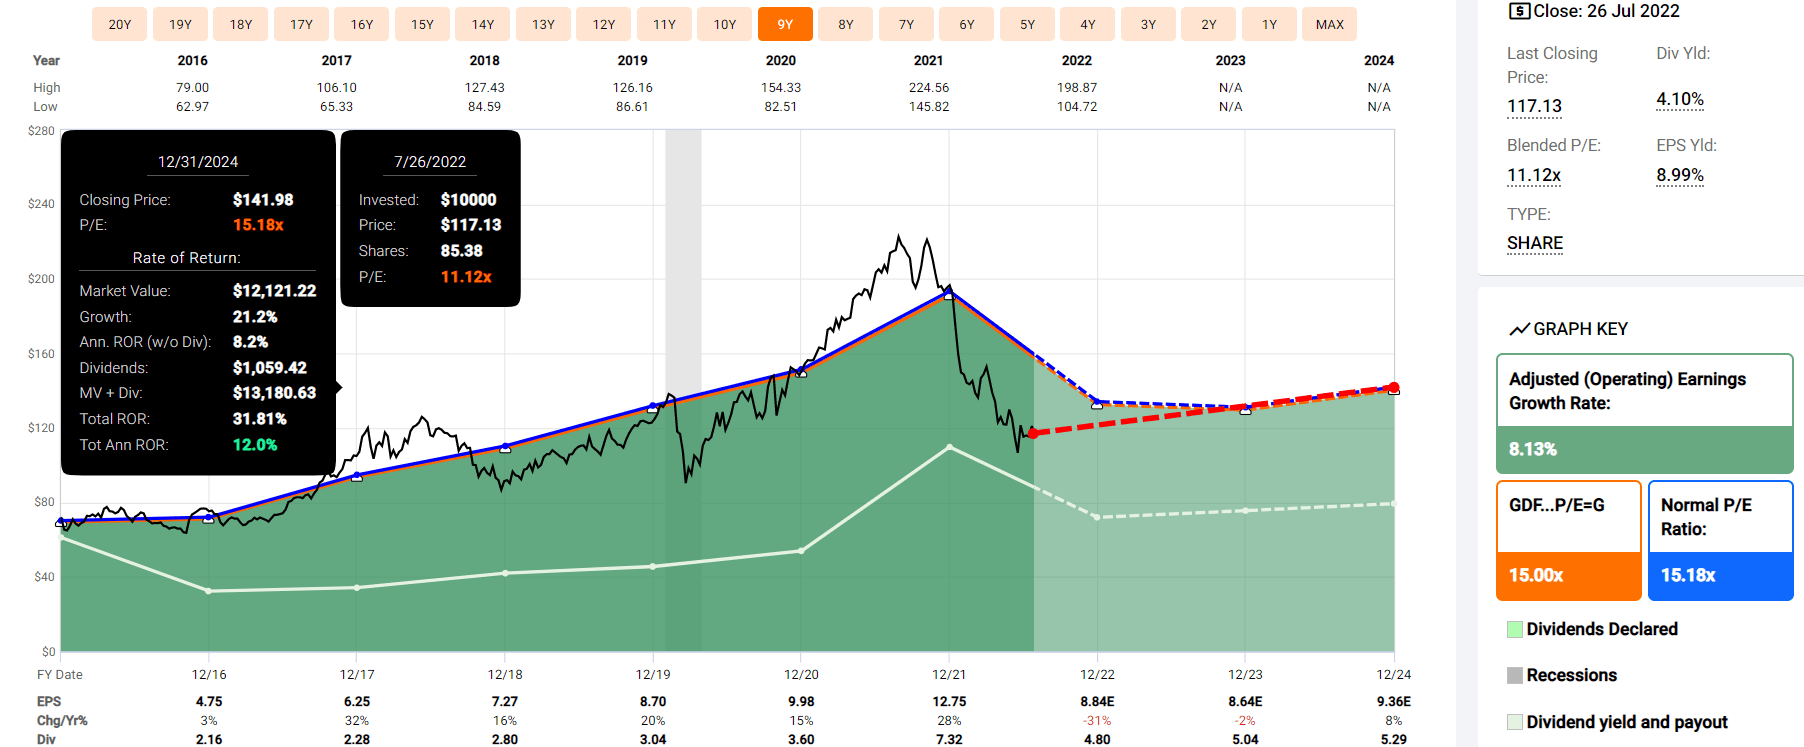
Novartis 2024 Consensus Return Potential
(Source: FAST Graphs, FactSet Research)
MDU Resources 2024 Consensus Return Potential
(Source: FAST Graphs, FactSet Research)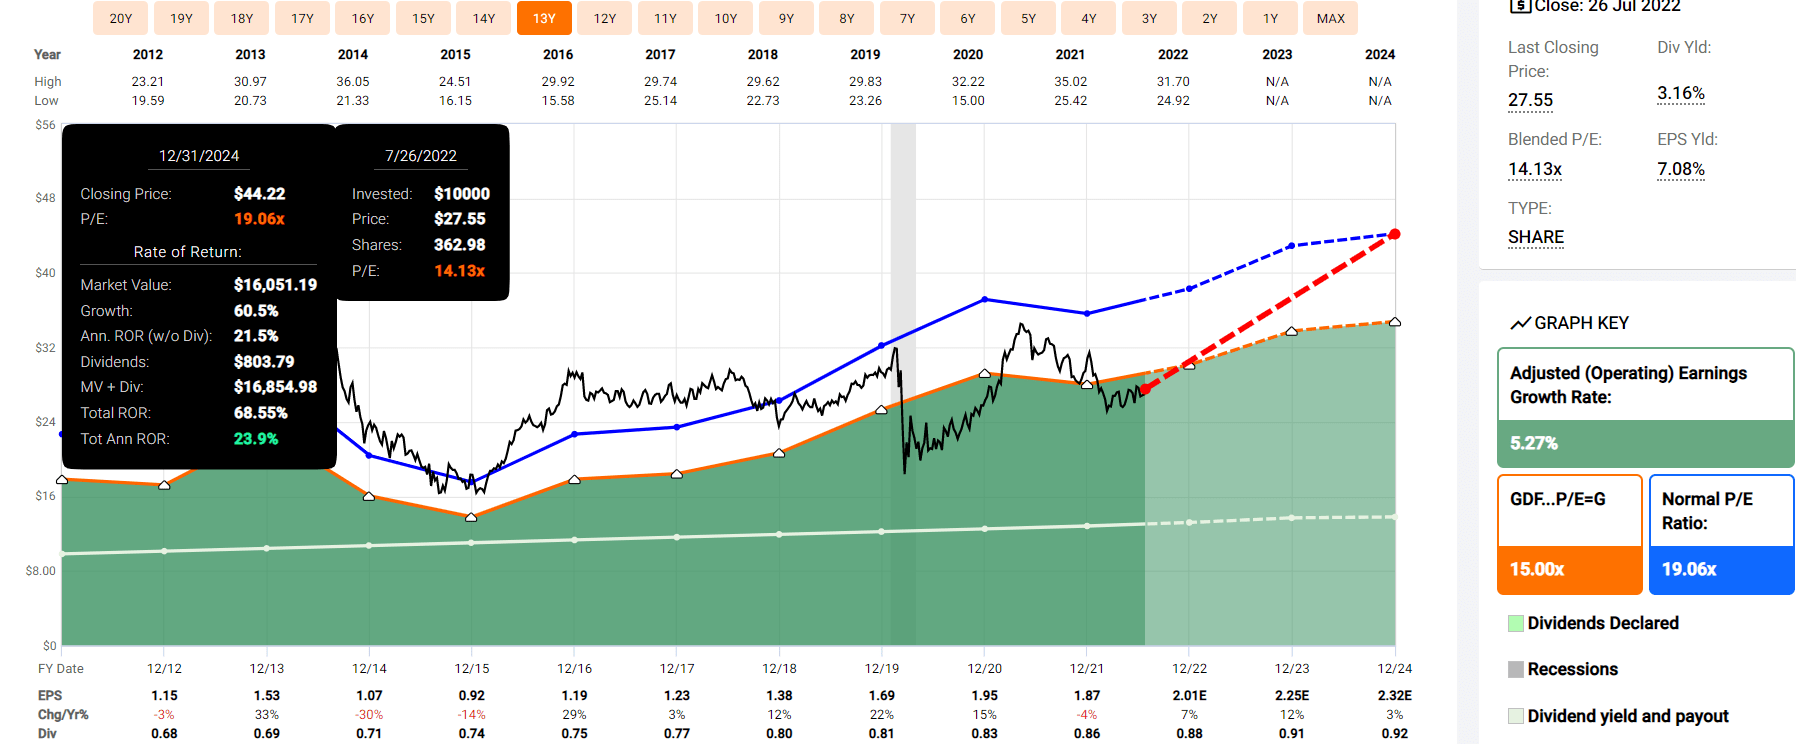
S&P 2024 Consensus Total Return Potential
(Source: FAST Graphs, FactSet Research)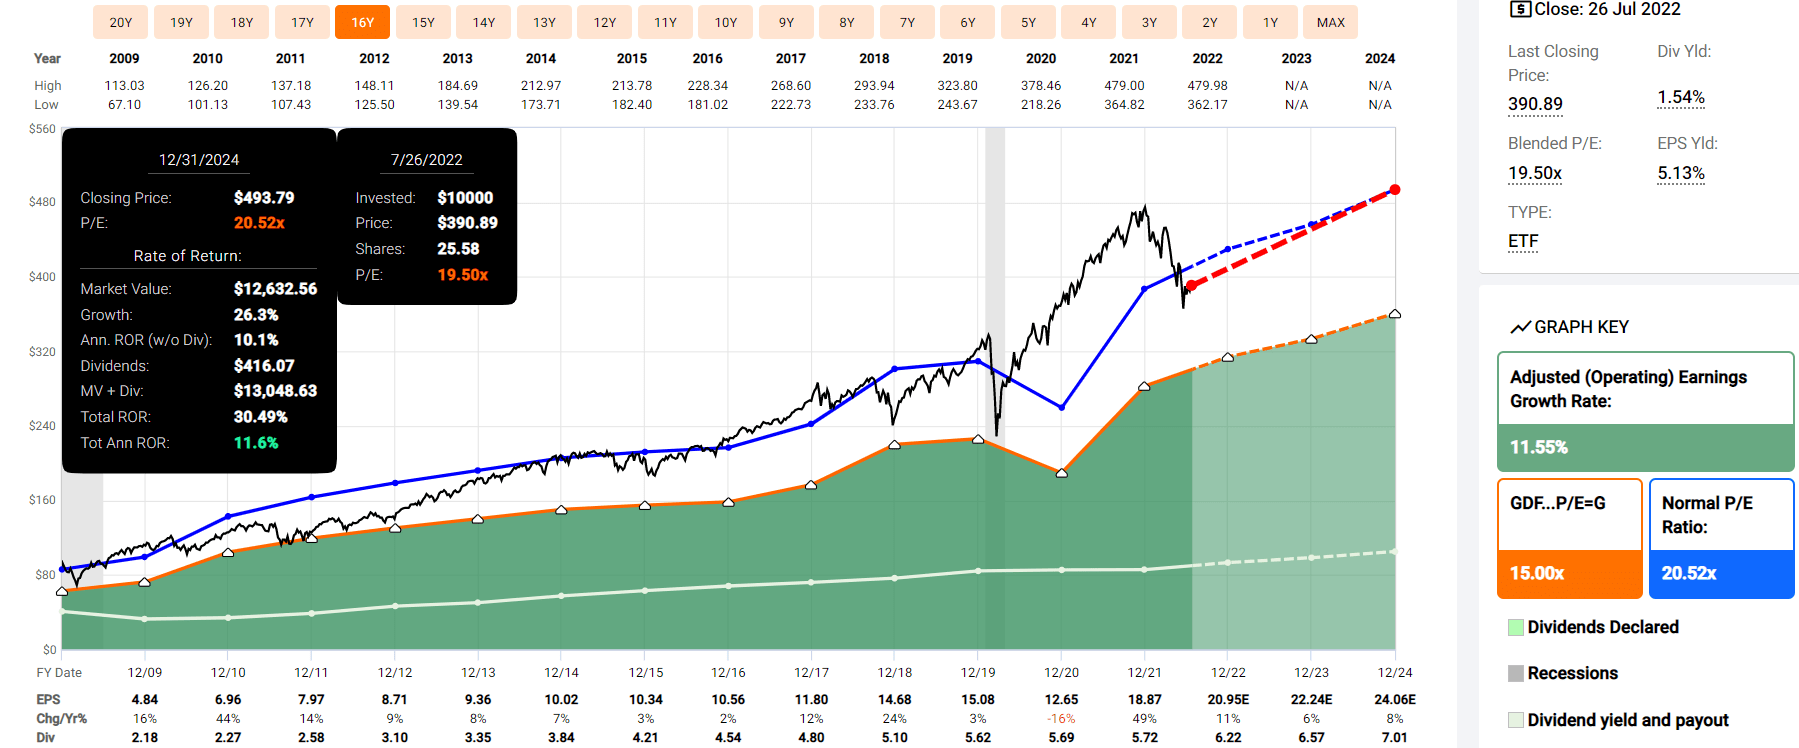
Analysts expect about 12% annual returns through 2024 from the S&P 500.
- they expect 23.5% CAGR total returns from these high-yield aristocrats
- Buffett-like return potential from stagflation-resistant blue-chip bargains hiding in plain sight
Some Of The World Best High-Yield Blue-Chips
(Source: Dividend Kings Zen Research Terminal)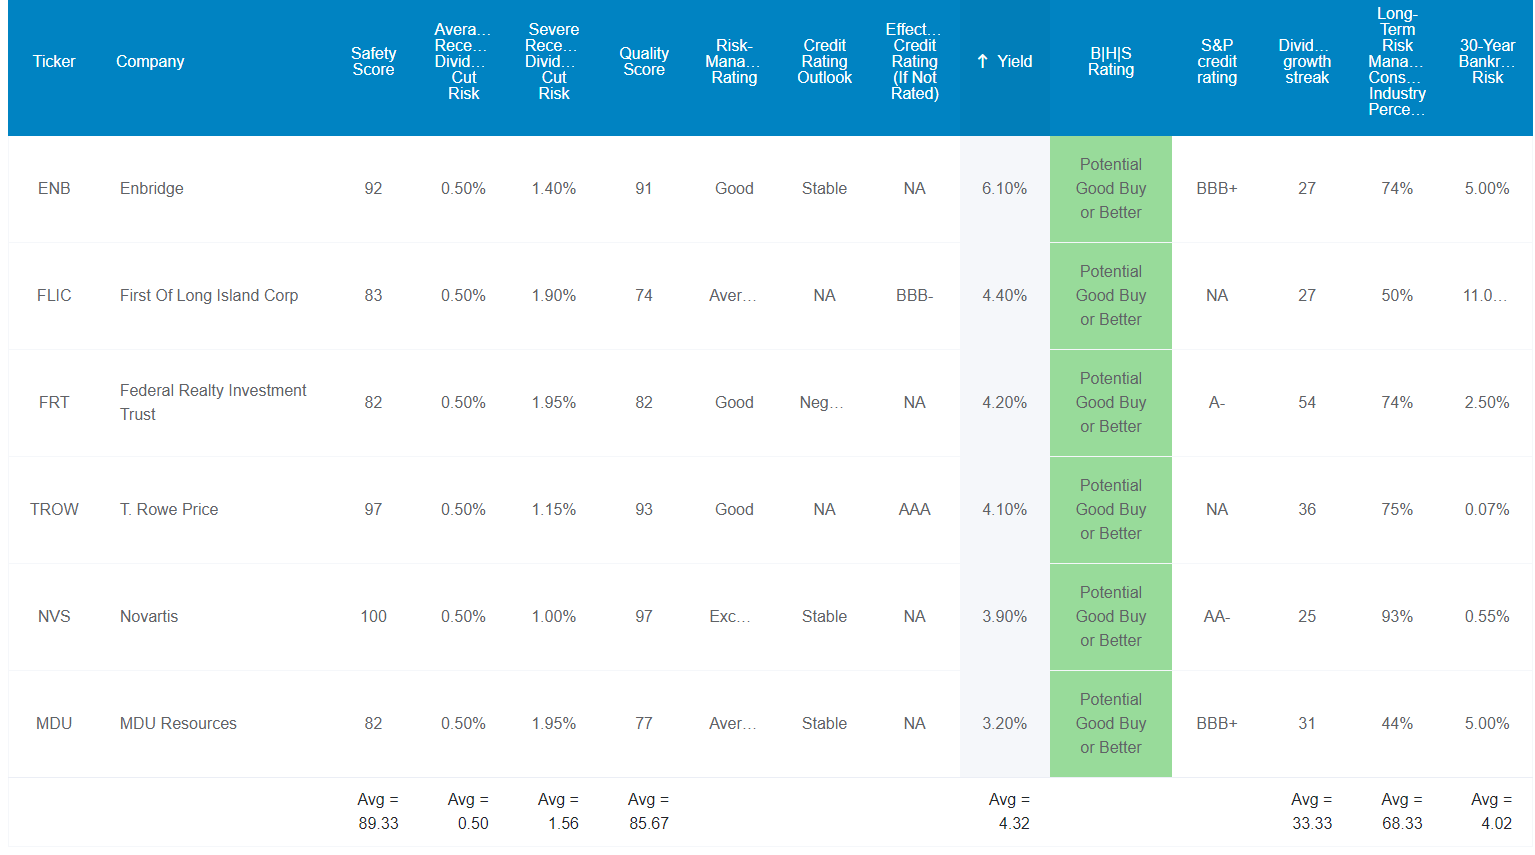
These aren’t just sleep well at night blue-chips they are Super SWAN quality aristocrats that can be depended on in all economic conditions, even stagflationary periods. How can we tell? By comparing them to the dividend aristocrats, the bluest of blue-chips and the most dependable dividend growers on earth.
Higher Quality Than The Dividend Aristocrats
| Metric | Dividend Aristocrats | 6 Stagflation Beating High-Yield Dividend Aristocrats | Winner Dividend Aristocrats |
Winner 6 Stagflation Beating High-Yield Dividend Aristocrats |
| Quality | 87% | 86% | 1 | |
| Safety | 89% | 89% | 1 | 1 |
| Average Recession Dividend Cut Risk | 0.5% | 0.5% | 1 | 1 |
| Severe Recession Dividend Cut Risk | 1.6% | 1.6% | 1 | 1 |
| Dependability | 84% | 84% | 1 | 1 |
| Dividend Growth Streak (Years) | 44.8 | 33.3 | 1 | |
| Long-Term Risk Management Industry Percentile | 67% Above-Average |
68% Above-Average |
1 | |
| Average Credit Rating | A- Stable | BBB+ Stable | 1 | |
| Average Bankruptcy Risk | 3.04% | 4.02% | 1 | |
| Average Return On Capital | 100% | 442% | 1 | |
| Average ROC Industry Percentile | 83% | 84% | 1 | |
| 13-Year Median ROC | 89% | 145% | 1 | |
| Forward PE | 19.3 | 12.9 | 1 | |
| Discount To Fair Value | 4.3% | 18.1% | 1 | |
| DK Rating | Reasonable Buy | Good Buy | 1 | |
| Yield | 2.5% | 4.3% | 1 | |
| LT Growth Consensus | 8.6% | 7.7% | 1 | |
| Total Return Potential | 11.1% | 12.0% | 1 | |
| Risk-Adjusted Expected Return | 7.5% | 8.0% | 1 | |
| Inflation & Risk-Adjusted Expected Return | 5.1% | 5.6% | 1 | |
| Years To Double | 14.2 | 12.9 | 1 | 1 |
| Total | 10 | 16 |
(Source: DK Zen Research Terminal)
On most quality metrics, these stagflation-beating aristocrats run neck and neck with the average aristocrat.
- virtually identical safety and quality, and dependability
- 0.5% average recession dividend cut risk
- 1.6% severe recession dividend cut risk
Ben Graham considered a 20+ year track record of uninterrupted dividends an important sign of quality, and 20+ year dividend growth streak a sign of excellence.
These aristocrats average a 33-year dividend growth streak.
Joel Greenblatt considers return on capital or ROC his gold standard proxy for quality and moatiness.
- Greenblatt achieved 40% CAGR returns for 21 years buying undervalued companies with high ROC
- ROC = annual pre-tax profit/the cost of running the business
The aristocrats average a remarkable 100% ROC over the last year, 7X the S&P 500’s 14.6%.
These aristocrats average 442% ROC, 4.4X higher than the aristocrats and 30X more than the S&P 500.
S&P estimates their average 30-year bankruptcy risk (Buffett’s definition of fundamental risk) at 4.0%, slightly more than the aristocrat’s 3.0%
- a BBB+ stable rated portfolio
Six rating agencies estimate these aristocrats’ long-term risk management in the 68th percentile of their respective industries, just slightly better than the aristocrats.
- Management teams and corporate cultures you can trust to adapt and overcome any challenge, such as stagflation
So now that you see why these Stagflation beating super swan aristocrats are names you can trust, here’s why you might want to buy them today.
Wonderful Companies At Wonderful Prices
(Source: Dividend Kings Zen Research Terminal)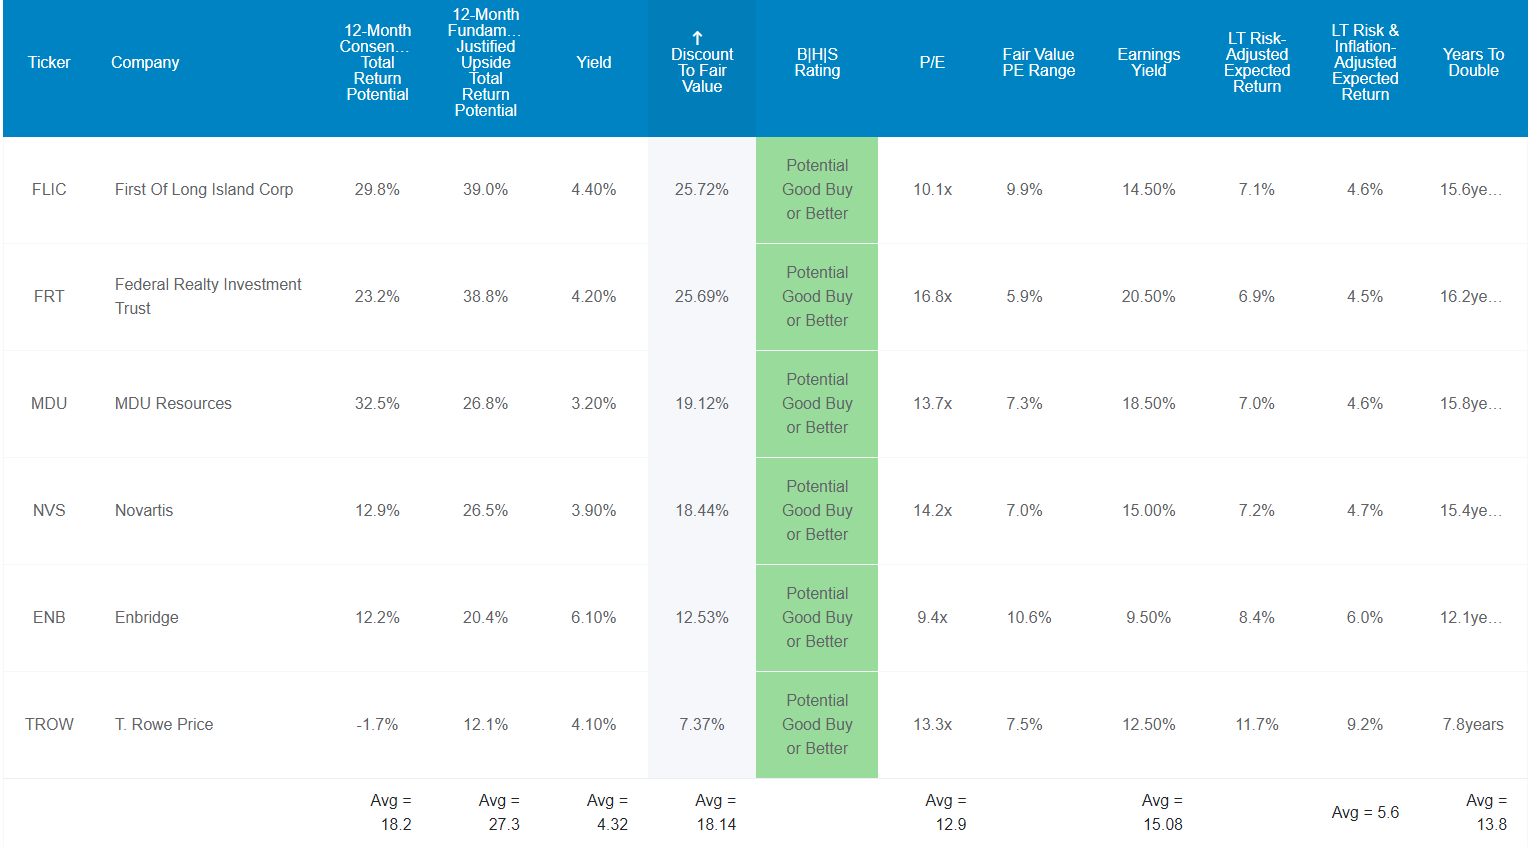
The S&P 500 is trading at a forward P/E of 16.6, a 1% historical discount.
The aristocrats trade at 19.3X earnings, a 4% historical discount.
These stagflation beating Super SWAN aristocrats trade at 12.9X earnings, an 18% historical discount.
Analysts expect them to deliver 18% total returns in the next 12 months, but their fundamentally justified 12-month total return potential is 27%.
- If all of them grow as expected and return to historical mid-range market-determined fair value, you would earn 27% total returns within 12 months.
But my goal isn’t to help you earn an 18% 12-month or even a 27% return. My goal is to help you achieve life-changing wealth, like a 15X inflation-adjusted return over the next 30 years.
That’s what analysts think these aristocrats can do, and here’s why.
Long-Term Return Potential That Can Help You Retire In Safety And Splendor
(Source: Dividend Kings Zen Research Terminal)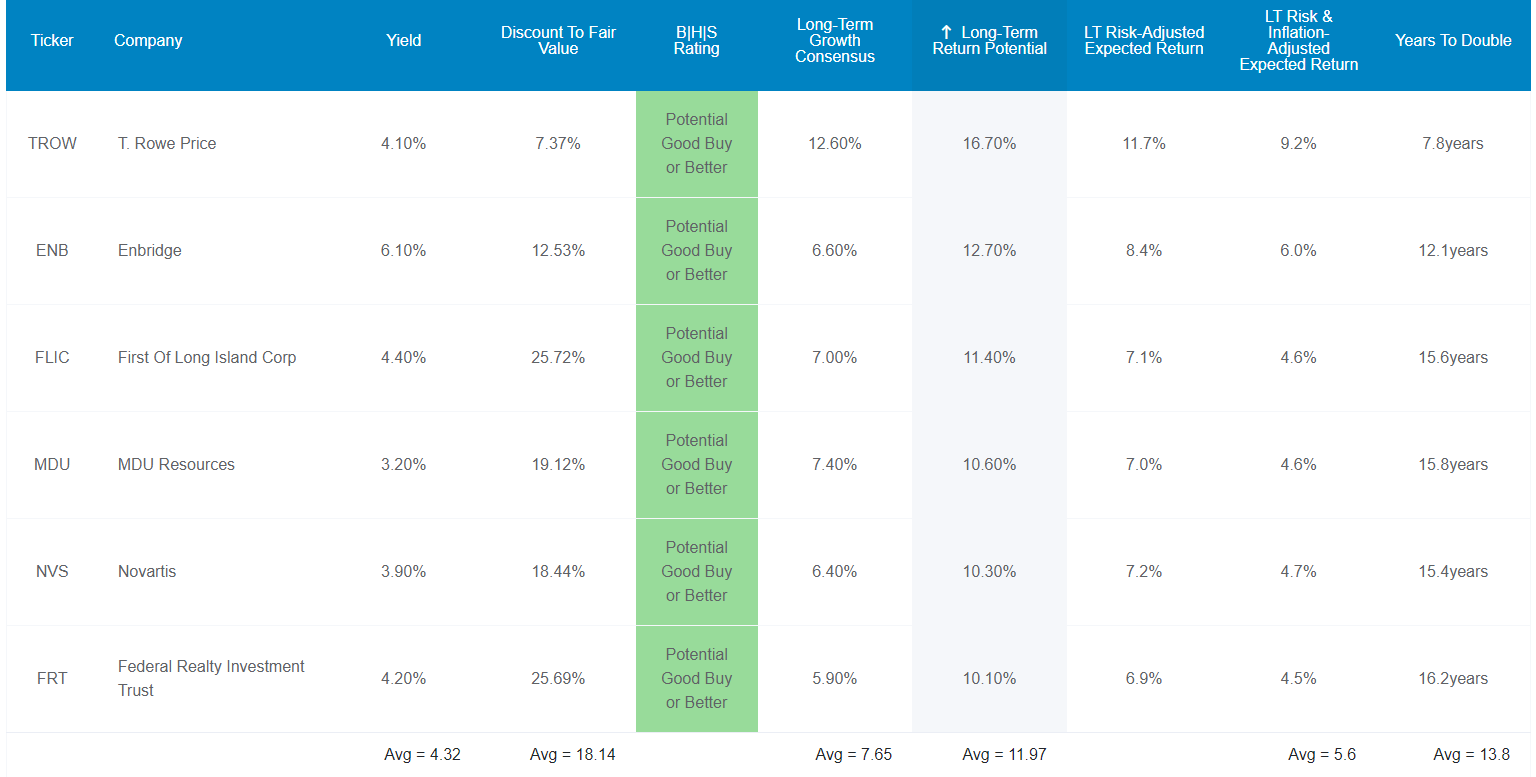
These stagflation-beating Super SWANs don’t just offer one of the world’s safest 4.3% yields; they are also growing 7.7% and offer 12% CAGR long-term consensus total return potential.
- S&P 500 offers 10.2% CAGR
- the dividend aristocrats 11.1% CAGR
Think that 12% returns can’t change your life? Think again.
Inflation-Adjusted Consensus Total Return Potential: $1,000 Initial Investment
| Time Frame (Years) | 7.7% CAGR Inflation-Adjusted S&P Consensus | 8.6% Inflation-Adjusted Aristocrat Consensus | 9.5% CAGR Inflation-Adjusted 6 Stagflation Beating High-Yield Aristocrat Guidance | Difference Between Inflation-Adjusted6 Stagflation Beating High-Yield Aristocrat Guidance Consensus And S&P Consensus |
| 5 | $1,451.05 | $1,512.69 | $1,576.40 | $63.71 |
| 10 | $2,105.56 | $2,288.22 | $2,485.03 | $196.81 |
| 15 | $3,055.27 | $3,461.36 | $3,917.39 | $456.03 |
| 20 | $4,433.36 | $5,235.95 | $6,175.35 | $939.40 |
| 25 | $6,433.04 | $7,920.35 | $9,734.80 | $1,814.45 |
| 30 | $9,334.69 | $11,981.01 | $15,345.91 | $3,364.90 |
(Source: DK Research Terminal, FactSet)
Analysts think these aristocrats could deliver 15.3X inflation-adjusted returns over the next 30 years, compared to 12X for the aristocrats and 9.3X for the S&P 500.
-
- 30 years is the standard retirement time frame
- and 97% of 30-year returns are a result of fundamentals, not luck
| Time Frame (Years) | Ratio Aristocrats/S&P Consensus | Ratio Inflation-Adjusted 6 Stagflation Beating High-Yield Aristocrat Guidance Consensus vs. S&P consensus |
| 5 | 1.04 | 1.09 |
| 10 | 1.09 | 1.18 |
| 15 | 1.13 | 1.28 |
| 20 | 1.18 | 1.39 |
| 25 | 1.23 | 1.51 |
| 30 | 1.28 | 1.64 |
(Source: DK Research Terminal, FactSet)
That works out to potentially 64% more than the S&P 500 and 28% more than the dividend aristocrats.
- For the average retired couple, that means potentially $1.7 million more inflation-adjusted dollars after 30 years compared to the S&P 500.
What evidence is there that these aristocrats can deliver 12% long-term returns?
Historical Returns Since December 1996 (Equal Weight, Annual Rebalancing)
The future doesn’t repeat, but it often rhymes.” – Mark Twain
Past performance is no guarantee of future results, but studies show that blue-chips with relatively stable fundamentals over time offer predictable returns based on yield, growth, and valuation mean reversion.
Bank of America
So let’s see how these aristocrats have done over the last 26 years when 95% of total returns resulted from pure fundamentals and not luck.
(Source: Portfolio Visualizer Premium)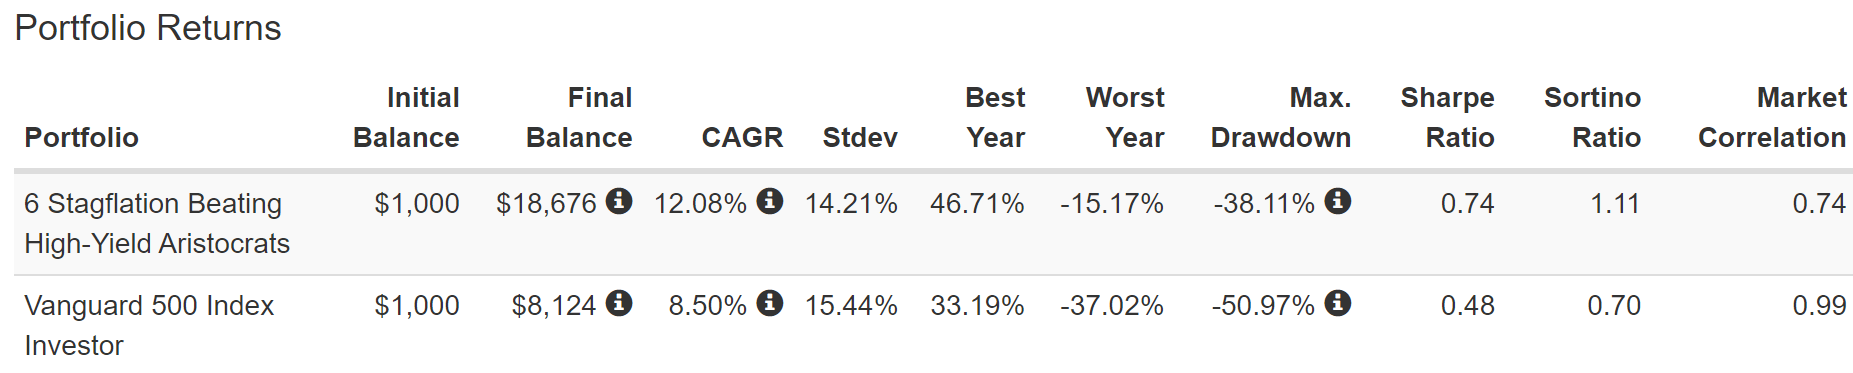
Analysts expect 12% long-term returns in the future, and these aristocrats delivered 12.1% returns over the last 26 years.
(Source: Portfolio Visualizer Premium)
Across every time frame, the average rolling return is about 12% annually.
- forecasting long-term returns for blue-chips isn’t magic it’s just math
- starting yield + long-term growth = total returns (valuations cancel out over time)
- this is the most accurate return model ever devised, used by JPMorgan, BlackRock, Vanguard, Fidelity, Schwab, Brookfield, Oaktree, and virtually all asset managers
In the next 25 years, analysts expect about 9.7X inflation-adjusted returns, and here are the real returns these aristocrats delivered in the last 26 years.
(Source: Portfolio Visualizer Premium)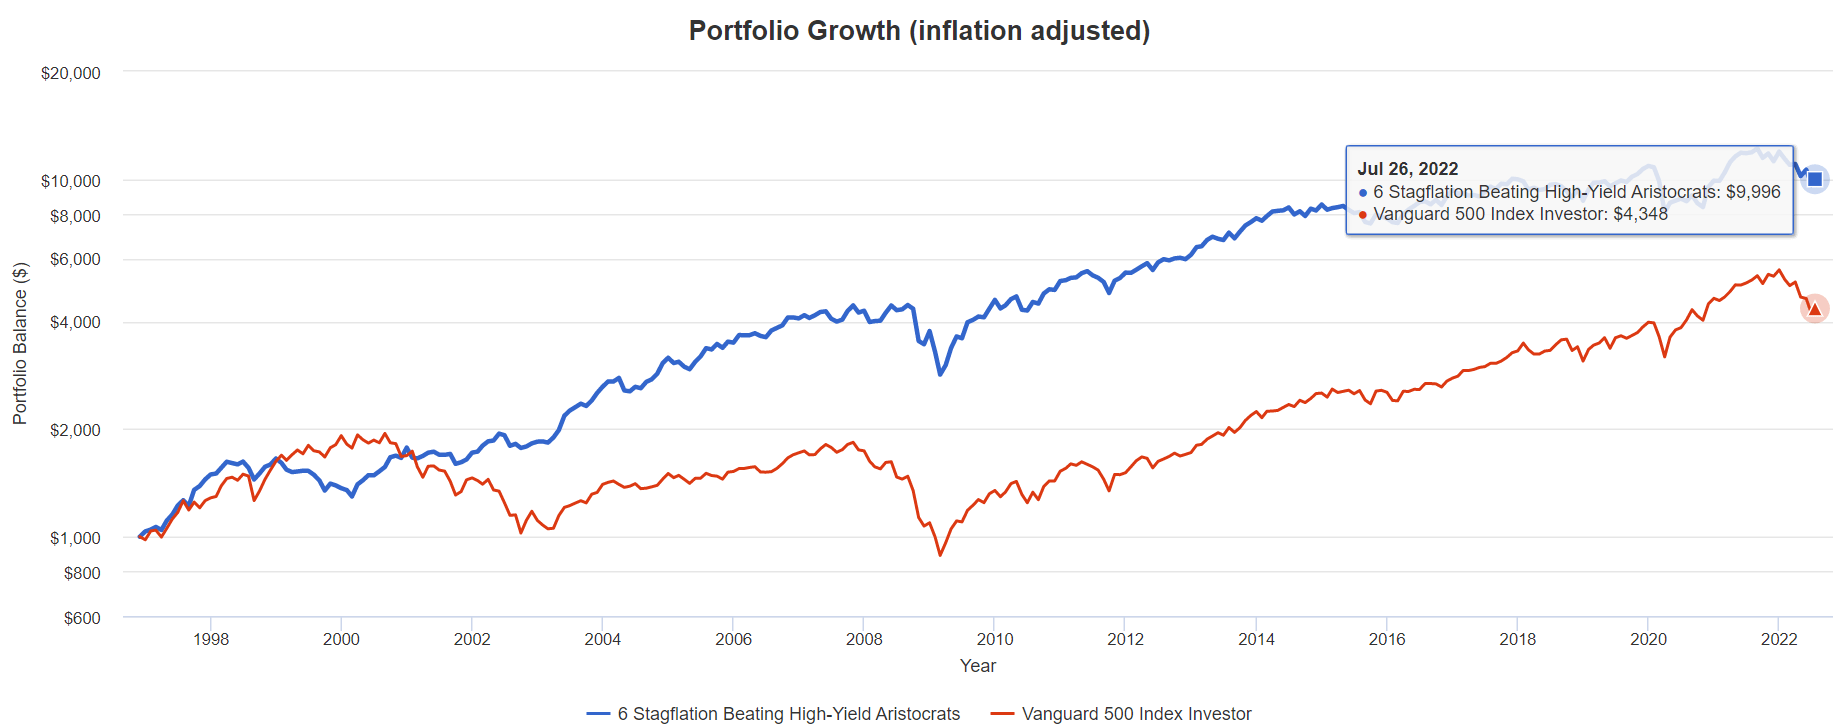
- 10X inflation-adjusted returns vs. the S&P 500’s 4.4X
- 2.3X better real returns than the S&P 500
And these aristocrats achieved these 10X returns with 8% less annual volatility over time and a lot less when it matters most, in market crashes and recessions.
(Source: Portfolio Visualizer Premium)
How have these aristocrats done during some of the worst years for stocks in the past quarter century?
| Year | 6 Stagflation Beating High-Yield Aristocrat’s Total Return | S&P 500 Total Return | Outperformance | Beta |
| 2000 | 34.2% | -9.1% | 43.3% | -3.76 |
| 2001 | -1.7% | -12.0% | 10.3% | 0.14 |
| 2002 | 9.9% | -22.2% | 32.1% | -0.45 |
| 2008 | -12.1% | -37.0% | 24.9% | 0.33 |
| 2022 | -11.0% | -17.1% | 6.1% | 0.64 |
| Average | 3.9% | -19.5% | 23.3% | -0.20 |
(Source: Portfolio Visualizer Premium)
They have gone up an average of 4%, outperforming the market by 23%, though not in every downturn.
(Source: Portfolio Visualizer Premium)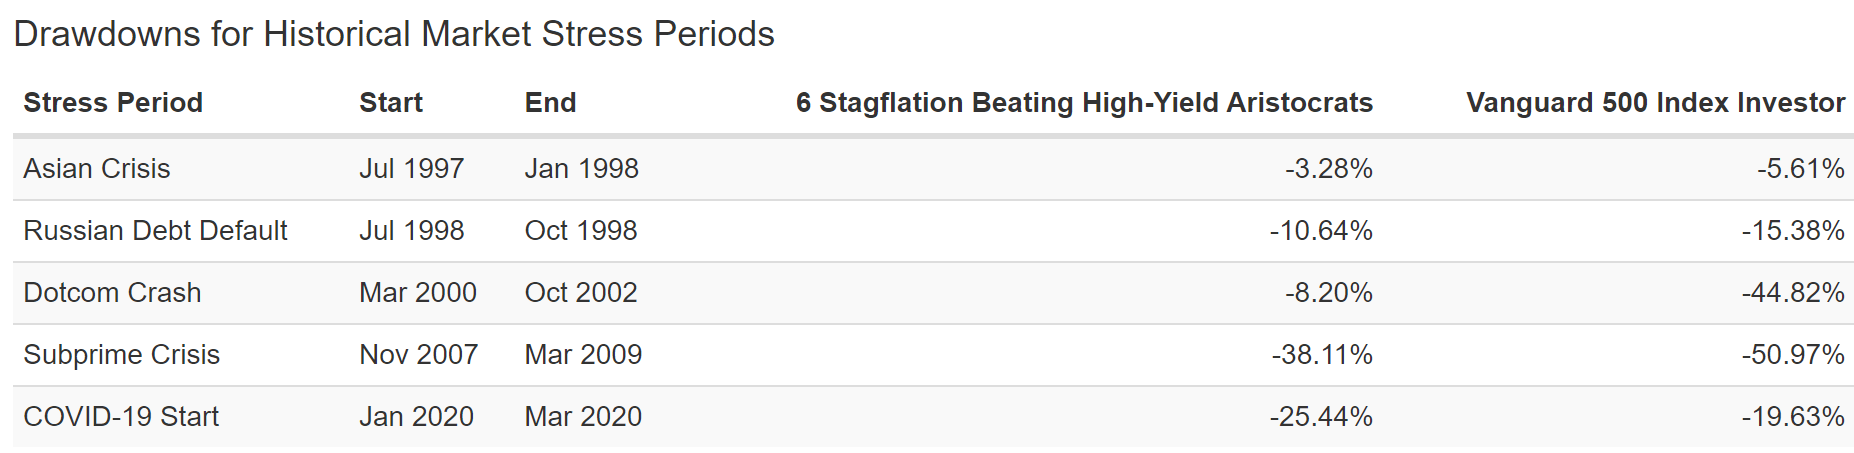
During the pandemic, they underperformed, but in every other major market downturn, they shined.
Aristocrats You Can Trust When The Market Freaks Out
| Market Crisis | 6 Stagflation Beating High-Yield Aristocrat’s Total Return | S&P 500 Total Return | Outperformance | Beta |
| Asian Financial Crisis | -3.30% | -5.60% | 2.3% | 0.59 |
| Russian Default Crisis | -10.60% | -15.40% | 4.8% | 0.69 |
| Tech Crash | -8.20% | -44.80% | 36.6% | 0.18 |
| Great Recession | -38.10% | -50.10% | 12.0% | 0.76 |
| Pandemic | -25.40% | -19.60% | -5.8% | 1.30 |
| Average | -17.12% | -27.10% | 10.0% | 0.70 |
(Source: Portfolio Visualizer Premium)
For 26 years, these aristocrats had a beta of 0.74, and during the market’s worst periods of panic, they fell 0.7X as much as the market.
- Helping investors sleep well at night when it matters most
Does that mean they don’t experience bear markets? No, they’ve experienced two in the last 26 years.
(Source: Portfolio Visualizer Premium)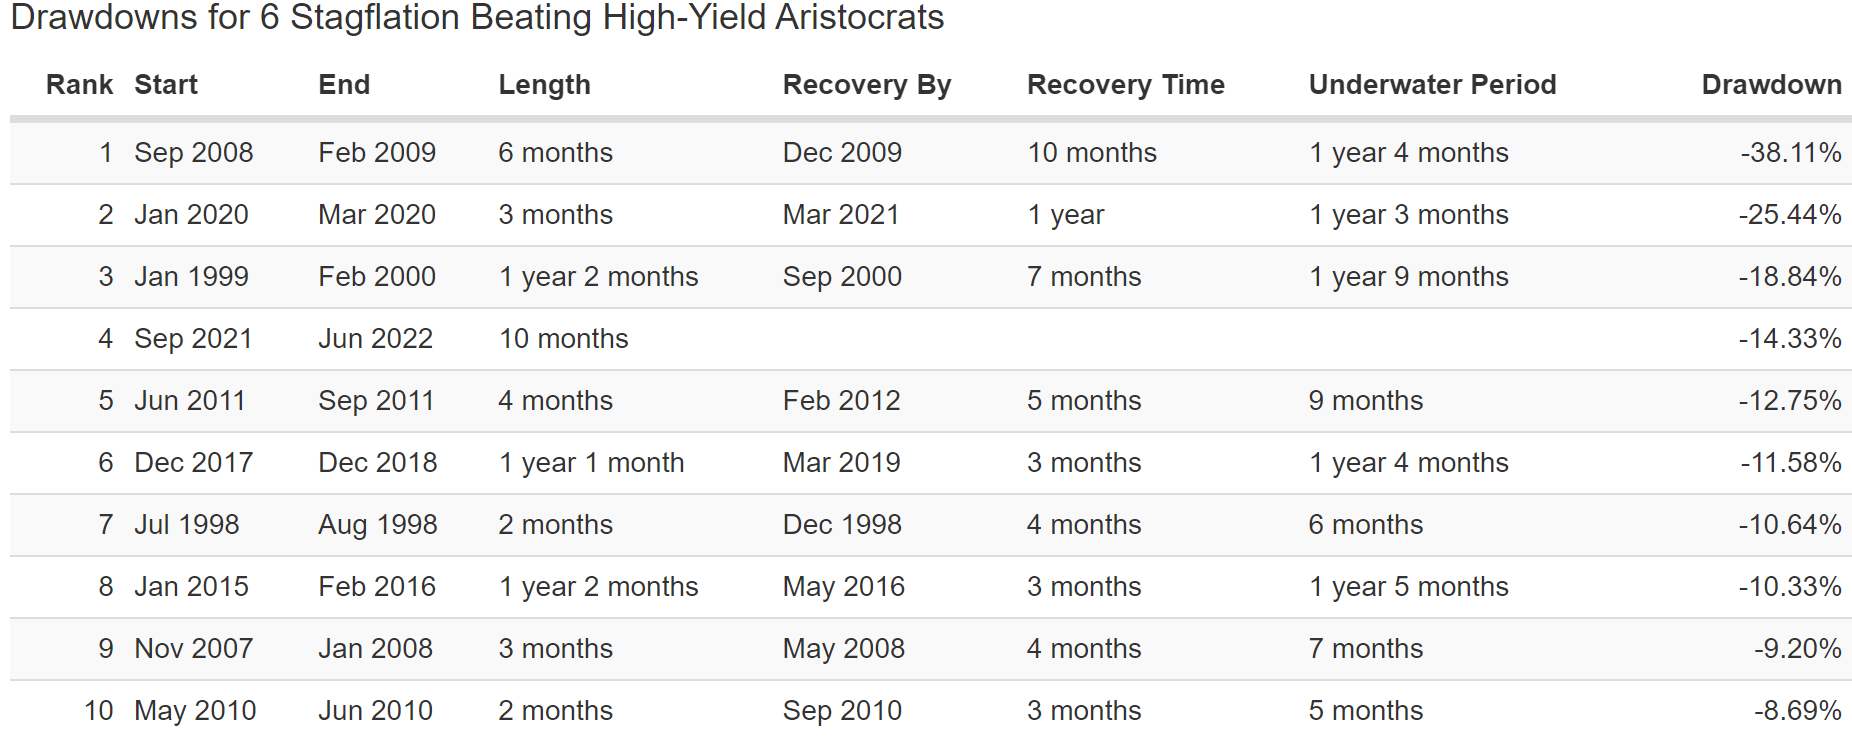
But they have managed to recover record highs within less than two years.
(Source: Portfolio Visualizer Premium)
In contrast, the S&P has had four bear markets (6 if you count intra-day), and it took as long as 6.25 years for index investors to break even.
So let’s summarize:
- higher yield than aristocrats and the S&P 500
- equally safe dividends and much safer than the S&P 500
- lower volatility
- higher returns
- much smaller peak declines in market panics
And finally, as if all that weren’t enough, let’s consider the primary reason for owning aristocrats in the first place.
Dividend Growth Blue-Chips You Can Trust
(Source: Portfolio Visualizer Premium) – includes reinvested dividends, annual rebalancing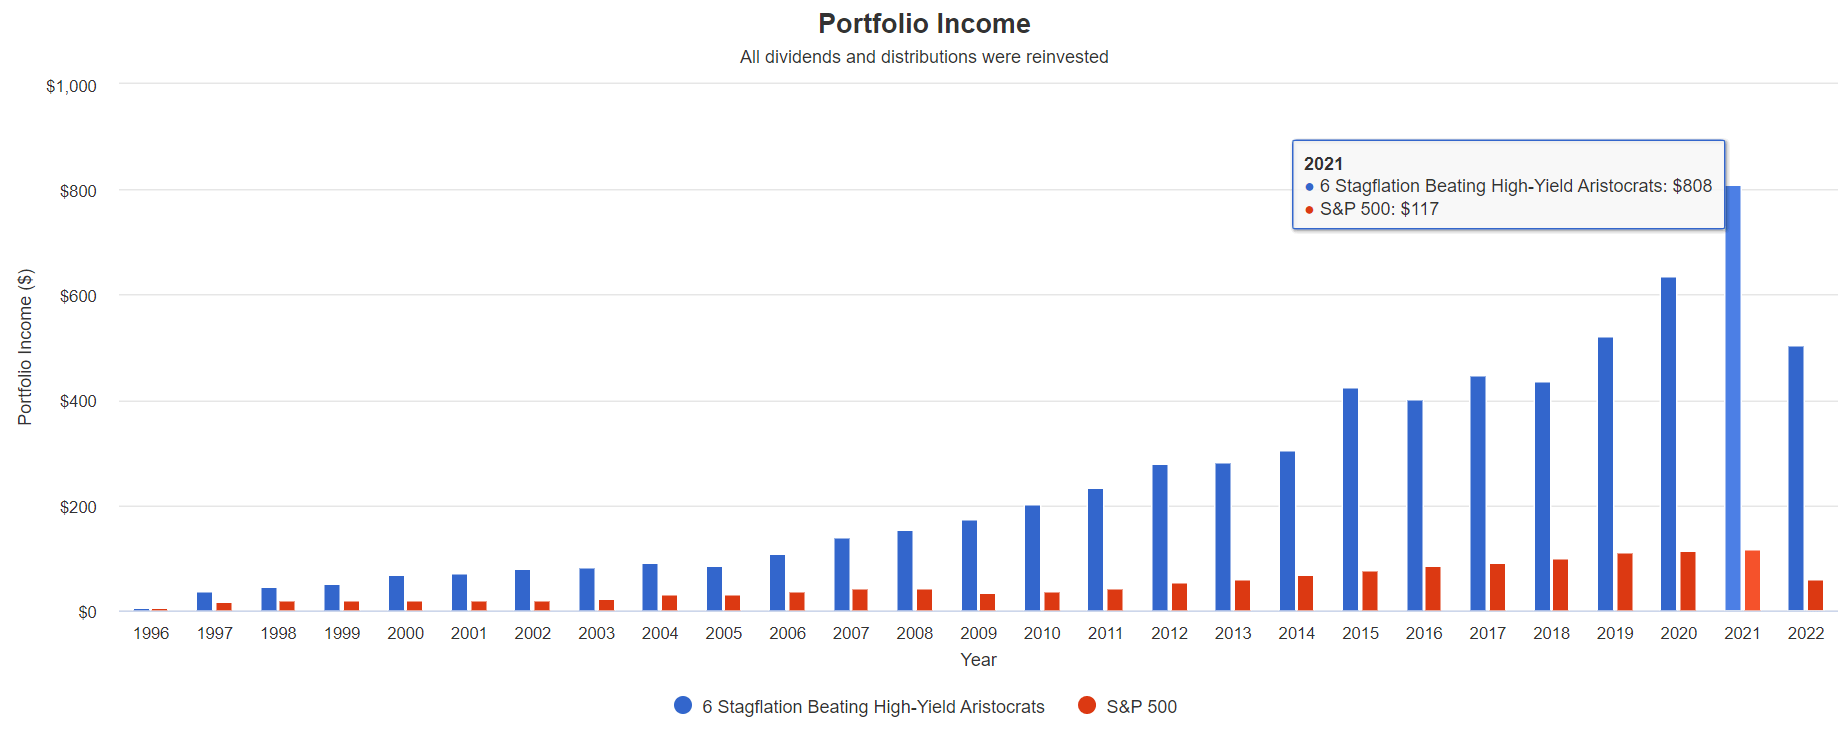
| Portfolio | 1997 Income Per $1000 Investment | 2022 Income Per $1000 Investment | Annual Income Growth | Starting Yield |
2022 Yield On Cost |
| S&P 500 | $18 | $122 | 7.96% | 1.8% | 12.2% |
| 6 Stagflation Beating High-Yield Aristocrats | $37 | $1,006 | 14.12% | 3.7% | 100.6% |
(Source: Portfolio Visualizer Premium)
The S&P 500 delivered 8% annual income growth over the last 25 years. These aristocrats 14%, almost 2X the market.
- 3.7% yield in 1998 (lower than today’s 4.3%)
- 101% yield on cost today
Cumulative Dividends Since December 1996 (Dividends Reinvested) $1,000 Initial Investment
| Year | S&P 500 |
6 Stagflation Beating High-Yield Aristocrats |
| 1996 | $5 | $6 |
| 1997 | $18 | $37 |
| 1998 | $19 | $45 |
| 1999 | $21 | $51 |
| 2000 | $20 | $67 |
| 2001 | $21 | $71 |
| 2002 | $21 | $78 |
| 2003 | $23 | $82 |
| 2004 | $32 | $92 |
| 2005 | $32 | $87 |
| 2006 | $37 | $109 |
| 2007 | $42 | $138 |
| 2008 | $43 | $154 |
| 2009 | $35 | $173 |
| 2010 | $37 | $202 |
| 2011 | $43 | $233 |
| 2012 | $53 | $281 |
| 2013 | $59 | $283 |
| 2014 | $69 | $304 |
| 2015 | $77 | $423 |
| 2016 | $85 | $401 |
| 2017 | $91 | $448 |
| 2018 | $99 | $436 |
| 2019 | $111 | $521 |
| 2020 | $115 | $634 |
| 2021 | $117 | $808 |
| 2022 | $122 | $1,006 |
| Total | $1,447 | $7,170 |
| Annualized Income Growth Rate | 7.96% | 14.12% |
| Total Income/Initial Investment | 144.7% | 717.0% |
| Inflation-Adjusted Income/Initial Investment | 77.4% | 383.4% |
| More Inflation-Adjusted Income Than The S&P 500 | 4.96 |
(Source: DK Research Terminal, Portfolio Visualizer Premium)
These aristocrats have delivered 7.2X your initial investment over the last quarter century, almost 4X adjusted for inflation. That’s 5X more inflation-adjusted income than the S&P 500.
What about future income growth?
6 Stagflation Beating High-Yield Aristocrats Consensus Future Income Growth Potential
| Analyst Consensus Income Growth Forecast | Risk-Adjusted Expected Income Growth | Risk And Tax-Adjusted Expected Income Growth |
Risk, Inflation, And Tax Adjusted Income Growth Consensus |
| 14.0% | 9.8% | 8.3% | 5.8% |
(Source: DK Research Terminal, FactSet)
Analysts think these aristocrats could deliver nearly identical 14% annual income growth in the future, which, adjusted for the risk of the company not growing as expected, inflation, and taxes, is 5.8% real expected income growth.
Now compare that to what they expect from the S&P 500.
| Time Frame | S&P Inflation-Adjusted Dividend Growth | S&P Inflation-Adjusted Earnings Growth |
| 1871-2021 | 1.6% | 2.1% |
| 1945-2021 | 2.4% | 3.5% |
| 1981-2021 (Modern Falling Rate Era) | 2.8% | 3.8% |
| 2008-2021 (Modern Low Rate Era) | 3.5% | 6.2% |
| FactSet Future Consensus | 2.0% | 5.2% |
(Sources: S&P, FactSet, Multipl.com)
- 1.7% post-tax inflation-adjusted income growth from the S&P 500
- S&P 500’s historical post-tax inflation-adjusted income growth rate (current tax code) is 5.8% CAGR
What about a 60/40 retirement portfolio?
- 0.5% consensus inflation, risk, and tax-adjusted income growth.
In other words, these aristocrats are expected to potentially generate about 3.4X faster real income growth than the S&P 500 and 12X faster income growth than a 60/40.
- Conservatively they should grow dividends at least 2X faster than the S&P 500
And they yield almost 3X as much as the S&P 500 and have much safer dividends.
This is the power of high-yield aristocrats to help you beat stagflation and retire in safety and splendor.
Bottom Line: These 6 Stagflation Beating High-Yield Dividend Aristocrats Can Help You Sleep Well At Night No Matter What’s Coming Next
How bad will stagflation get in 2022 and 2023? No one knows, but we’re likely through the worst of inflation, though possibly it might get a bit worse over the next few months.
As for the risk of recession, the bond market is confident that one is coming.
- the 2-10 yield curve is 0.32%, the steepest yield curve inversion since 2000
But just because a recession might be coming in a few months, and inflation might remain elevated through most of next year doesn’t mean we’re headed for an economic apocalypse.
This recession is likely to be mild. How mild? Bank of America’s latest 2023 US GDP economic growth forecast:
- -0.2%
- vs. -0.5% Deutsche Bank
- vs. 2001’s -0.4% (the mildest recession in US history thus far )
Why? Because Americans are still flush with cash.
Daily Shot 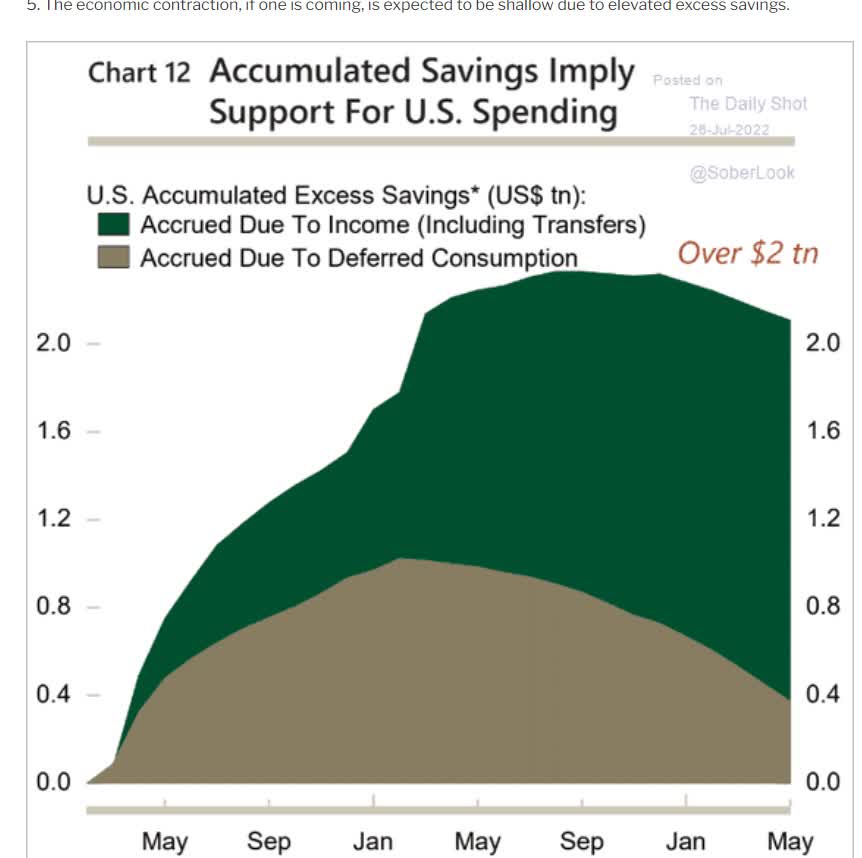
Consumer debt service burdens are near record lows, and corporate America is sitting on $7 trillion in cash.
Moody’s expects US job growth to fall steadily to 175K within 12 months.
- potentially the first recession ever to see falling unemployment
- Moody’s also expects US home prices to remain flat for 3 to 4 years
- no big housing crash
So what does this mean for long-term income investors? You NEED to be buying, or you will deeply regret it. To paraphrase Casablanca:
If the market leaves the ground and you haven’t bought some blue-chip bargains you’ll regret it. Maybe not today. Maybe not tomorrow, but soon and for the rest of your life.”
And here’s why.
Charlie Bilello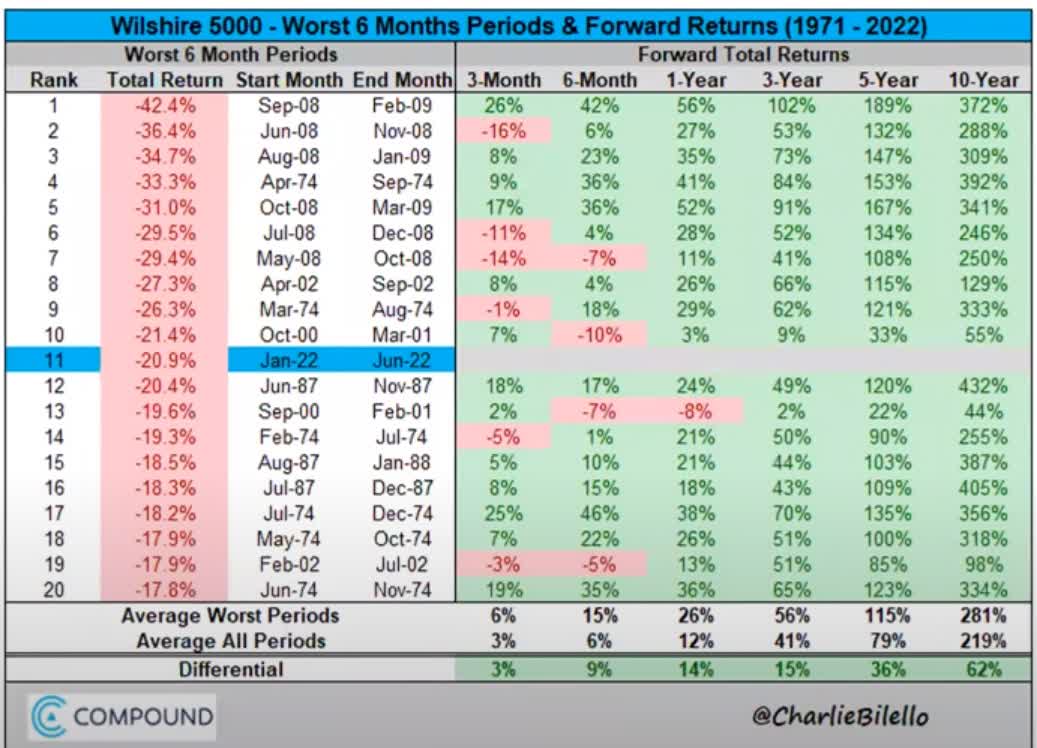
- buying stocks after a terrible 6 months historically results in 4% to 6% higher annual returns for the next decade
- a 3.8X average historical return in the next 10 years
- 14.4% CAGR
- individual blue-chips could deliver 7X to 16X in the 10 years following the bear market bottom
What if we get a recession and stocks fall into those worst-case scenarios, 48% to 52%? Then the average historical return rises to 4.5X to 5.9X for the S&P 500 and 9X to 24X for individual blue-chips.
My goal isn’t to try to guess what the market will do in the short-term, because no one can do that consistently.
- over 1-year luck is 33X as powerful as fundamentals
- over 30+ years; fundamentals are 33X as powerful as luck
Or, to put it another way, portfolio returns are a crapshoot over two or three years. Over 20 to 30 years, they are destiny.
If you want to stop fretting about inflation, the Fed, the economy, and the stock market, you need to take charge of your financial destiny and make your own luck on Wall Street.
Luck is what happens when preparation meets opportunity.” – Roman philosopher Seneca the younger
That’s where these six stagflation-beating high-yield Super SWAN aristocrats come in.
NVS, ENB, FLIC, FRT, MDU, and TROW could fall more if we go into recession. SWANiness has zero to do with short-term volatility and everything to do with dividend safety and fundamental risk.
So while I can’t tell you what these aristocrats will do in the short-term, here’s what I can say with 80% confidence.
- one of the safest 4.3% yields on earth
- BBB+ average credit rating and 4% fundamental risk according to S&P
- 68th industry percentile long-term risk management
- 7.7% long-term growth consensus
- 12% long-term return potential, just as they have delivered for the last 26 years
- the potential for 15X inflation-adjusted returns over the next 30 years
- 14% historical income growth and 14% consensus future growth (2X to 3.5X more than the S&P 500)
- Cumulative dividends since 1996 equal to 4X your initial investment, adjusted for inflation
- 5X better inflation-adjusted cumulative dividends than the S&P 500
Higher yield, stronger returns, and lower volatility when it matters most. That’s the power of high-yield sleep well at night dividend aristocrat investing in this bear market.
Because when you trust the world’s greatest dividend blue-chips with your hard-earned savings, you never have to fear anything the economy or market will throw at us.
High-yield aristocrats like these are how you stay safe from stagflation.
High-yield aristocrats like these are how you take charge of your financial destiny and make your own luck on Wall Street.
High-yield aristocrats like these are how you can potentially retire in safety and splendor, no matter what happens with inflation, interest rates, the economy, or the stock market in the coming years and decades.
Be the first to comment