


FG Trade
Author’s note: This article was released to CEF/ETF Income Laboratory members on October 12th.
Security prices have declined YTD, leading to higher trailing dividend yields for most asset classes, securities, and funds. Many ETFs are now offering strong, double-digit TTM dividend yields. Several do so without using leverage, and without engaging in destructive ROC distributions. Six funds, following two different strategies, are buys, in my opinion at least. From these, two funds stand out.
The Global X Russell 2000 Covered Call ETF (NYSEARCA:RYLD) invests in U.S. small-caps, and sells covered call on the entirety of its holdings. RYLD has offered investors a strong TTM 14.7% dividend yield, highest of its peer group, and a relatively cheap valuation. Potential capital gains are significantly lower relative to most equity indexes, while expected long-term total returns are slightly below average.
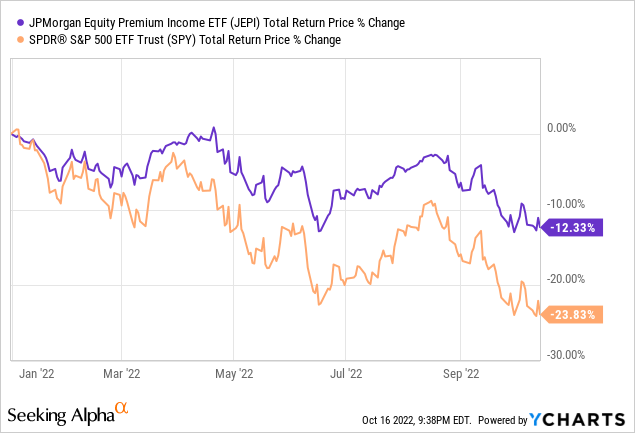
The JPMorgan Equity Premium Income ETF (JEPI) invests in low-volatility large-cap U.S. equities, and indirectly sells covered calls on equity indexes, using equity-linked notes. JEPI has offered investors a strong TTM 11.3% dividend yield, has performed quite well since inception, and has outperformed during prior downturns. Potential capital gains are significantly lower relative to most equity indexes, while expected long-term total returns are slightly below average.
A quick table summarizing these six funds, before having a closer look at each.
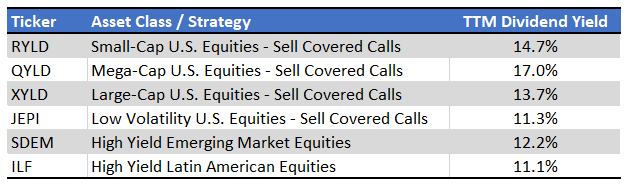
Seeking Alpha – Chart by Author
Covered Call ETFs – RYLD, QYLD, XYLD
Strategy and Holdings
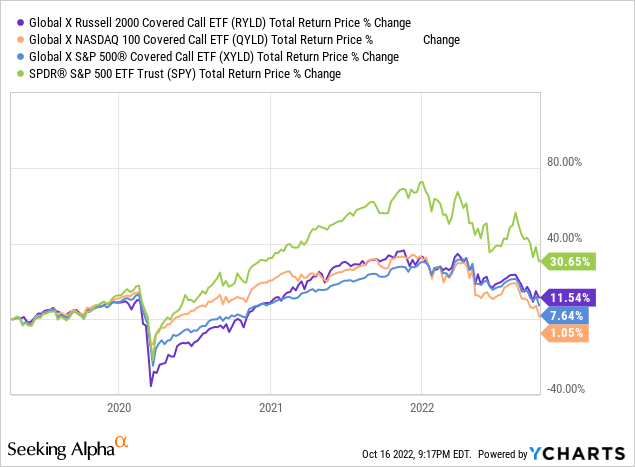
RYLD, the Global X NASDAQ 100 Covered Call ETF (NASDAQ:QYLD), and the Global X S&P 500 Covered Call ETF (NYSEARCA:XYLD), all follow similar strategies, and so have similar characteristics.
Each fund invests in the underlying holdings of a specific U.S. equity index, and sells covered calls on said specific index for the entirety of its holdings.
RYLD holds a portfolio of securities representative of the Russell 2000 index, and then writes covered call options on them.
QYLD holds a portfolio of securities representative of the Nasdaq-100 index, and then writes covered call options on them.
XYLD holds a portfolio of securities representative of the S&P 500 index, and then writes covered call options on them.
Writing covered call options has similar effects on all three funds. Doing so means trading away most potential capital gains / higher share prices for income, which are then returned (at least partially) to shareholders in the form of dividends. Potential capital losses stemming from the underlying holdings remain unchanged.
Benefits and Positives
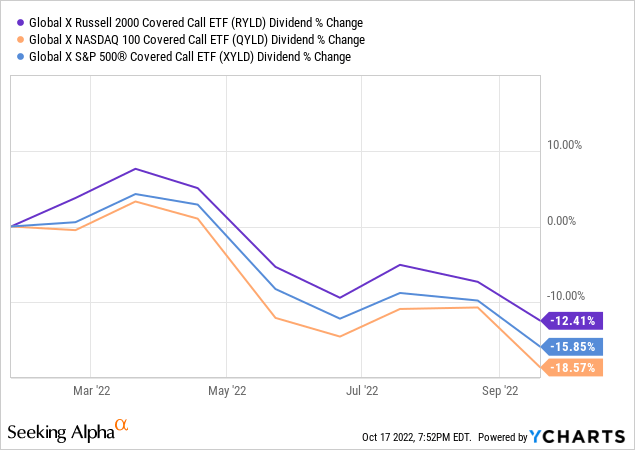
Each of these funds has offered investors strong, double-digit dividend yields over the past 12 months. XYLD’s yield tends to be a bit lower than average, as S&P 500 call option prices tend to be lower than average, due to their lower realized and implied volatility. QYLD boasts a stronger TTM dividend yield, in large part due to suffering significant capital losses in the past (lower share prices = higher yields).
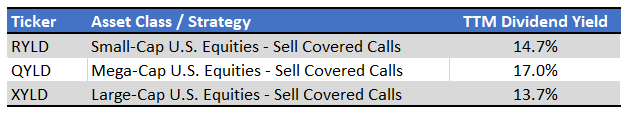
Seeking Alpha – Chart by Author
Dividends for these three funds are capped at 1.0% per month. As such, yields should normalize to around 12.0% in the coming months, although future dividends are ultimately contingent on future market conditions.
As per fund documentation, current fund dividends are covered by premiums received from selling options: the funds do not engage in destructive return of capital distributions or similar. Selling covered calls is a reasonably sustainable strategy, so fund dividends are reasonably sustainable. Still, fluctuations are common, and dividends could be cut if option premiums decrease.
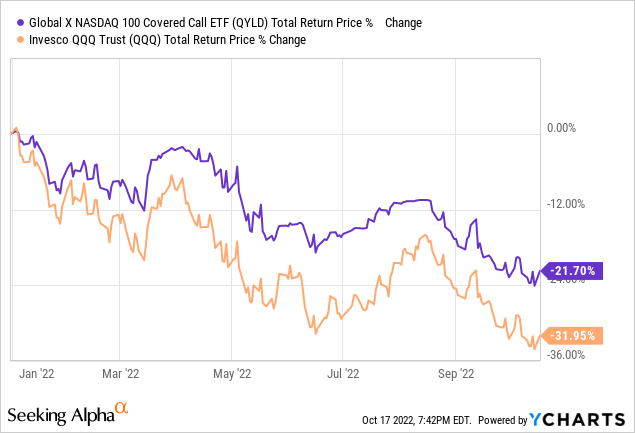
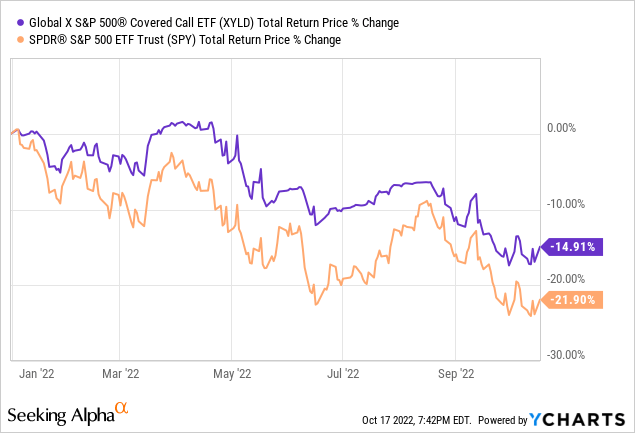
Strong, double-digit TTM dividend yields are a significant benefit for the funds and their shareholders, and particularly important for income investors and retirees. Strong yields are particularly impactful when markets are flat or drifting down. This has been the case YTD, with each of these funds outperforming relative to its respective index for the same.
QYLD has outperformed its benchmark by around 10%, highest of the three.
XYLD has outperformed its benchmark by around 7%, lowest of the three.
RYLD is in the middle, outperforming its benchmark by 8.5%.
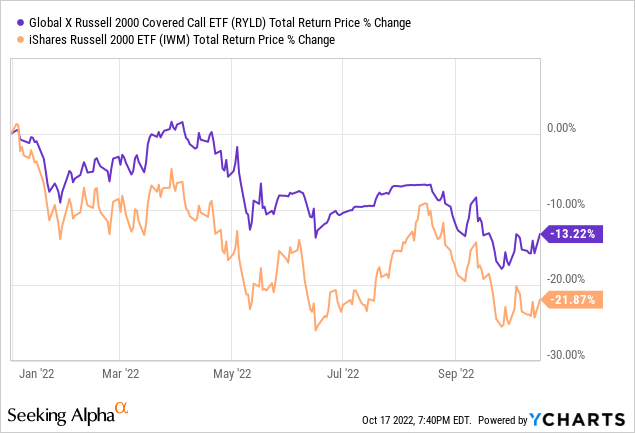
RYLD, QYLD, and XYLD all offer investors strong, double-digit dividend TTM yields, and the possibility of outperformance during flat-ish markets.
Risks and Drawbacks
Stock market losses have led to lower share prices and asset values for these funds, which pressures their income and dividends. Under current conditions, investors should expect small dividend cuts in the coming months, although these are ultimately dependent on market conditions moving forward. Dividends have declined YTD, more or less as expected.
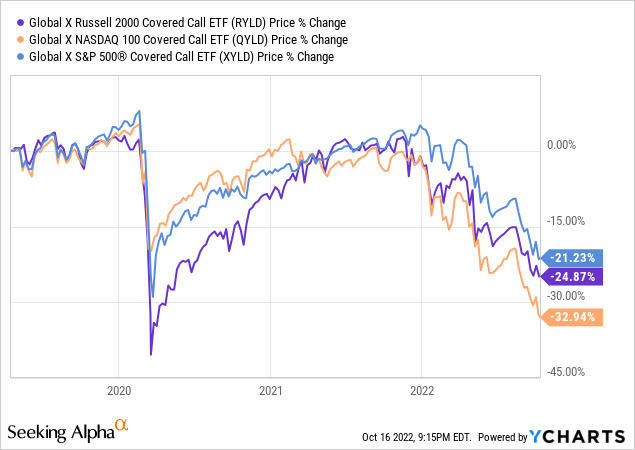
Each of these funds sells covered calls on the entirety of their holdings, which significantly reduces potential capital gains, while having no impact on potential capital losses. Limited upside with unchanged downside will almost certainly lead to (limited) long-term capital losses / lower share prices. These funds see fewer capital gains during bull markets, but bear the full brunt of capital losses during bear markets, so the long-term trend is towards lower share prices, especially considering the dividend payouts. Share prices for all three funds have declined since inception, as expected.
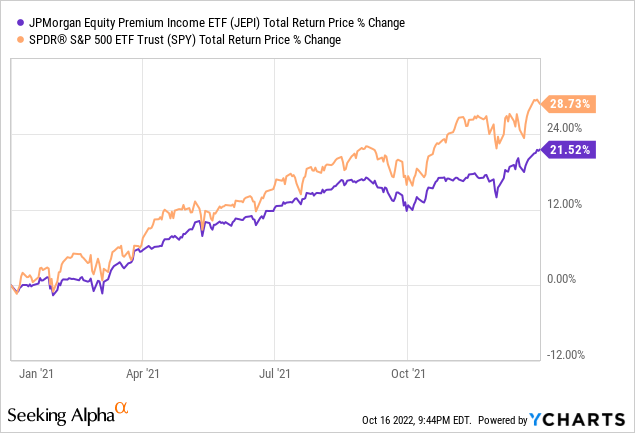
Selling covered calls significantly reduces potential capital gains. The opportunity cost of doing so is especially large during strong bull markets, so expect the funds to underperform during these. This was the case during 2021, during which the S&P 500 rallied by almost 29%, as expected.
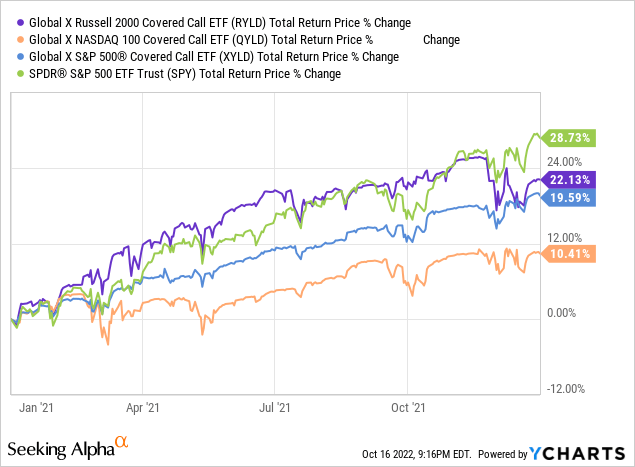
As bull markets are the most common market scenario, these funds tend to underperform, especially in the long-term. All three funds have underperformed relative to the S&P 500 since inception, as expected.
In my opinion, as bull markets are the most common market scenario, these funds are likely to underperform on a total-return basis long-term. On the other hand, underperformance is not a given, as all three funds do perform quite well under certain market conditions.
RYLD, QYLD, and XYLD all have significantly reduced potential capital gains, moderately underperform during bull markets, and should underperform on a total-return basis long-term, in my opinion at least. These are all significant negatives, and particularly harmful for long-term buy-and-hold investors. Income investors might be willing to overlook these issues due to the strong yields on offer, other investors might know. In my opinion, these three funds are all reasonable investment opportunities and buys, but they are definitely not for everyone.
I last covered RYLD, QYLD, and XYLD individually, here, here and here.
RYLD – Advantages
In my opinion, RYLD is a superior investment opportunity relative to its peers, due to recent trends in call option prices and volumes.
In simple terms, increased option selling has led to lower option prices, reducing the premiums, distributions, and returns, of these three funds. RYLD sells covered calls on a less well-known index, and so is generally less impacted by these trends than its peers.
In not so simple terms, option profits are partly dependent on the spread between implied and realized volatility. Spreads have narrowed these past few years, due to increased option selling. As with the above, RYLD sells covered calls on a less well-known index, and so is generally less impacted by these trends than its peers.
Due to the above, RYLD is a superior investment opportunity relative to QYLD and XYLD, in my opinion at least. Conditions can always change moving forward, of course.
Covered Call ELNs – JEPI
Strategy and Holdings
JEPI is another covered call ETF, with broadly similar characteristics as the three funds above.
JEPI invests in low-volatility large-cap U.S. equities, and sells covered calls on the S&P 500 index through equity-linked notes, or ELNs. JEPI is actively-managed: securities are selected and weighted according to a proprietary investment methodology.
JEPI’s ELNs are somewhat complicated, opaque, investments, but the overall impact of these seems clear enough. As with selling covered calls, these ELNs trade away most potential capital gains for cash, which is then returned to shareholders in the form of dividends. As with selling covered calls, potential capital losses remain unchanged.
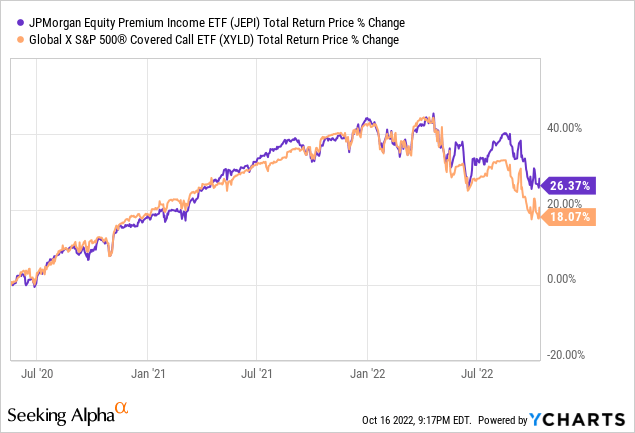
JEPI is most similar to XYLD. Performance tends to be relatively similar between them, although JEPI has outperformed since June 2022.
Benefits and Positives
JEPI has the same benefits and positives as the other covered call ETFs.
JEPI has paid investors a strong 11.3% TTM dividend yield. It is a strong yield on an absolute basis, and significantly higher than that of broader equity indexes.
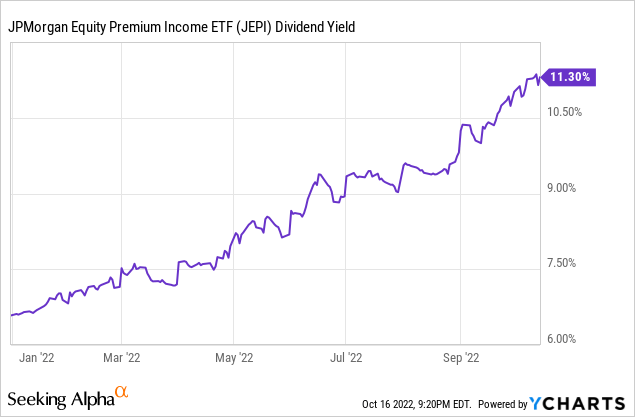
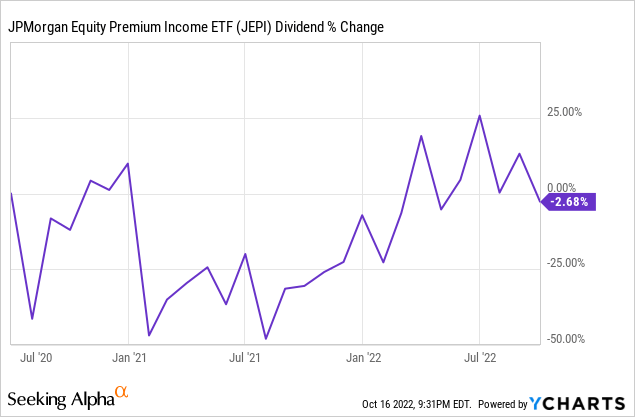
JEPI’s current dividends are covered by the premiums generated by its ELNs, as evidenced by the fund’s 12.5% SEC yield, a standardized measure of short-term generation of income. Said premiums are reasonably sustainable, although fluctuations are common, and dividend cuts possible. JEPI’s dividends have very slightly declined since inception, with heavily volatility.
JEPI’s strong dividend yield is particularly beneficial when capital gains are low or negative, as has been the case YTD.
JEPI also has several benefits unique to the fund itself.
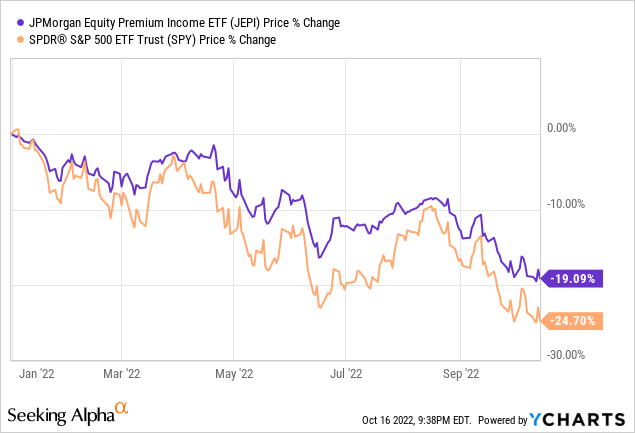
JEPI focuses on low-volatility stocks, which should reduce capital losses during bear markets. This has been the case YTD, as expected.
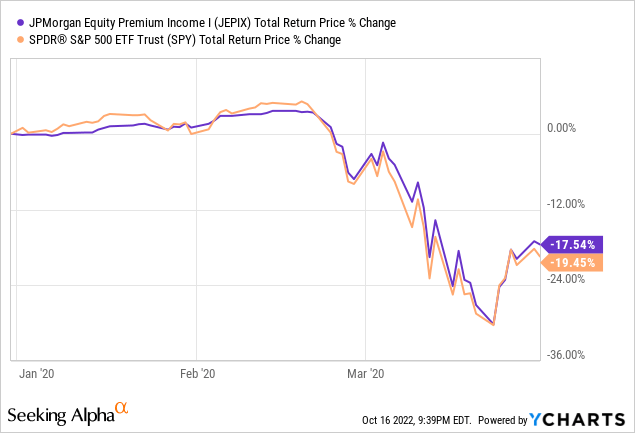
JEPI is a relatively new fund, so we can’t gauge its performance during early 2020, the other recent downturn. J.P. Morgan has another fund, the JPMorgan Equity Premium Income Fund Class I Inst (JEPIX), with an identical strategy to JEPI, but in mutual fund form. JEPIX is a bit older, with a longer performance track-record. JEPIX slightly outperformed the S&P 500 Trust ETF (SPY) during 1Q2020, so JEPI would almost certainly have outperformed during that downturn as well.
JEPI’s low-volatility holdings reduce portfolio risk, volatility, and potential losses during downturns, all significant benefits for the fund and its shareholders.
Reduced capital losses are particularly important for covered call funds like JEPI, to prevent long-term capital losses from materializing. Remember, covered call funds have reduced potential for capital gains, so it is difficult for these funds to recover from the capital losses experienced during bear markets. JEPI suffers fewer losses, so this is less of a concern. JEPI’s stock price is actually higher than its inception value, in addition to paying dividends from option premiums. The fund’s share price could continue to increase, but any such increase would very likely be below-average, at best.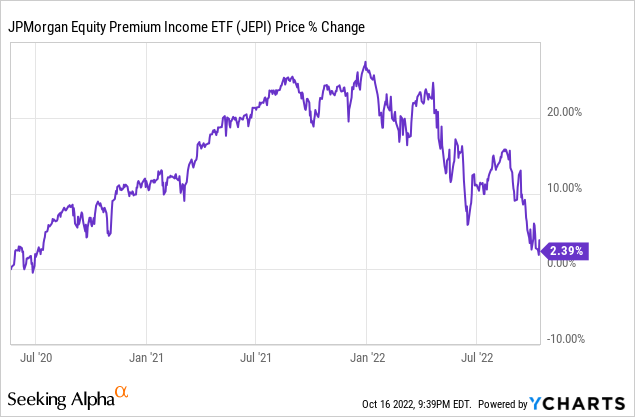
Risks and Drawbacks
JEPI shares the same risks and drawbacks as the other covered call ETFs.
Potential capital gains are significantly reduced, due to the fund selling covered calls.
Lower capital gains are a significant drawback for JEPI and other covered call funds during bull markets. As an example, JEPI underperformed during 2021, during which the S&P 500 rallied by almost 30%.
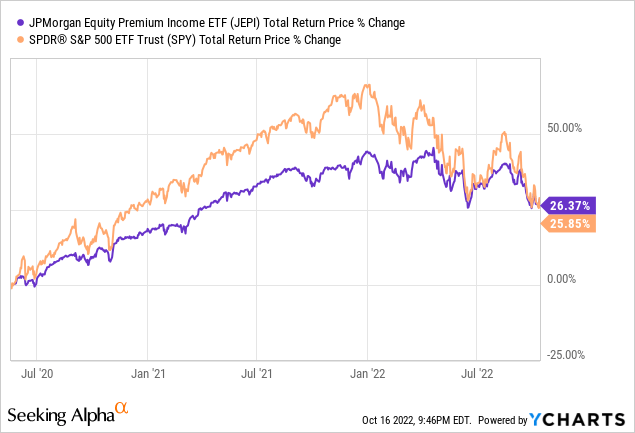
Bull markets are the most common market scenario, so JEPI should underperform relative to most broad-based equity indexes long-term. This has not been the case since inception, with JEPI very slightly outperforming for the same. JEPI’s performance has exceeded expectations, as the fund’s strong dividends and low volatility stocks have led to significant outperformance these past few months. Further outperformance is possible, but long-term underperformance remains the base case scenario.
JEPI’s significantly reduced potential capital gains, underperformance during bull markets, and long-term expected underperformance are all significant negatives for the fund and its shareholders. As with the other covered call funds, I believe that some income investors might be willing to overlook these issues due to the fund’s strong yield, but others might not. JEPI is a strong fund and investment opportunity, but definitely not for everyone.
I last covered JEPI here.
Emerging Market Dividend Equities – SDEM
Strategy and Holdings
The Global X SuperDividend Emerging Markets ETF (SDEM) is an emerging markets equity index ETF, which invests in the 50 highest-yielding emerging market stocks. Prospective stocks are subject to a basic set of inclusion criteria, centered on trading, liquidity, size, and dividend sustainability criteria.
SDEM is moderately diversified, with exposure to dozens of countries, and most relevant industry segments. The fund is overweight China, due to the size of the country’s economy, and due to the cheap valuations and strong yields offered by many of the country’s public companies. SDEM is overweight materials and energy, as these two industries are trading with comparatively cheap valuations, and high yields. SDEM’s industry weights make the fund something of a commodities play, something for investors to consider.
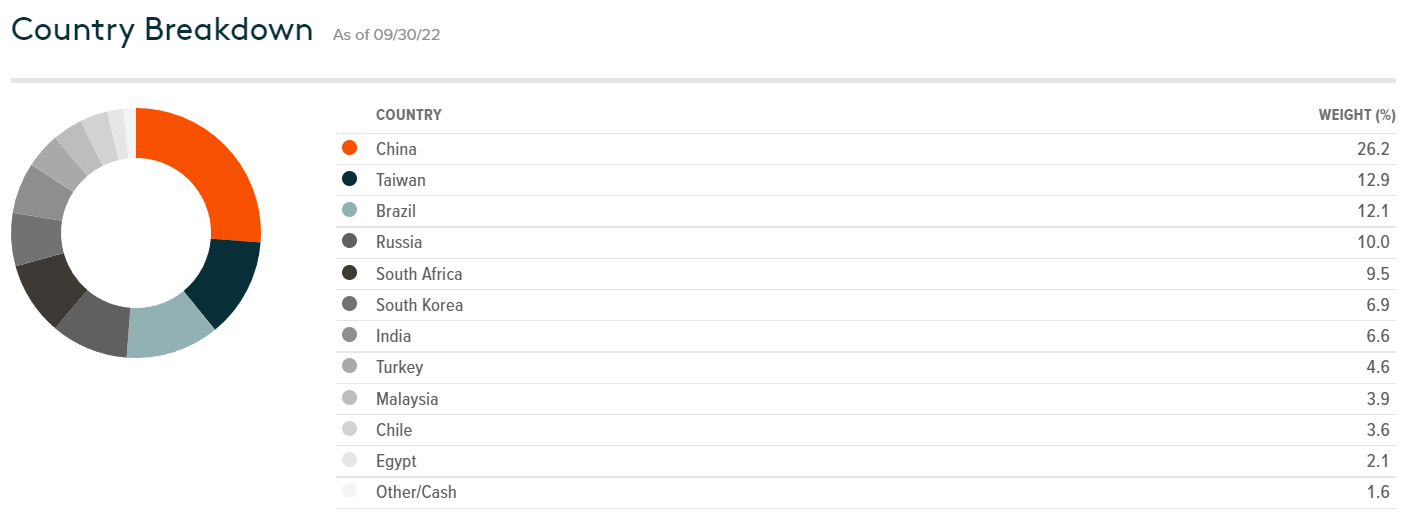
SDEM
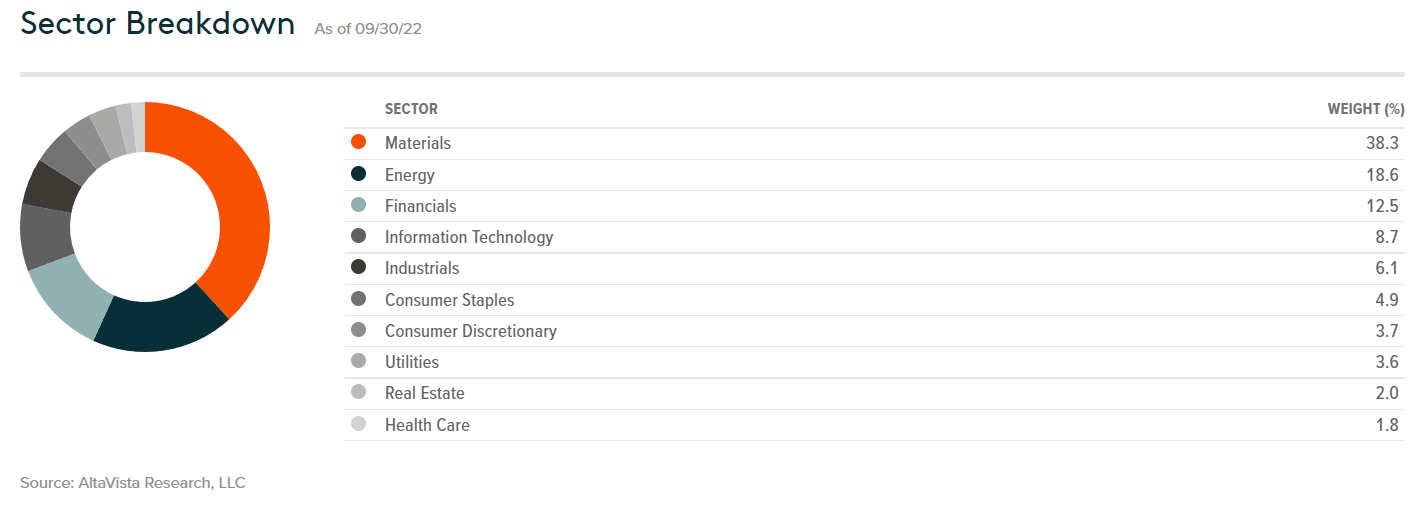
SDEM
Benefits and Positives
SDEM provides investors with exposure to several emerging markets and industry segments. Said exposure can serve to diversify an investor’s portfolio, a benefit for the same.
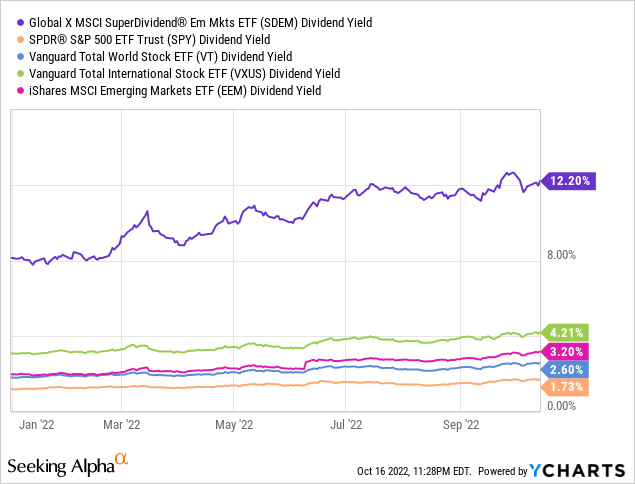
SDEM boasts a TTM 12.2% dividend yield. It is a strong yield on an absolute basis, and significantly higher than average for an equity index fund.
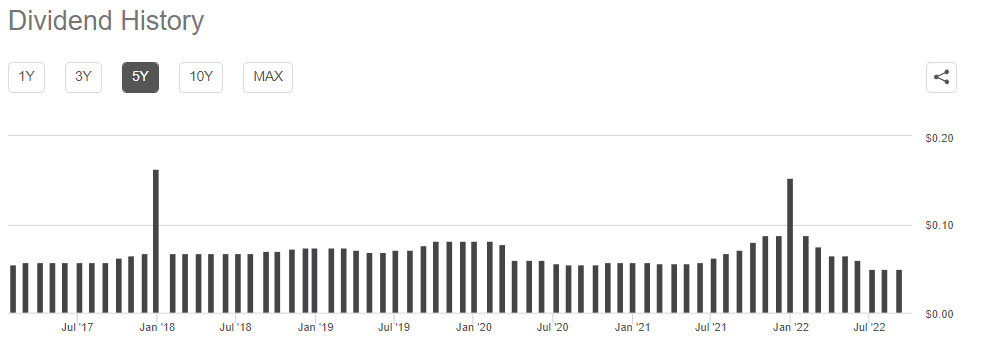
On a more negative note, some emerging markets have irregular dividend payments, so the fund’s dividends see some volatility month to month. Dividends have declined these past few months, dropping over 40% YTD. Dividends have also risen by about 8% these past twelve months, excluding a special distribution in late 2021. Dividend volatility makes it somewhat difficult to analyze these figures and forecast a forward dividend yield, but the fund’s dividends do seem to be quite strong, all things considered.
Seeking Alpha
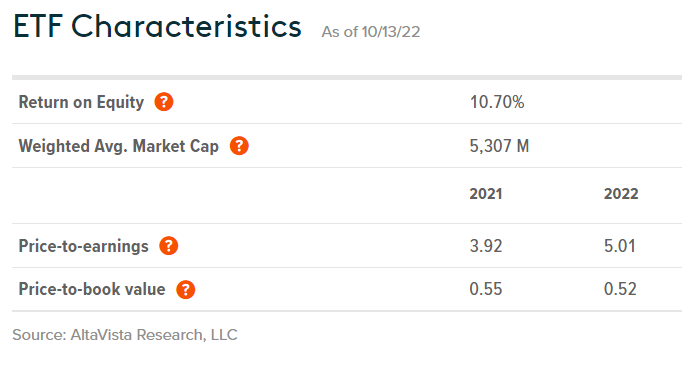
SDEM sports an incredibly cheap valuation, with a forward P/E ratio of 5.0x, and a P/B ratio of 0.5x. Both are very low figures, and significantly lower than average for an equity index. For reference, the S&P 500 sports a P/E ratio of 19.8x and a P/B ratio of 3.7x.
SDEM
Cheap valuations could lead to strong capital gains and market-beating returns if valuations were to normalize. This has mostly not been the case in the past, but could be the case moving forward. Of course, these valuations assume that earnings remain strong, which brings me to my next point.
Risks and Negatives
SDEM invests in emerging market equities. These securities tend to be riskier than average, due to foreign currency risk, corporate governance issues, and weak economic fundamentals. SDEM focuses on emerging market equities with high yields, which tend to be riskier than average: yields would not be high otherwise. SDEM is overweight materials and energy, two risky, volatile industries, with significant exposure to volatile commodity prices. The revenues and earnings of many of the fund’s underlying holdings are strongly dependent on commodity prices, and would see significant drops if prices were to decrease.
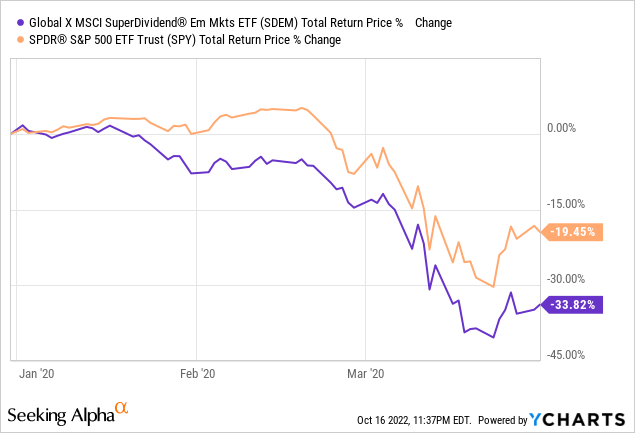
SDEM is an incredibly risky, volatile fund. Investors should expect wild price swings, and significant underperformance during downturns and recessions. As an example, the fund significantly underperformed during 1Q2020, the onset of the coronavirus pandemic.
In my opinion, SDEM is only appropriate for more risk-seeking investors, less appropriate for more conservative investors. Position sizes should be kept relatively small regardless.
I last covered SDEM here.
Latin-America Dividend Equities – ILF
Strategy and Holdings
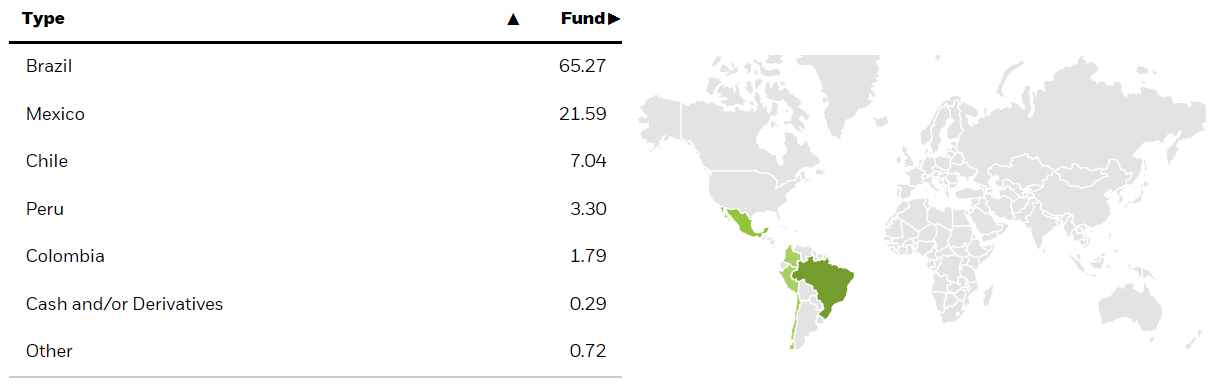
The iShares Latin America 40 ETF (ILF) is an equity index ETF, investing in the 40 largest Latin American stocks, subject to a basic set of inclusion criteria.
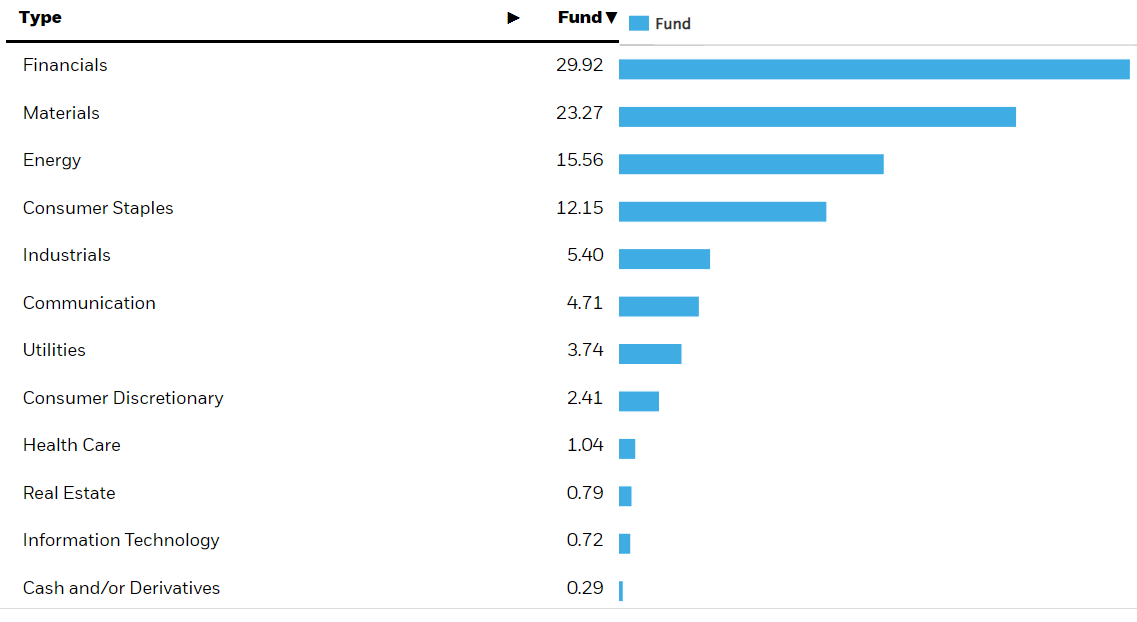
ILF is less diversified than most equity index funds, and that all funds covered in this article, with investments in just 40 securities. Brazil and Mexico account for upwards of 80% of the fund’s holdings. ILF does provide reasonable industry diversification, and is overweight old-economy industries like financials, materials, and energy. ILF is something of a commodities play, partly due to the fund’s significant exposure to the materials and energy industry, and partly due to Latin America’s reliance on the export of raw materials and commodities.
ILF
ILF
Benefits and Positives
ILF’s benefits are quite similar to those of SDEM.
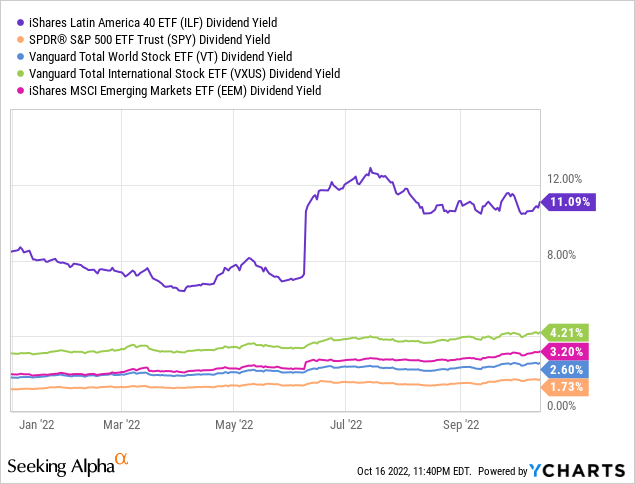
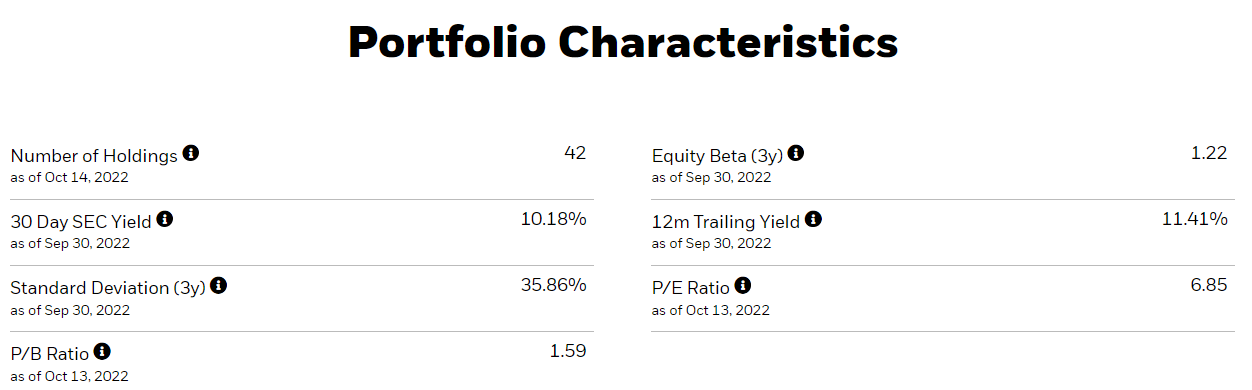
ILF provides investors with a strong TTM 11.1% yield. It is a strong yield on an absolute basis, and higher than that of most broad-based equity indexes.
ILF’s current dividends are mostly covered by underlying generation of income, as evidenced by the fund’s 10.2% SEC yield. Under current conditions, small dividend cuts are likelier than not, although these are ultimately dependent on market conditions moving forward.
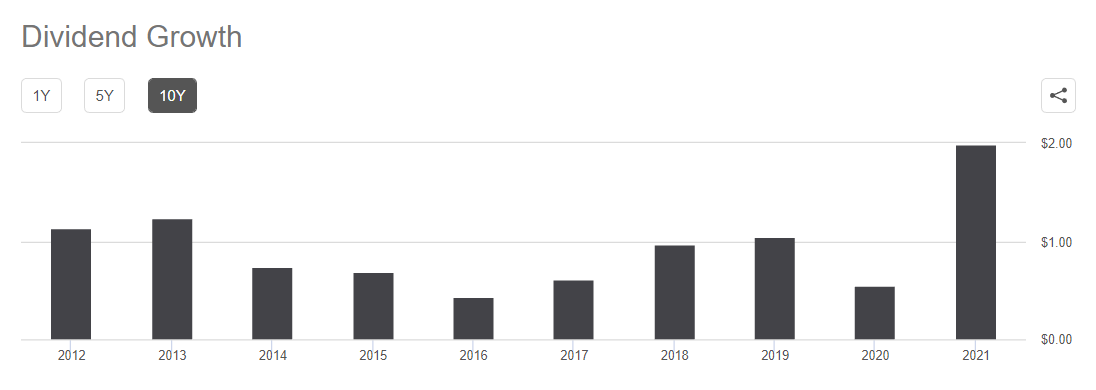
ILF’s dividends are very volatile, and somewhat dependent on commodity prices. Dividends have seen outstanding growth these past two years of strong commodity price growth, but had mostly declined in prior years. Dividend growth has been positive since inception, but entirely concentrated in 2021 and 2022.
Seeking Alpha
LF is a relatively cheap fund, with a PE ratio of 6.9x, and a PB ratio of 1.6x.
ILF
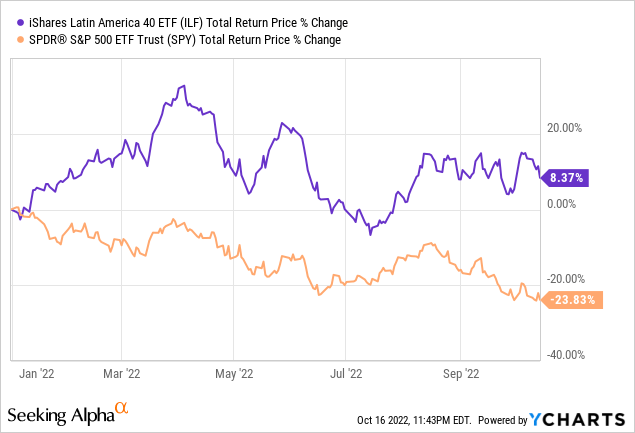
Cheap valuations could lead to strong capital gains and market-beating returns if valuations were to normalize. Valuations have started to normalize, with ILF significantly outperforming YTD. As valuations remain low, further gains are possible.
Risks and Negatives
ILF shares the same risks and negatives as SDEM.
ILF invests in Latin American equities, which are emerging market equities, with all the risks that entails. There is significant foreign currency risk, corporate governance issues, institutional issues, commodity price exposure, and weak economic fundamentals.
ILF is less diversified than its peers, which increases portfolio risk and volatility, and exposes the fund to the possibility of significant losses due to idiosyncratic reasons. ILF should see sizable losses if a couple Brazilian equities underperform, for instance, but the same is not true for most equity index funds.
The issues above could, potentially, impact the fund’s share price and dividends.
ILF is a relatively risky fund, and so only appropriate for more risk-seeking investors, in my opinion at least.
Conclusion
Asset prices have declined YTD, leading to higher dividend yield for most asset classes, securities, and funds. The six funds presented here all offer high dividend yields, which all register in the double-digits on a trailing basis. I view these ETFs as good buys.
Be the first to comment