

Adam Gault
After snapping a five-day losing streak in the prior week, the S&P 500 finished little changed to begin the trading week. This was paired with declines in both the DJIA and the Nasdaq. All three indexes were set for gains on the day but swung to losses later in the afternoon following a report from Bloomberg on Apple’s (AAPL) plans to slow its hiring next year. This release came on top of earlier data from the National Association of Home Builders that showed worse than expected declines in builder confidence.
A strong batch of earnings releases Tuesday morning and favorable commentary from the corporate executives regarding the resilience of the consumer sent indexes to their biggest one-day gains in nearly a month, with the DJIA leading the way higher, up 750 points at close.
The gains carried forward into Wednesday. But this time the gains were led by the tech-heavy Nasdaq, which was up nearly 200 points at close. Contributing to the gains was a jump in the shares of Netflix (NFLX), who reported better than feared results in the day prior. Gains throughout the day held steady, despite economic data earlier in the morning showing record home prices and a continuing trend of declining sales.
A slight reversal occurred early Thursday following the European Central Bank’s (“ECB”) first rate hike since 2011 and economic data showing jobless claims at a new high for the year. Indexes turned higher later in the day, however, with the Nasdaq leading the way up, boosted by shares of Tesla (TSLA), which rose nearly 10% on stronger than expected earnings the day prior.
Though futures were lower in the overnight hours heading into Friday, indexes were still set for weekly gains.
With markets slowly taking back some of their earlier losses, there are still plenty of names trading at or near the bottom of their yearly range. This includes this week’s five laggards, who all have favorable dividend-paying characteristics and inherent features conducive to portfolio protection.
Sun Communities, Inc. (SUI)
SUI is a real estate investment trust (“REIT”) that owns a large portfolio of manufactured housing communities (“MH”) and recreational vehicle (“RV”) resorts throughout the U.S. and Canada. As of June 6, 2022, SUI owned just under 650 properties, comprised of 283 MH communities, 161 RV resorts, 130 marinas, and 72 properties consisting of both MH and RV sites.
In the most recent quarter ended March 31, 2022, SUI reported total revenues of +$548.5M. This was up nearly 25% from the same period last year and about +$90M better than expected.
Overall revenues during the period were lifted by better occupancy and higher base rents. In addition, the portfolio included 41 additional properties during the period.
SUI Q1FY22 Form 10-Q – Property Summary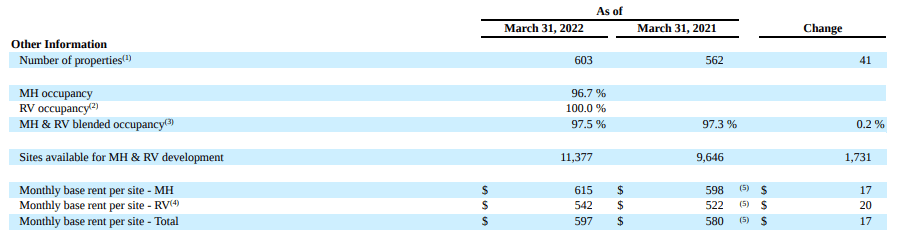
Heightened interest in outdoor recreational activities combined with soaring demand for RVs have benefitted the company and are expected to remain tailwinds moving forward. Same property forward bookings, for example, are 4% ahead of last year for Q2FY22 and 10% ahead for the second half of the year.
Still, shares have pulled back to the lower end of their 52-week range and are currently underperforming the broader market index. Ahead of their earnings release next week, it’s worth noting that the company has consistently beat expectations in prior periods. Investors seeking to initiate a position may find it worthwhile to tune in to the release for signs of continued strength and/or weakness.
Seeking Alpha – SUI Earnings History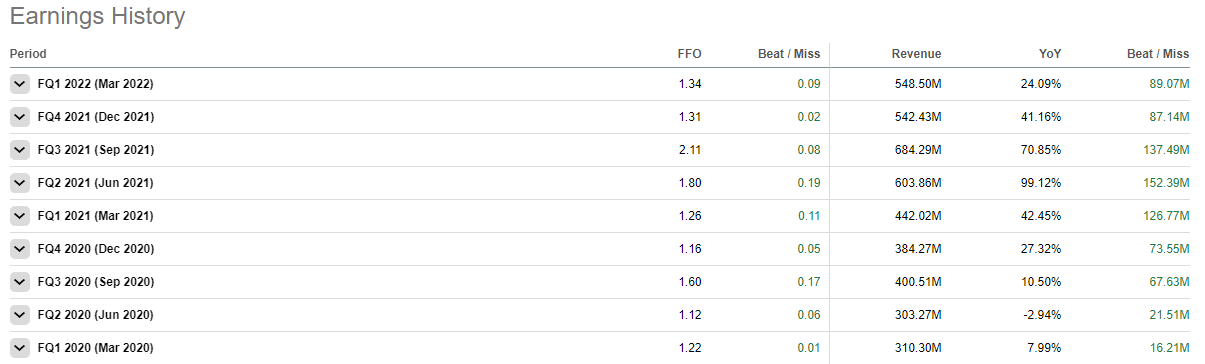
Cincinnati Financial Corporation (CINF)
CINF is an insurance company whose main business is property casualty insurance. At present, they operate five reportable segments: Commercial lines insurance; Personal lines insurance; Excess and surplus lines insurance; Life insurance; and Investments.
Of the five segments, Commercial lines is the largest segment, accounting for nearly 40% of total revenues, which came in at +$9.6B for the full year ended December 31, 2021.
CINF also generates significant cash from operations, +$2.0B in 2021, and operates on limited leverage, at just 6% debt-to-total capital. In addition, they possess significant liquidity that included +$4.8B of cash and equivalents and invested assets at the end of March 31, 2022.
Stable cash flows generated from their core business and the financial flexibility afforded to them by a balance sheet largely unencumbered from debt obligations enables the company to provide continuous dividend payouts to their long-time shareholders. In addition, the payouts have been growing for over 60 years. And in the last five years, they have grown at a respectable compound annual growth rate (“CAGR”) of 6%.
Shares are currently down just 1% YTD versus a decline of nearly 20% in the broader S&P 500. But they have lagged over the past week ahead of their earnings release next week. For investors seeking a reliable dividend growing insurance company for their long-term portfolios, CINF is one worth further attention.
Owl Rock Capital Corporation (ORCC)
ORCC is an externally managed business development company (“BDC”) that focuses on providing direct lending solutions to U.S. middle-market companies. These companies generally have annual EBITDA between +$10M and +$250M and/or annual revenues between +$50M-$2.5B at the time of investment. For investment purposes, ORCC typically seeks to invest in companies with a loan-to-value (“LTV”) of 50% or below.
Revenues are generated primarily in the form of interest income from the investments held by the company. Other income, such as dividends are also earned either through direct equity investments or equity interests obtained in connection with originating loans.
In the most recent filing period ended March 31, 2022, ORCC reported net investment income (“NII”) of $0.31/share, which was in-line with their first quarter dividend and the third consecutive quarter that the company was able to cover their dividend with their net investment income.
Though NII was up 20% from last year, net asset value (“NAV”) was down about 1% from last year due to widening credit spreads.
For income-focused investors, ORCC offers bond-like protection from market volatility and a sizeable dividend payout that is currently yielding nearly 10% at current pricing. With just $3.00 separating their 52-week highs and lows, timing an entry should not pose a challenge, though shares are currently trading closer to their lows than their highs.
YCharts – ORCC’s Recent Share Price History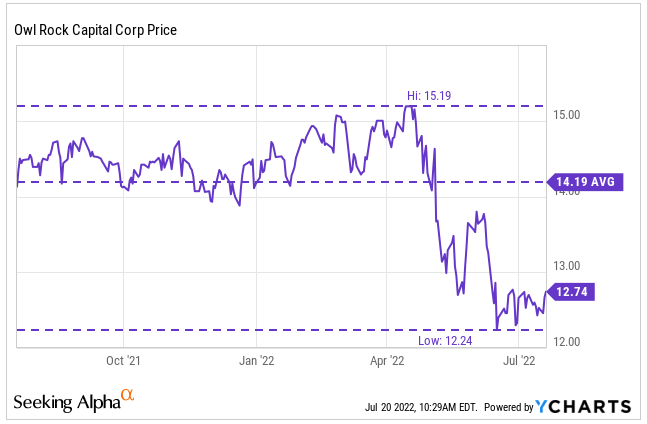
NRG Energy, Inc. (NRG)
NRG is one of the largest competitive energy retailers in the U.S. Their customer base includes approximately 6M home customers as well as commercial, industrial, and wholesale customers, with sales concentrated in 24 states, the District of Columbia, and 8 provinces in Canada.
NRG’s 2021 Investor Day Presentation – Geographical Footprint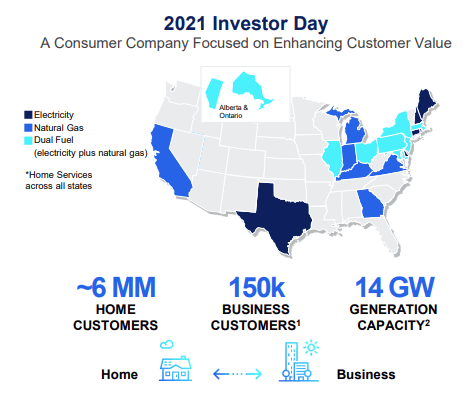
In the first quarter of 2022, NRG reported total revenues of $7.9B, net earnings of +$1.7B, and adjusted EBITDA of +$509M. Though lower than the prior year due to divestitures of certain assets during the quarter as well as the effects of operational outages, the results were generally in-line with expectations. In addition, the company reaffirmed guidance for the full year, despite numerous macroeconomic uncertainties.
Though volatile market conditions have impacted operations, the company is well hedged against rising energy prices through the combination of their own generation portfolio and third-party hedges. The inelastic nature of their business model is further protection against downside risk.
Shares briefly rallied to a mid-forties high but have been pressured down to new 52-week lows following a downgrade from Bank of America on valuation concerns. Yet, shares are presently valued at just 9x forward earnings, a multiple that is significantly lower than their five-year average of 14x. With solid dividend growth and a resilient business model, a further re-examination is certainly well-warranted.
Newmont Corporation (NEM)
NEM is the world’s leading gold company engaged in the exploration for and acquisition of gold properties with significant operations in key regions of the world such as the Americas and Africa.
Historically, gold-related companies have often been associated as a safe-haven during uncertain business cycles. And that appeared to be the case earlier in the year when investors were confronted with the start of the war in Europe, new COVID-related lockdowns in China, and the threat of higher interest rates. As these events unfolded, NEM rose to a record high of $85.
YCharts – NEM’s Recent Share Price History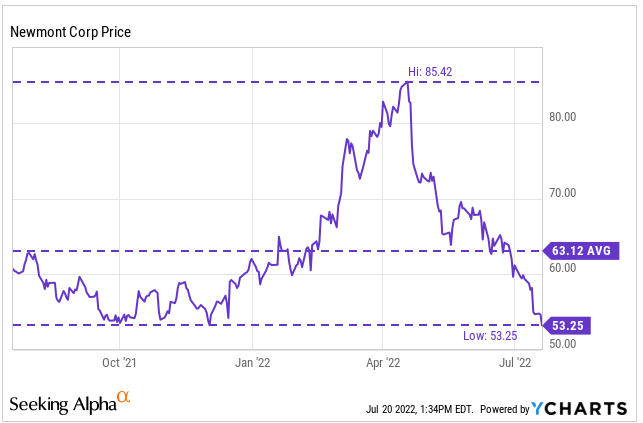
Shares have since fallen nearly 40%, however. This is despite limited reprieve from the ongoing global issues. Partly to blame is the stronger U.S. dollar, which is giving investors an alternative to holding gold, a zero-yielding asset.
With the dollar up significantly against other currencies such as the Yen and the Euro, an eventual pullback is not out of the question, especially in light of the ECB’s first rate hike since 2011 this past Thursday.
Any resulting pullback would likely be accompanied with a corresponding increase in the price of gold, which will ultimately benefit NEM. With shares at 52-week lows and an annual dividend payout yielding over 4%, NEM may be one miner worth a second look.
Conclusion
Though markets trended higher during the past week, there are four laggards this week that can provide portfolio protection at a reasonable price in the event of a renewed downswing.
Both CINF and NRG operate in essential industries characterized by the inelasticity of their product offerings. CINF’s limited exposure to debt is one further advantage that should comfort weary investors.
Though ORCC is more exposed to interest rate-related risks, shares have been remarkably stable over the past year, with a spread of just $3 between their highs and lows. The limited volatility, in addition to an annual dividend yielding nearly 10%, is representative of a bond-like portfolio holding.
While NEM has suffered steep losses since reaching record highs, their line of business has always been thought of as a safe haven during uncertain times. If the U.S. dollar were to pull back from their recent highs, shares would likely rebound higher as gold regains its luster.
For those more bullish on the economic reopening, SUI provides solid exposure to a travel-related industry that is experiencing significant growth on heightened population interest. With an impressive track record of earnings surprises, this laggard is certainly one to keep an eye on.
Even though many stocks rose higher this week, not all have been greeted with the same level of enthusiasm. But perhaps a rally is in order for one of this week’s laggards.
Be the first to comment