

Lurin/iStock via Getty Images
Thin trading volumes marked the start of the week, with each of the major indexes finishing Monday little changed. Economic data showing better than expected increases in durable-goods orders and an increase in pending home sales did little to move markets, as investors generally remained in a holding pattern throughout the day.
Poor liquidity contributed to heightened volatility on Tuesday as indexes swung from early gains to heavy losses, with the DJIA down nearly 500 points at close. Momentum appeared to be lost following the release of the Conference Board’s consumer-confidence survey, which showed outlook on the economy at its lowest point in nearly a decade.
There was a bit of reprieve on Wednesday as investors digested comments from central bankers at a panel in Europe, with special attention given to Federal Reserve Chairman Jerome Powell. While his comments noting that combatting rising rates was more important than recession risk was noteworthy, it did little to move the market, with indexes finishing little changed on the day.
Stocks dropped in the final day of the month and quarter, with all sectors broadly lower on the day. With volumes down, portfolio rebalancing ahead of earnings season was likely one contributor. But other than that, there were no new catalysts during the day.
It was status quo in early premarket trading on Friday, with indexes gyrating between neutrality and further losses. Other than the release of the ISM report, the day was fairly quiet regarding economic data ahead of the long holiday weekend.
With the bear market continuing for another week, there are several names that are approaching deeply discounted trading levels. For long-term focused investors, there are five laggards this week that are worth keeping an eye on in the near-medium term.
Carnival Corporation & plc (CCL)
CCL is one of the world’s largest travel companies with operations in North America, Australia, Europe, and Asia. Throughout the COVID-19 pandemic, CCL, along with other cruise operators were some of the most severely affected companies, as operations came to a grinding halt. The disruption forced the companies into the debt markets to make ends meet. With most carrying significantly more leverage and faced with an uncertain future, the industry has continued to remain under deep selling pressure.
Among the worst performers is CCL, who is down about 56% YTD, with Royal Caribbean (RCL) not too far ahead.
YCharts – YTD Return of CCL Compared to Competitors
The recent declines have put shares at prices last seen during the early days of the pandemic, an operating period significantly worse than the current period.
YCharts – CCL Price History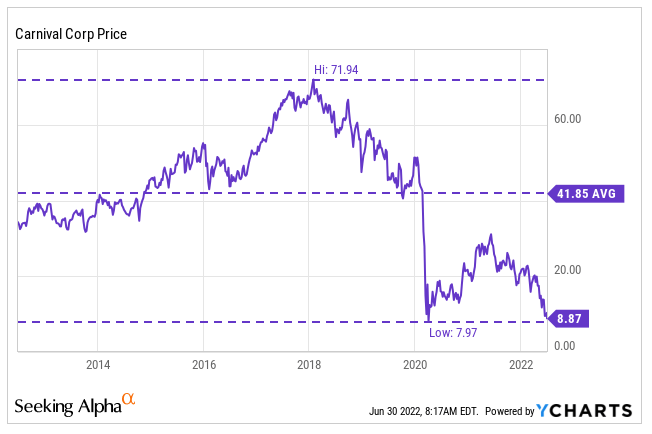
A string of price target cuts from sell-side analysts have contributed to the declines. Concerns primarily focus in on higher financing costs and expected occupancy pressures in future periods. 90% of the company’s fleet, however, is in service and occupancy has increased to 69% in the current quarter from 54% previously.
With travel demand roaring despite inflation, it’s only a matter of time before more travelers begin cruising again, especially due to their relative affordability compared to flying. Additionally, the company also has +$7.5B in available liquidity and is proactively managing their debt maturities. This should provide a safety buffer to the stock. Down over 55% YTD, CCL appears oversold and is worth a watchlist add, at a minimum.
Honeywell International Inc. (HON)
HON is an inventor and leading software-industrial company of critical technologies that are applicable to global integration. The company has four reportable segments; Aerospace; Honeywell Building Technologies; Performance Materials and Technologies; and Safety and Productivity Solutions.
The company has been in business for over a century. During this time, they have successfully navigated through wars, recessions, and public health crises. For the full year ended December 31, 2021, the company reported total net sales of +$34.3B and generated +$5.1B in free cash flow.
Author’s Summary of HON’s Cash Flow Statement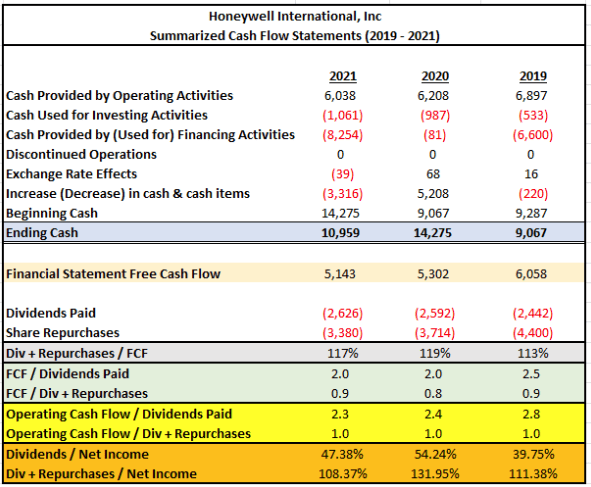
HON also currently pays an annual dividend of $3.92/share, which represents a yield of 2.2% at current pricing. Furthermore, the dividend has been increased 12 times in the past 11 years and is growing at a 3-year CAGR of 6%.
HON has historically been a dependable component of the DJIA, but shares are currently down 10% over the past month, while the index is down 7.5%. This is despite favorable earnings results and revisions upwards on their EPS expectations and the midpoint of their sales range. For investors seeking to add a quality component of the DJIA to their portfolio, HON is one name worth further consideration.
Best Buy Co., Inc. (BBY)
BBY is a technology-focused retailer with two reportable segments, Domestic and International, with the majority of their sales generated domestically. In the most recent filing period, BBY reported total revenues of +$10.7B, which was 8.5% lower than the same period last year but +$220M better than expected.
The pullback in sales in the current period was due to difficult prior year comparisons due to the timing of government stimulus payments, temporary store closures due to COVID-19, and heightened demand for stay-at-home focused purchases.
Gross profit was also impacted in the current period, with margins at 22.1% versus 23.3% in the prior year. This decrease was primarily attributable to increased promotional activity and increased supply chain-related expenses. Still, BBY reported net earnings for the period of +$341M, which was $0.01/share better than expected.
Following their earnings release, the company provided guidance that was less bad than feared. This sent shares on an initial rally to a high of $84. But shares have since fallen to new lows due to weakened market sentiment.
YCharts – BBY Price History
At current pricing, BBY’s dividend is yielding in excess of 5%, which is a yield last seen back in 2015. Furthermore, the dividend has been growing at double-digit rates for the past several years, with the most recent increase being about 25%. For investors seeking to add a discounted retailer with a strong history of dividend growth, BBY may be just the right fit.
Seeking Alpha – BBY Dividend Growth History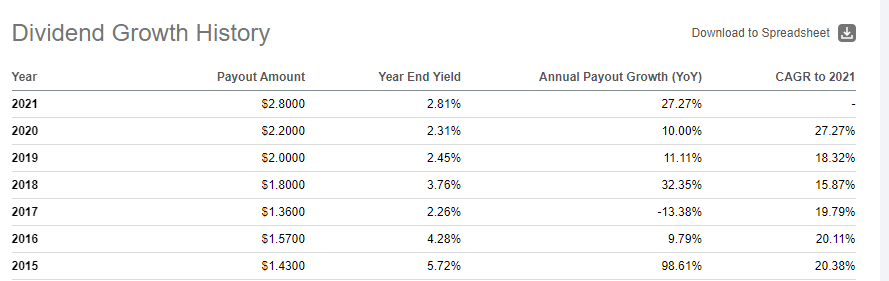
Digital Realty Trust, Inc. (DLR)
DLR is a leading global provider of data center, colocation, and interconnection solutions to customers across a wide variety of industries, including mobile, gaming, cloud, and artificial intelligence, to name a few. At present, it is the 7th largest publicly traded U.S. REIT, with an enterprise value of +$56B.
In the most recent filing period, the company reported total revenues of +$1.1B and net income of +$76.9M. Quarterly core FFO came in at $1.67/share, which was unchanged from prior periods but better than analyst expectations. Furthermore, full-year guidance was reaffirmed after recording record bookings, driven by strong demand for data center solutions.
The company’s balance sheet includes a debt allocation of 25% of total enterprise value. While it is higher than prior periods, it still manageable, considering maturities are well laddered with a weighted average term of 6 years. Furthermore, most of the debt is fixed rate. So, exposure risk to rising rates is minimized.
DLR Investor Supplement – Summary of Total Debt and Enterprise Value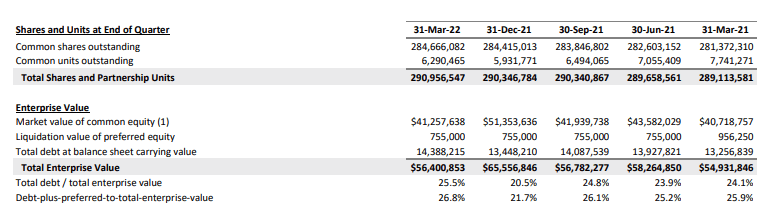
For income investors, DLR has a long track record of dividend increases at 17 years. Currently, the payout is yielding about 3.8% as shares trade just above their 52-week lows. For one of the largest REITs with solid financials and a steadily growing dividend, the current pullback of 7% over the past month presents long-term investors with a potential entry point.
Altria Group, Inc. (MO)
MO’s product offerings include tobacco-based products, such as cigarettes and cigars. Their wholly-owned subsidiary, Phillip Morris USA, is the largest cigarette company in the U.S and has been the leader for over 45 years. In recent years, MO has attempted to improve upon their image among society. This includes their 2030 vision plan, Moving Beyond Smoking, which entails responsibly leading the transition of adult smokers to a smoke-free future or to a transition to less harmful choices.
While the intentions are good, many don’t buy into the plan. This includes the Biden administration, who reportedly is pursuing policies requiring tobacco companies to reduce the nicotine in all cigarettes in the U.S. to nonaddictive levels. With a weaker smoke-free portfolio than peer Phillip Morris International (PM), MO could be more adversely affected by these policies.
With higher gasoline prices forcing some smokers to cut back and analyst downgrades aplenty, shares in MO have fallen to fresh 52-week lows and are now down over 20% in the past month. This has pushed their dividend yield to over 8.5%.
Despite the recent adversity, the company still is an essential business for its users, and the company has proved durable in the past. While tobacco-related stocks may not sit well with some investors, shares do appear to be trading at an attractive discount for those focused purely on personal returns.
Conclusion
With markets continuing to trend lower, some stocks are approaching trading levels last seen during early 2020. CCL is one such example. While there certainly are valid concerns regarding the company, favorable long-term travel trends are likely to support a recovery in the stock at some point in the near-medium term.
Others on this week’s laggard listing are also trading at deeply discounting multiples. BBY, for example, is currently trading at 7.8x forward earnings. This is a sizeable discount to their five-year average of 13.8x. Similarly, MO’s multiple of 8.6x is also significantly lower than its five-year average of 12x.
For investors seeking more tried and true companies, HON and DLR are two with resilient business models that have stood the test of time. HON is a quality component of the DJIA, while DLR is one of the largest publicly traded REITs with a solid history of dividend growth.
As the market volatility continues, any one of this week’s laggards would be fit for further investor attention.
Be the first to comment