

Lurin/iStock via Getty Images
U.S. markets began the week on a quiet note with all three indexes wavering between small gains and losses throughout the day on Monday. U.S. government bonds continued to tumble sending yields to their highest closing level since December 2018. That did not, however, elicit as much movement in equities as in prior days.
On Tuesday, markets came out roaring for the best day in a month for all three indexes, led by the DJIA, which ended higher by nearly 500 points. The enthusiasm was due in part to the overruling of the federal mask mandate on public transportation by U.S. District Judge Kathryn Kimball Mizelle of Tampa. The ruling sent shares in travel-related shares surging, carrying most of the market higher with them. Gains, overall, were broad-based with 10 of the S&P 500’s 11 sectors advancing.
While the DJIA continued its rise on Wednesday, the tech-focused Nasdaq ended lower, driven by the cratering of Netflix (NFLX) after they reported declining subscribership and predicted further losses ahead. The shockwaves from NFLX sent other streaming and stay-at-home names broadly lower for the day. Despite the declines in tech, the Dow remained supported by a strong day from IBM (IBM) and Procter & Gamble (PG), who both reported strong earnings. On the data front, a report released from the National Association of Realtors showed that the median existing-home price rose to a record $373,300 in March.
Volatility increased on Thursday as the day began with gains but ended sharply lower after comments from Fed Chairman Jerome Powell signaled that the central bank was likely to raise rates by a half percentage point at its meeting next month. Fears over the inevitable rate increase sent yields on the 10-year U.S. Treasury note surging to 2.917% from 2.836%. This dragged all three indexes down, with the heaviest losses in the DJIA, which ended lower by about 370 points.
Equities continued to edge lower at the start of the day on Friday as yields continued their rise upwards. The lack of major developments on Friday morning suggested that markets were set for a mixed or muted finish to the week, with the DJIA on pace pre-market to end the week with a 1% gain, despite the heavy losses from Thursday.
The week offered potential buying opportunities on many stocks. For long-term, income-focused investors who seek upside at reasonable risk, there are five stocks this week that would fit well on the watchlist of any diversified portfolio.
Starbucks Corporation (SBUX)
SBUX is a global leader in specialty coffee, with operations in 84 markets. Since their founding, they have grown to be one of the most widely recognized and respected brands in the world. In fiscal year 2021, they reported total revenues of nearly +$30B, which was 24% higher than 2020 and 10% greater than 2019. While revenue growth was only 10% higher than 2019, net income was nearly 20% higher due in part to the company’s cost mitigation efforts.
Over a ten-year timespan, SBUX has significantly outperformed the broader S&P every year prior to 2022.
Annualized 10-Year Returns of SBUX Compared to S&P 500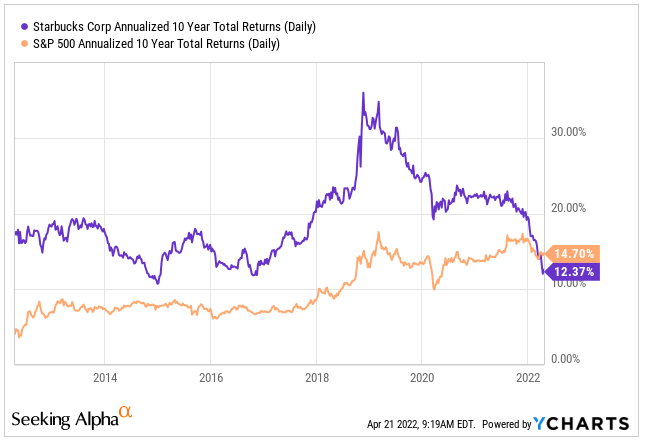
SBUX’s annualized returns over the past three years, however, is only 3.7% versus returns of 17.3% for the S&P. The underperformance is nearly all attributable to events that have occurred since January 2022. In this timeframe, there were leadership changes, such as the departure of Kevin Johnson and the return of Howard Schultz. In addition, the company halted their repurchase program so that they could allocate cash to more employee-centric purposes in response to union mobilization efforts at several of their stores.
In response to these significant changes within the company, the markets have repriced accordingly.
Annualized 3-Year Returns of SBUX Compared to S&P 500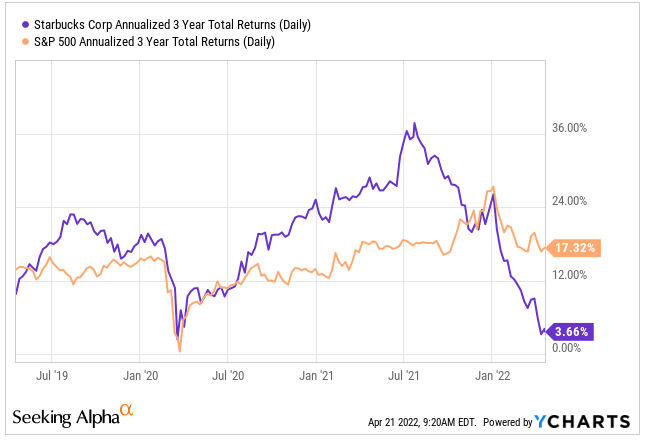
Shares in SBUX are currently trading near their lows with a forward pricing multiple of 24x, which is at a discount to their five-year average of 28.4x. While the valuation still appears high, other factors must be considered as well for their true value prospects. Given their long history and their dominant market position, the company is worth further examination.
Perrigo Company (PRGO)
PRGO is a leading provider of over-the-counter (OTC) health and wellness solutions. The company is headquartered in Ireland, and they sell their products primarily in North America and Europe. Within North America, their product line includes numerous private-label brands that treat a wide variety of ailments and provide self-care in various areas such as digestive health and oral care. Some of their European-branded products include Davitamon, Panodil, and Coldrex, among others.
At the end of December 31, 2021, the company reported +$3.9B in total current assets and +$1.6B in total current liabilities. Of the total current assets, nearly 50% was held in cash. In addition, the company generates sufficient cash flows from operations to fund their investing and financing activities.
The company did, however, report a loss in both 2020 and 2021. But these losses were driven by one-time adjustments, such as a large loss on discontinued operations in 2020 and a significant impairment charge in 2021.
PRGO Income Statement – Form 10-K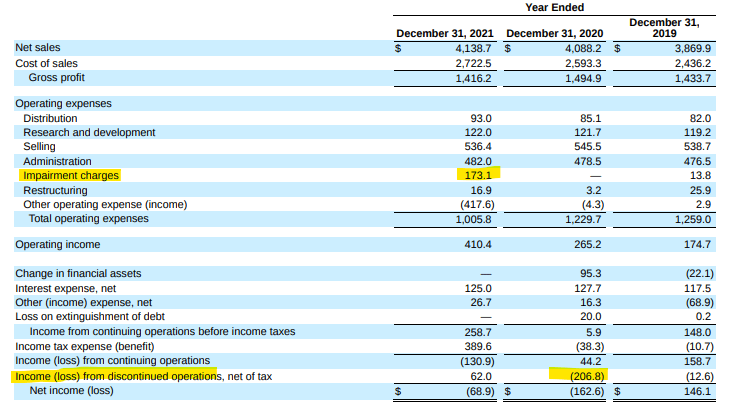
Shares in the stock are currently trading near their 52-week lows and below their historical averages. Additionally, their price/book ratio is currently 0.93x, which is a discount to their five-year average of 1.33x
YCharts – PRGO Price History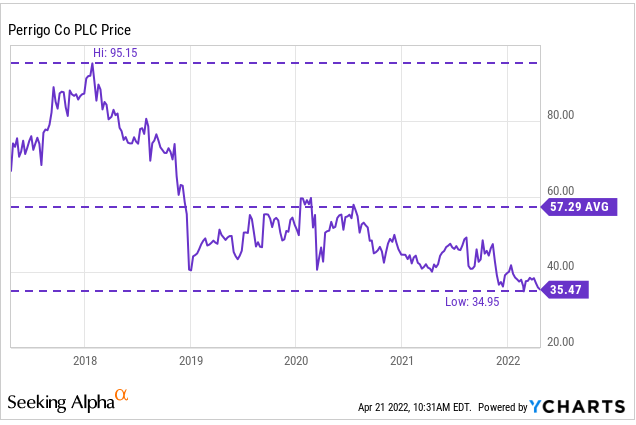
At a current EV multiple of 9x and at a price point at the lower end of their one year range, shares in PRGO look attractive. The company has a long history of dividend increases, and the payout currently yields nearly 3%. At the end of 2021, the payout was yielding 2.5%. A return to those levels would imply a price point of about $42, which indicates upside of about 16%.
Stanley Black & Decker (SWK)
SWK is a diversified global industrial with a leading share in tools and storage, security services, and engineered fastening. Their hand and power tools are widely recognized and used in industrial applications all over the world. In 2021, the company reported +$15.6B in total net sales, which was up about 20% from 2020.
Since its low of $72 in early 2020, shares have rallied higher, supported in part by the surge in individual housing-related projects. Since its peak, however, the stock has been on a downtrend. Over the past one year, shares are down nearly 30% versus a 6% gain for the broader S&P.
YCharts – SWK Price History
Currently, the 200-day moving average is trading above the 50-day, which indicates bearish sentiment. The share price declines have steepened at the start of the year on the prospects of rising interest rates and their implications on the housing market. Shares are beginning to rebound, however, and appear to be closing in on the 50-day average. Whether it can consistently trade above this resistance level will be important to monitor moving forward.
YCharts – SWK 200/50 Day Moving Average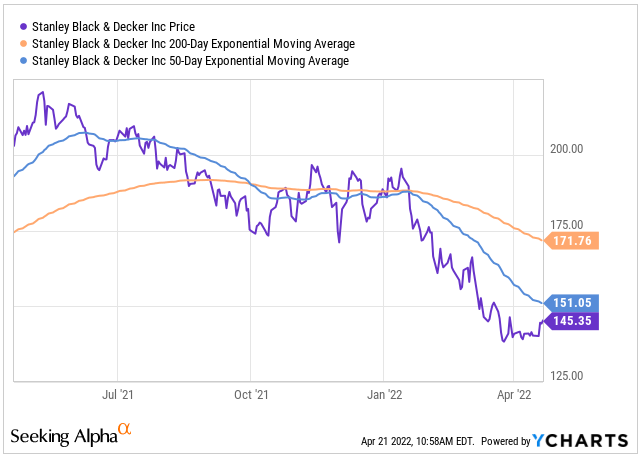
SWK operates a time-tested business in an industry with a favorable long-term outlook. Shareholders have been rewarded for many years with modest returns and a predictable dividend payout that has been increased for over 50 years. At its lows, shares in the stock are worth the effort of extra attention.
Hanesbrands Inc. (HBI)
HBI is an iconic company that offers everyday basic innerwear and activewear apparel. Notable brands within their umbrella include Hanes, Champion, Bali, and Playtex, among others. In 2021, the company reported +$6.8B in total net sales, which was nearly 10% above their estimates for the year. Moving forward, the company expects a 6% CAGR in sales from 2022-2024, which is respectable for a mature company, such as Hanes.
HBI 2021 Investor Day Presentation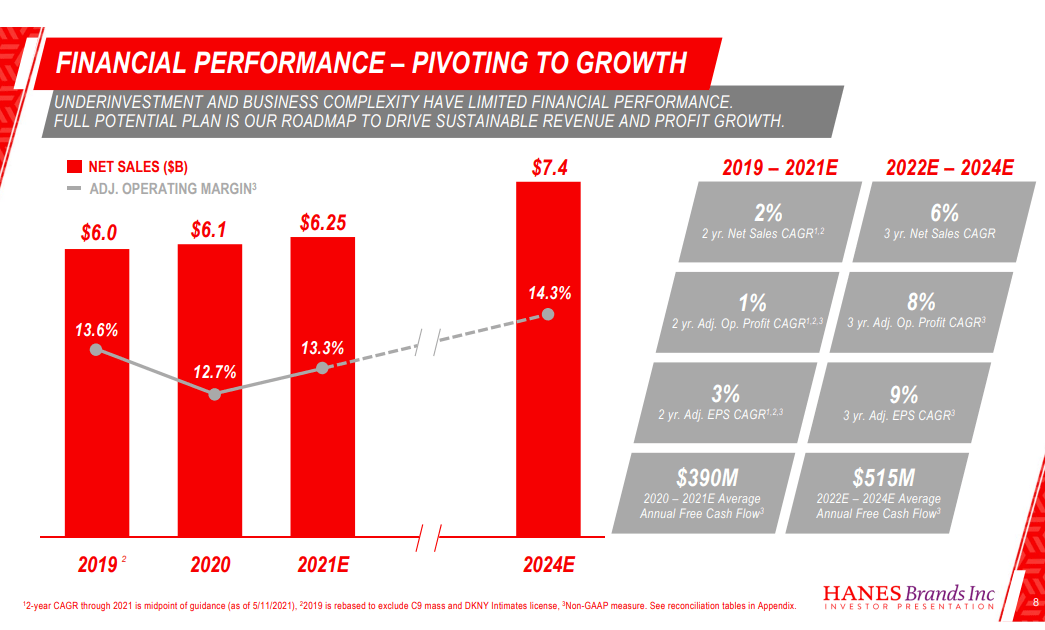
HBI’s profitability metrics compared to similar names within the industry is mixed, but they are notably outperforming on return on equity, which is one indicator of the sustainability of the company’s profitability and dividend growth rates. Additionally, the company is generating over +$500M in cash from operations, which is greater than most of their peers within the industry.
Seeking Alpha Peer Comparison Tool – Profitability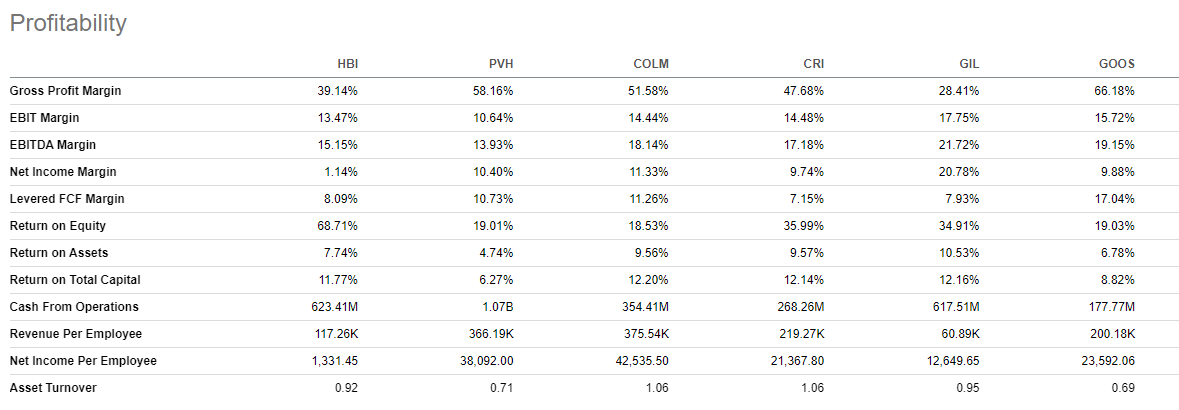
Despite profitability that is generally on par with the industry, shares in HBI are down over 20% in the past year, which is worse than all peers, except Canada Goose (GOOS).
Seeking Alpha Peer Comparison Tool – Total Returns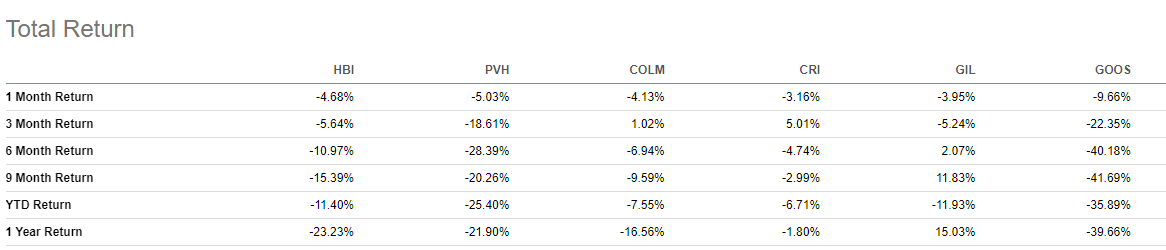
Shares currently are trading near their lows and at a discount to historical valuations. Their current forward pricing multiple, for example, is 8x versus a five-year average of 10.2x. As a vote of confidence in the stock, CEO Steve Bratspies recently purchased $500K of stock at prices between $14.61 and $14.86. Shares have since dropped lower. For investors interested in adding a trusted apparel name to their portfolios, HBI is one potential candidate.
Comcast Corporation (CMCSA)
CMCSA is a global media and technology company with three primary businesses: Comcast Cable; NBCUniversal; and Sky.
In 2021, the company reported +$116.4B in revenue, which was up 12% from 2020 and 6.8% from 2019. Additionally, cash flows from operations were almost +$30B and cash on hand was +$8.7B.
While their net debt of +$98.55B appears high, it is just 2.8x TTM EBITDA, which indicates a moderate level of leverage. Furthermore, the vast sum of debt is due beyond 2026, and the amounts due prior to then appear manageable, given the company’s sizeable balance of cash.
CMCSA’s Summary of Debt Maturities – Form 10-K
Over the past three months, CMCSA has lagged the broader S&P, which is little changed versus a 5% decline in CMCSA.
YCharts – 3-Mth Total Returns of CMCSA Compared to S&P 500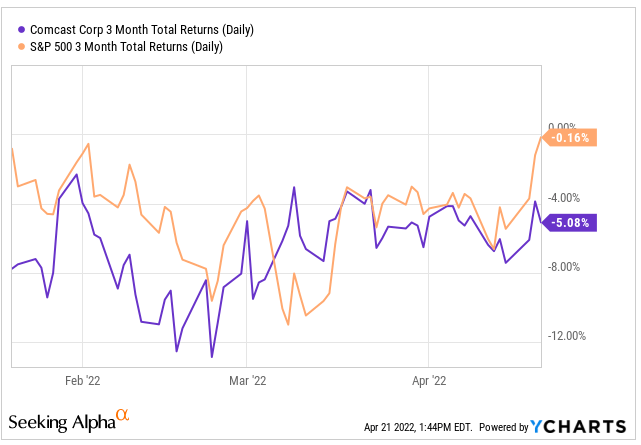
The decline in the shares is despite a long history of outperformance, with the exception of the current period weakness.
YCharts – 10-Year Annualized Returns of CMCSA Compared to S&P 500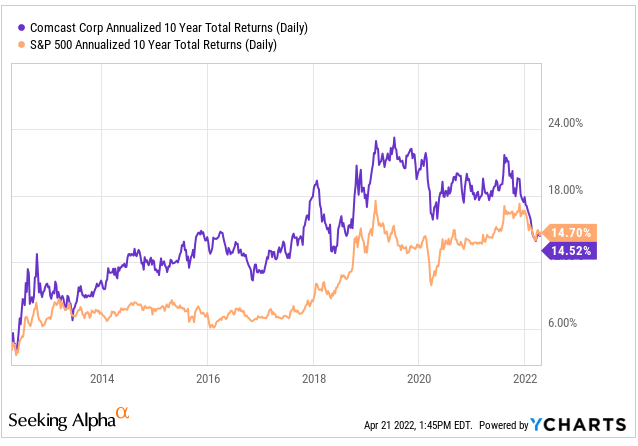
At current valuations, CMCSA is trading at 1.90x sales compared to their five-year average of 2.05x. The average analyst price target has been lowered, but the weighting of the shares still appears to be overweight at many of the firms. At present, the annual dividend is currently yielding 2.28%. Consensus estimates for the annual payout in 2024 is $1.27, which would be a yield of 2.68%. At current yields, the inputted price would be about $56, representing reasonable upside to current pricing.
Conclusion
Established companies with solid fundamentals have historically performed well over the long term. Any declines in the value of these companies are, therefore, worth further examination. PRGO is one company that warrants extra attention, given their significant underperformance.
While further analysis must be performed to obtain a more complete picture of the five companies mentioned above, an attractive opportunity exists for the companies to be added to the watchlist of any long-term diversified portfolio.
Be the first to comment