

Kativ
This article was published on Dividend Kings on Monday, December 5th.
—————————————————————————————
2022 has been a brutal year for investors. Not because stocks are down all that much, but because this is the first year in history when both bonds and stocks are down double-digits simultaneously.
Ycharts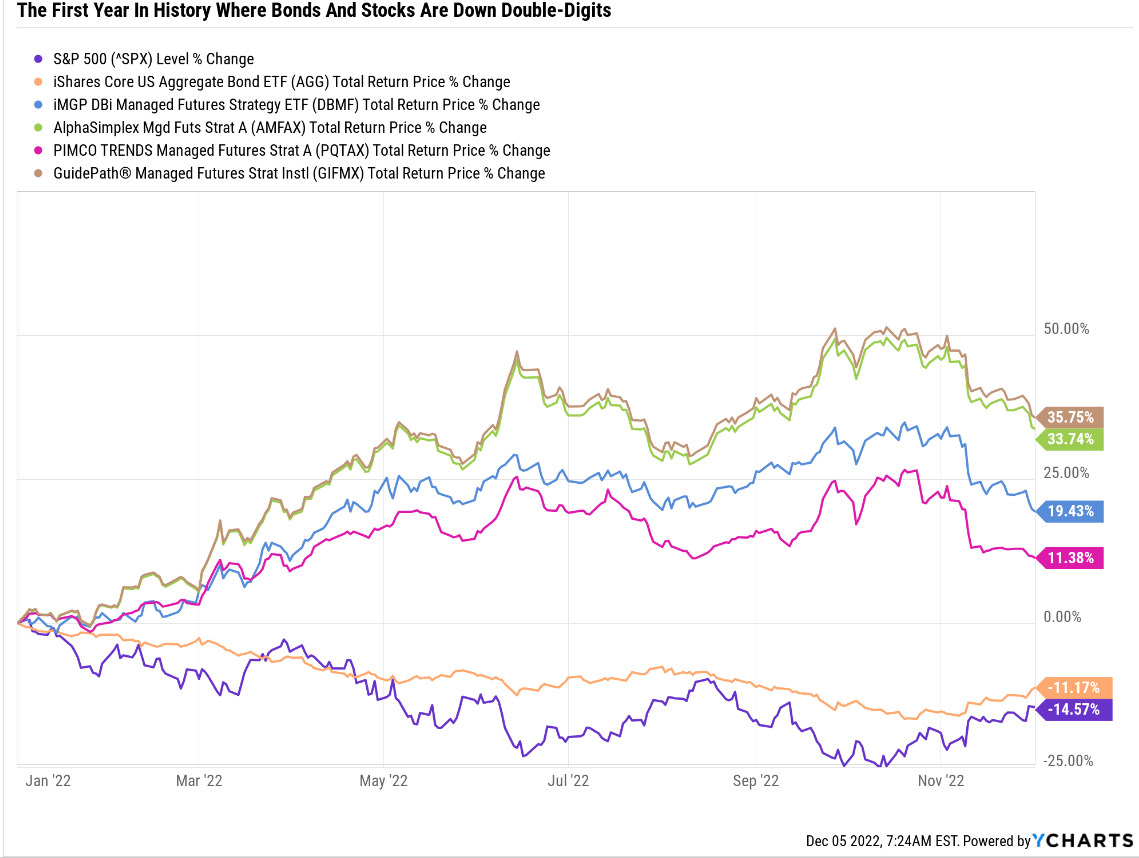
Fortunately, hedge funds, specifically managed futures, are doing what they were designed to do, offering one of the few safe havens in a tough market.
- Avoid These 2 Stocks And Buy This 11% Yielding World-Beater Instead (DBMF deep dive)
- 3 Amazing Dividend Blue-Chips Beating This Bear Market (AMFAX, GIFMX, and PQTAX deep dive)
Why are managed futures such a wonderful diversifier? Because they have no correlation to either stocks or bonds. More importantly, when stocks are falling, they tend to go up.
DBMF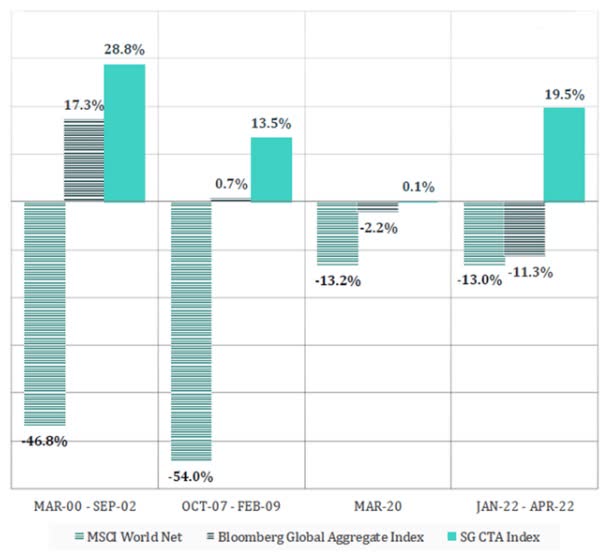
When bonds fall in a stagflationary bear market, they go up. When stocks and bonds both go up during a market crash? Managed futures go up.
Barclays Barclays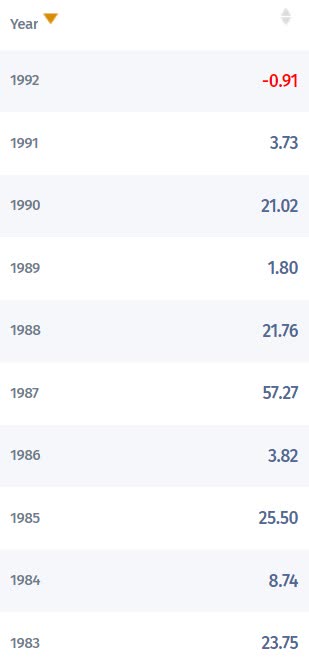
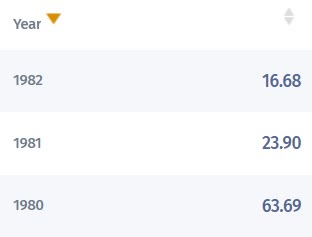
In the 1990 recessionary bear market managed futures soared.
During the 1987 market crash, they soared almost 60%.
During the stagflationary severe bear markets of the early 1980’s they more than doubled.
- 92% of the time, when stocks fall, bonds go up
- when bonds fail, managed futures don’t
But managed futures are just one popular strategy that hedge funds use.
- to go long or short on stocks, bonds, currencies, and commodities
There are many other strategies that hedge funds use, and up until now, regular investors like you and I couldn’t access those.
Bridgewater is the largest hedge fund in history, with nearly $150 billion in assets under management.
Bob Elliott, a former senior executive at Bridgewater, wants to change that.
He’s recently launched The Unlimited HFND Multi-Strategy Return Tracker ETF (HFND), which offers a tantalizing proposition.
One that he claims could give The Dynamic Beta Managed Futures (DBMF) “vanguard of hedge funds” a run for its money.
Several Dividend Kings members have asked me to review this brand-new ETF to see whether it’s worth investing their hard-earned money into.
Here is what my research shows and why I recommend currently avoiding this speculative ETF.
The Promise…And Risks Of HFND
HFND began trading in early October, so it’s naturally speculative because it has no track record to speak of.
However, it’s set up and managed by some very talented hedge fund managers and quants. How do they plan to invest your money?
The fund seeks to create a portfolio with return characteristics similar to the hedge fund industry’s gross fee returns and believes the fund may outperform the hedge fund industry net of fee returns by charging comparatively lower expenses. – Unlimited Funds (emphasis added)
HFND plans to do what DBMF has done for managed futures: to match pre-fee returns and then charge about 4% less than actual hedge funds.
DBMF Shows The Power Of Hedge Fund Replication
DBMF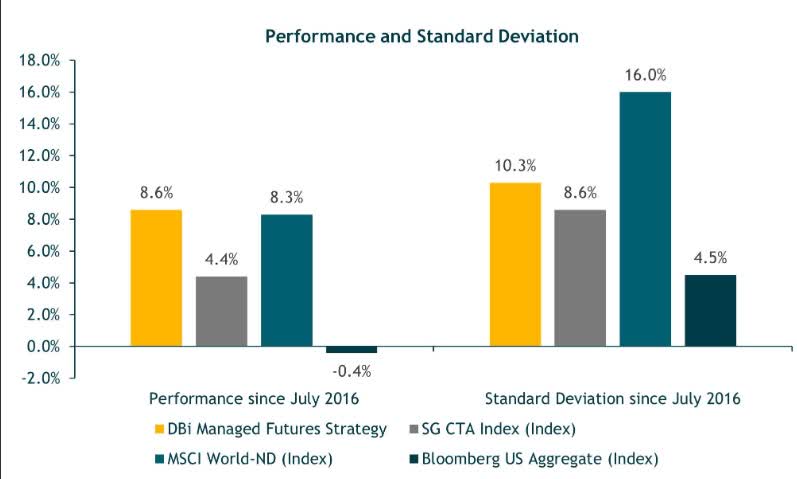
The average hedge fund charges 5% fees and DBMF 0.95%, 4% less. Thus after expenses, it outperformed the Soc Gen managed futures index by about 4%, doing exactly what it was designed to do.
- matching pre-fee returns
- 4% higher post-fee returns
- 63% better volatility-adjusted total returns
- the Vanguard of hedge funds is living up to its promise
DBMF uses a proprietary algorithm that was created with 22 years of market data.
- it determined what allocation to what futures contracts best matches the 20 largest managed futures fund returns over the last two months
- it then tracks this proxy for what the 20 largest managed futures hedge funds are doing
- but with 80% lower fees
DBMF Watch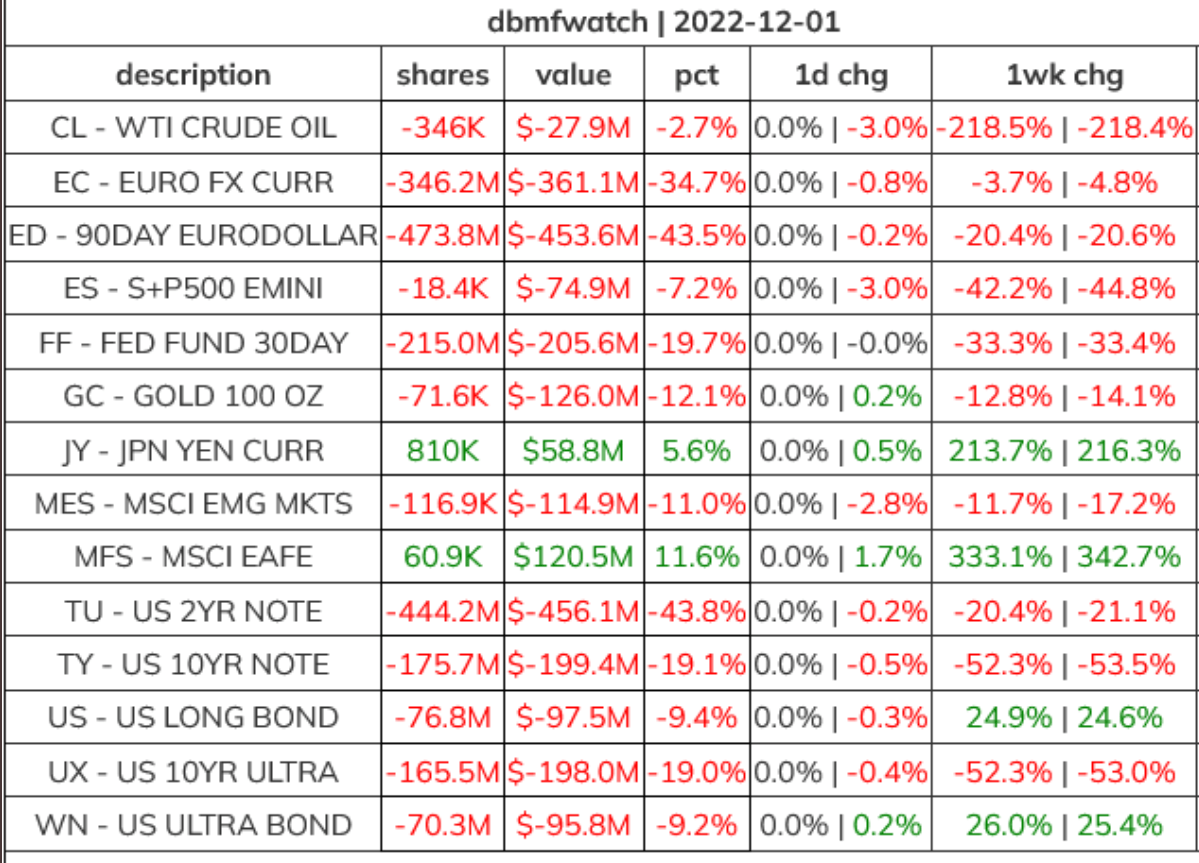
Right now, the 20 largest managed futures fund consensus is:
- very short, the Euro
- slightly long the Yen
- very bearish on bonds (especially short-term bonds)
- bullish on global stocks
- slightly bearish on US stocks
- bearish gold
- slightly bearish oil
HFND wants to use a more advanced machine-learning algo to do what DBMF does for managed futures, but for all hedge fund strategies.
The fund does this by using a proprietary machine learning algorithm to create a portfolio that best matches the most recent month’s returns of each major hedge fund style (such as long/short equity, global macro, event-driven, fixed income arbitrage, emerging markets, managed futures, and multi-strategy). The fund then aggregates these portfolios based on the relative asset levels in each hedge fund style into a total hedge fund industry model. The fund’s investment portfolio generally consists of long and short positions in 30 to 50 Underlying ETFs and futures contracts.
The Fund does not do any of the following: invest in hedge funds, replicate the direct underlying holdings of hedge funds, or engage in certain types of investment activities that are permissible for hedge funds (e.g., excessive use of leverage, have a significant percentage of assets in illiquid investments).” – Unlimited Funds (emphasis added)
Unlike DBMF, HFND plans to own stocks directly via ETFs, a total of 30 to 50 portfolio positions.
It plans to use not just trend following (what managed futures do) but also:
- macro investing strategies (betting on what the economy will do next)
- event-driven (like the Pandemic or 9/11 or GFC)
- bond arbitrage
- and pretty much any other strategy hedge funds like Bridgewater use
Sound promising, right? A more diversified version of DBMF that includes 2X to 5X more positions could potentially profit from the world’s smartest quants and traders on Wall Street.
The Risks Of What HFND Is Doing: De-Worsification
The biggest risk to what HFND wants to do is Buffett’s classic “de-worsification.”
While managed futures use trend following to generate their strongest returns when you need them most (during bear markets and especially during stagflation), the overall hedge fund industry uses many more strategies.
Technically, HFND will be more diversified than DBMF, but that will also mean less powerful hedging.
- When managed futures are working best, HFND will be diluting those returns with strategies that aren’t working as effectively
An equally weighted hedge fund index returned a cumulative 225% from 1997 to 2007 but just 25% over the 2008–16 period.” – CFA Institute
Over the 19 years from 1997 to 2016, hedge funds delivered:
- 306% total returns = 7.7% CAGR
- 164% inflation-adjusted total returns = 5.2% CAGR
Don’t worry about this being less than the stock market; hedge funds and bonds aren’t supposed to keep up with stocks (the best-performing asset class in history).
They are supposed to generate positive inflation-adjusted returns over time and, most importantly, go up when stocks fall.
- a non-correlated asset to stocks
JPMorgan Asset Management 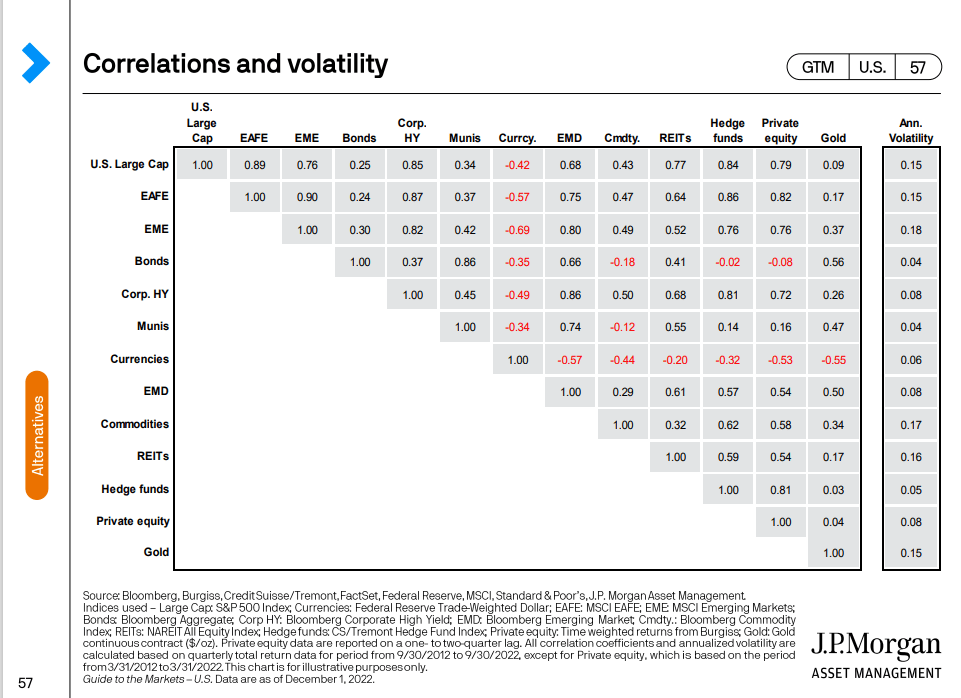
Hedge funds have done a great job in not being correlated to stocks or bonds…but at an average cost of 5% per year.
- historical post-fee returns: 2.2% CAGR
- historical post-free inflation-adjusted returns: 0.2%
- 97% of hedge fund returns go to management in the form of fees
This is the problem HFND is trying to solve. So what kind of total returns can investors THEORETICALLY expect from HFND?
- 7.2% historical hedge fund returns -0.95% expense ratio = 6.2% CAGR
- 3.9% CAGR inflation-adjusted returns = approximately 20X more than hedge funds
Like most hedge funds and managed future ETFs, HFND plans to pay out all of its gains as dividends each year.
- Thus the long-term return will be your yield
- 6.8% yield can be expected from HFND over time
- DBMF historically outperforms managed futures by 4% to 5% per year
- 8.5% to 9.5% CAGR expected returns = 8.5% to 9.5% long-term yield
Very promising indeed. But there’s a catch. First, note that HFND is designed to generate slightly smaller returns than DBMF and thus lower long-term yield.
- to be expected when you diversify hedging strategies instead of using just one
HFND’s entire strategy is based on a proprietary machine-learning algo that CLAIMS can replicate the hedge fund industries pre-fee returns (tracking the last two months).
- They have likely back-tested this for several decades, but it’s still theoretical
- DBMF’s algo has over 3 years of market returns, confirming it does what it’s designed to do
What Makes HFND Speculative And Likely To Crash In The Coming Months
HFND has been trading for about six weeks. Those returns are pretty impressive so far.
Ycharts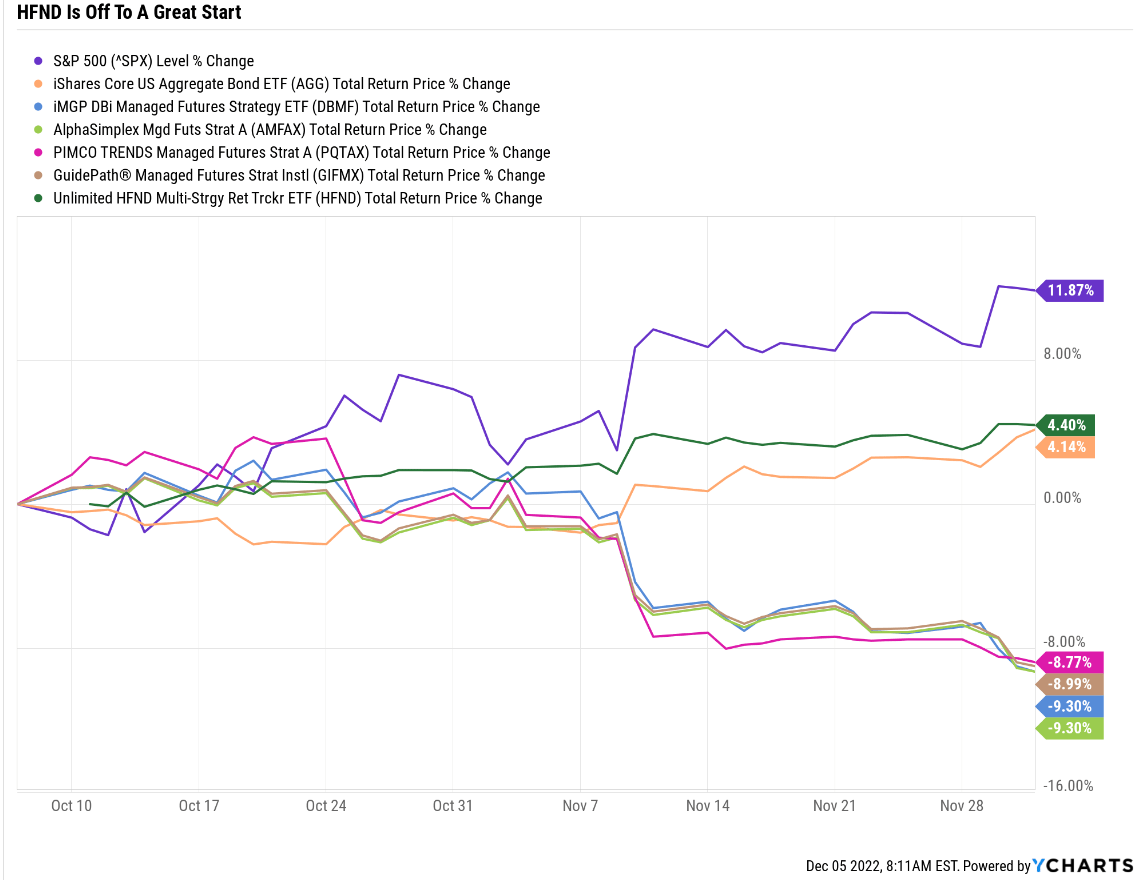
Managed futures have sold off since early October because:
- they are long the US Dollar, and the dollar has been falling
- they are short bonds, and bonds have been soaring
- they are short/neutral on stocks, and stocks are up 12%
What about HFND? What does it own?
HFND Holdings
| Stock Ticker | Security Name | Weightings |
| Cash & Other | Cash & Other | 42.42% |
| VT | VANGUARD INTL EQUITY INDEX FDS TT WRLD ST ETF | 10.28% |
| VMBS | VANGUARD SCOTTSDALE FDS MTG-BKD SECS ETF | 6.71% |
| ICVT | ISHARES TR CONV BD ETF | 5.86% |
| VCSH | VANGUARD SCOTTSDALE FDS SHRT TRM CORP BD | 5.41% |
| VO | VANGUARD INDEX FDS MID CAP ETF | 4.75% |
| JNK | SPDR SER TR BLOOMBERG HIGH Y | 4.67% |
| VWO | VANGUARD INTL EQUITY INDEX FDS FTSE EMR MKT ETF | 4.66% |
| EWA | ISHARES INC MSCI AUSTRALIA | 3.48% |
| VTV | VANGUARD INDEX FDS VALUE ETF | 3.32% |
| XLRE | SELECT SECTOR SPDR TR RL EST SEL SEC | 3.00% |
| BKLN | INVESCO EXCH TRADED FD TR II SR LN ETF | 2.51% |
| DBA | INVESCO DB MULTI-SECTOR COMMOD AGRICULTURE FD | 2.41% |
| XLP | SELECT SECTOR SPDR TR SBI CONS STPLS | 2.40% |
| XLF | SELECT SECTOR SPDR TR FINANCIAL | 2.35% |
| USDU | WISDOMTREE TR BLMBG US BULL | 2.29% |
| VFMO | VANGUARD WELLINGTON FD US MOMENTUM | 2.07% |
| FXA | INVESCO CURRENCYSHARES AUSTRAL AUSTRALIAN DOL | 1.93% |
| FXC | INVESCO CURRENCYSHARES CDN DLR CDN DLR SHS | 1.88% |
| SJNK | SPDR SER TR BLOOMBERG SHT TE | 1.77% |
| VTWO | VANGUARD SCOTTSDALE FDS VNG RUS2000IDX | 1.64% |
| EMHY | ISHARES INC JP MRGN EM HI BD | 1.19% |
| IAU | ISHARES GOLD TR ISHARES NEW | 1.18% |
| XLV | SELECT SECTOR SPDR TR SBI HEALTHCARE | -1.19% |
| XLK | SELECT SECTOR SPDR TR TECHNOLOGY | -1.55% |
| EWJ | ISHARES INC MSCI JPN ETF NEW | -1.79% |
| TIP | ISHARES BARCLAYS TIPS BOND FUND | -1.84% |
| FXE | INVESCO CURRENCYSHARES EURO TR EURO SHS | -1.90% |
| FXF | INVESCO CURRENCYSHARES SWISS F SWISS FRANC | -1.90% |
| FXY | INVESCO CURRENCYSHARES JAPANES JAPANESE YEN | -1.92% |
| VGLT | VANGUARD SCOTTSDALE FDS LONG TERM TREAS | -6.06% |
| Stocks | 29.32% |
(Source: Unlimited Funds)
HFND is so new that it’s still 43% cash:
It uses a lot more currencies than DBMF to be sure, including the Swiss Franc, the British Pound, the Euro, Australian Dollar, and the Canadian Dollar.
However, so far it’s not using options at all, just ETFs.
- options are naturally leveraged so when currencies move a little their values move a lot
- ETFs are NOT the optimal way to diversify/hedge currencies
The same is true of commodities like agriculture, oil, and gold.
- options give you the best “bang for your hedging buck” compared to ETFs
But most importantly, let’s consider what this portfolio would likely have done in 2022.
- very modestly short bonds = not much positive benefit in a soaring rate environment
- long stocks during a bear market
- currency hedging that would have barely moved the needle when the US dollar was soaring
In other words, HFND, had it existed in its present form all year, would have been down, just down less than bonds or stocks.
The goal of hedging assets is to go UP when stocks are falling, not down less.
The entire portfolio falls less because hedging assets go up.
- long duration US treasuries historically go up (92% of the time)
- managed futures go up (almost 100% of the time)
In other words, HFND looks like an entire diversified portfolio (with lots of international stocks and bonds), NOT like a good single stock to hedge your portfolio.
Why HFND Is Likely To Crash Soon
The market has been on fire since it bottomed on October 13th.
Ycharts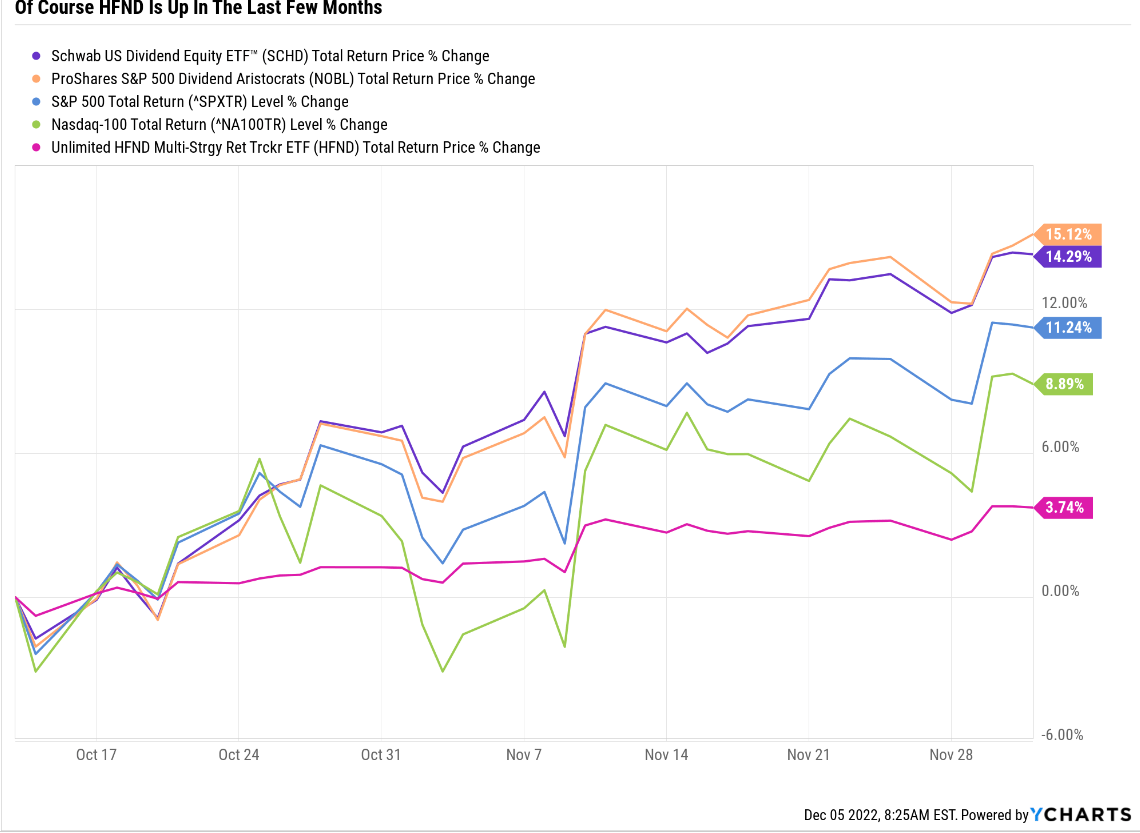
Had HFND been fully invested (that 43% cash allocated across the rest of the portfolio), it would be up approximately 6%.
That’s pretty good, but remember, currently HFND appears designed to fall less than stocks in a down market and rise less than stocks in an up market.
- As currently constructed a poor stock to own if stocks are about to fall off a cliff
Why does the blue-chip consensus expect the S&P to crash in the first half of 2022?
Because the recession hasn’t even started yet!
- based on 18 economic indicators, it’s likely to begin in four to five months
- April or May
Ben Carlson 
Never in US history have stocks bottomed before a recession began.
- historically they bottom halfway through the recession
- peak earnings pessimism
S&P Earnings Watch
| Weekly Decline In S&P EPS Consensus | Last Week’s EPS Consensus | Year | EPS Consensus | YOY Growth |
| 0.00% | $206.27 | 2021 | $206.27 | 50.20% |
| 0.04% | $218.49 | 2022 | $218.57 | 5.96% |
| 0.07% | $230.68 | 2023 | $230.84 | 5.61% |
| 0.33% | $252.21 | 2024 | $253.04 | 9.62% |
| Recession-Adjusted Forward PE | Historical 2023 EPS (Including Recession) | 12-Month forward EPS | 12-Month Forward PE | Historical Overvaluation |
| 21.41 | $190.16 | $230.37 | 17.675 | 4.89% |
(Source: Dividend Kings S&P 500 Valuation Tool)
The average and median EPS decline during recessions since WWII is 13%.
Applying that to the 2022 FactSet S&P EPS consensus, we can estimate next year’s earnings at $190.
- Morgan Stanley base-case 195
- recessionary base-case 180
What does that mean? Stocks aren’t likely trading at 17.7X forward earnings, a 5% historical premium, but 21.4X forward earnings.
- a 27% historical premium
- Jan 4th, 2022, market peak PE: 21.5
Stocks are now trading at the same valuation as they started the year at. And the peak pessimism in EPS isn’t expected until Q1 or Q2.
- most companies haven’t started offering 2023 guidance
- they are expected to start in January
- and guide conservatively
This is why the blue-chip consensus is for the S&P 500 to bottom at 3,000 to 3,400.
S&P 500 Correction Watch
| All-Time High | 4,819 |
| Current | 4,071.70 |
| Distance From High | 15.51% |
| Pullback Level | 4578.05 |
| Correction Level | 4337.10 |
| -15% Correction Level (Historically Average Correction Bottom) | 4096.15 |
| Bear Market Level (-20%) | 3855.20 |
| -25% Bear Market | 3614.25 |
| -30% Bear Market | 3373.30 |
| -35% Bear Market | 3132.35 |
| -40% Bear Market | 2891.40 |
| Distance To Pullback | -10.5% |
| Distance To Correction | -5.5% |
| Distance To 15% Correction | -0.6% |
| Distance To Bear Market | 5.32% |
| Distance To -25% Bear Market | 11.2% |
| Distance To -30% Bear Market (Morgan Stanley Base-Case Bottom) | 17.2% |
| Distance To -35% Bear Market (Average Historical Recessionary Bear Market Low -36%) | 23.1% |
| Distance To -40% Bear Market (Morgan Stanley recessionary bear market estimate) | 29.0% |
| Decline To Historical Fair Value | 4.4% |
(Source: Dividend Kings S&P 500 Valuation Tool)
Which is a 17% to 29% decline in the first half of 2023.
- Morgan Stanley base-case: 3,300 in February or March
- Goldman Sachs base-case: 3,150 in June or July
- UBS base-case: 3,200 in June or July
Stocks could fall nearly 30% within a few months, a worse decline than we’ve seen so far. That would be 100% historically normal.
- historically the last 3rd of a bear market is the fastest decline
- with the most volatility
Does that mean that no one is bullish on stocks?
Ritholtz Wealth Management, Fidelity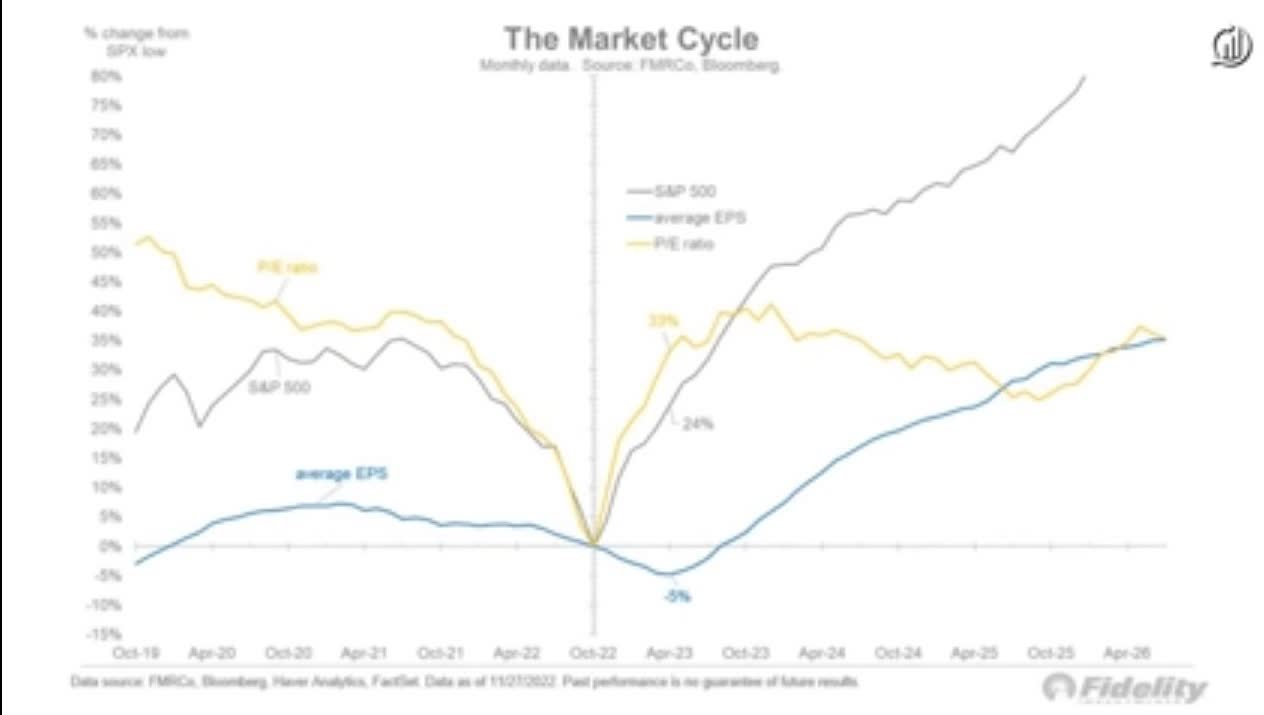
No, Fidelity thinks that, historically speaking, we’ve probably bottomed in October.
JPMorgan thinks we’re likely to retest the October 13th lows but not break below them.
But the majority of blue-chip firms? Including, Morgan Stanley, the most accurate forecaster of 2022, according to Bloomberg, think we’re in for a rough start to 2023.
Five Dividend Stocks Likely Set To Soar In The First Half Of 2023
OK, so HFND and its stock-heavy portfolio isn’t a great place to hide if stocks fall 17% to 29%.
Does that mean DBMF or other 4 or 5-star managed futures funds are better? Most likely, yes, but they aren’t the ideal option.
Why? Because in recent weeks, managed futures funds have remained bearish bonds and only gradually started to shift out of the strong dollar trade.
- DBMF likely won’t go long bonds until early 2023
Morgan Stanley’s basic advice for general investors for 2023:
- long duration US treasury bonds in the first half of 2023
- long stocks in the 2nd half of 2023
Why?
Daily Shot 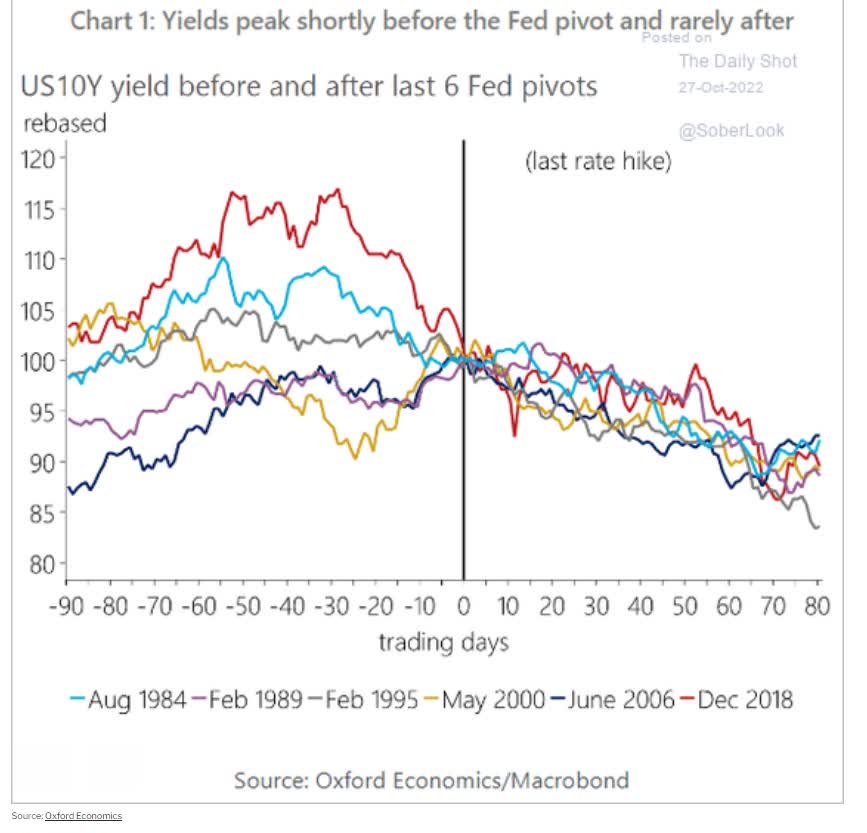
Because the Fed is expected to finish hiking rates in March or May, and bond yields historically peak one month before the Fed finishes hiking.
- range of plus or minus four months
In other words, bond yields have likely already peaked because inflation is now falling, and the bond market is pricing in a 100% chance of a recession in 2023.
Duke University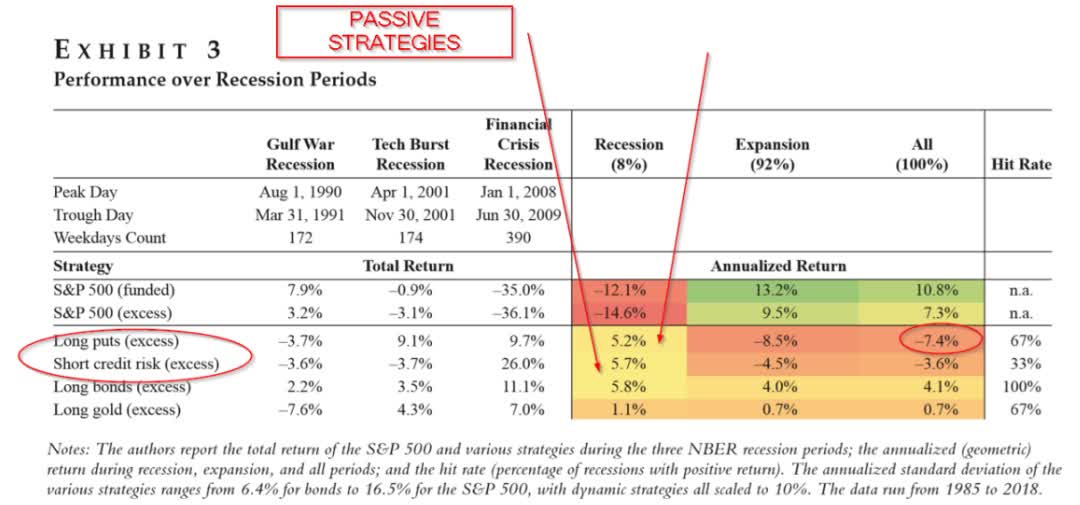
According to Duke University, long-duration Treasury bonds are the single best passive hedging strategy outside of stagflationary times of rising interest rates.
- goes up the most in recessions
- provides the best positive long-term returns
There is no more effective long-term hedging strategy than long-duration US treasury bonds like:
- PIMCO 25+ Year Zero Coupon U.S. Treasury Index Exchange-Traded Fund (ZROZ) 28 duration (the longest duration bond ETF on Wall Street)
- Vanguard Extended Duration Treasury ETF (EDV) 25 duration
- iShares 20+ Year Treasury Bond ETF (TLT) 17 duration
- Vanguard Long-Term Treasury ETF (VGLT) 16 duration
- SPDR Portfolio Long Term Treasury ETF (SPTL) 16 duration
I personally like EDV and ZROZ the most because they offer the longest duration and, thus, the most hedging power in recessions.
Pandemic Crash
Ycharts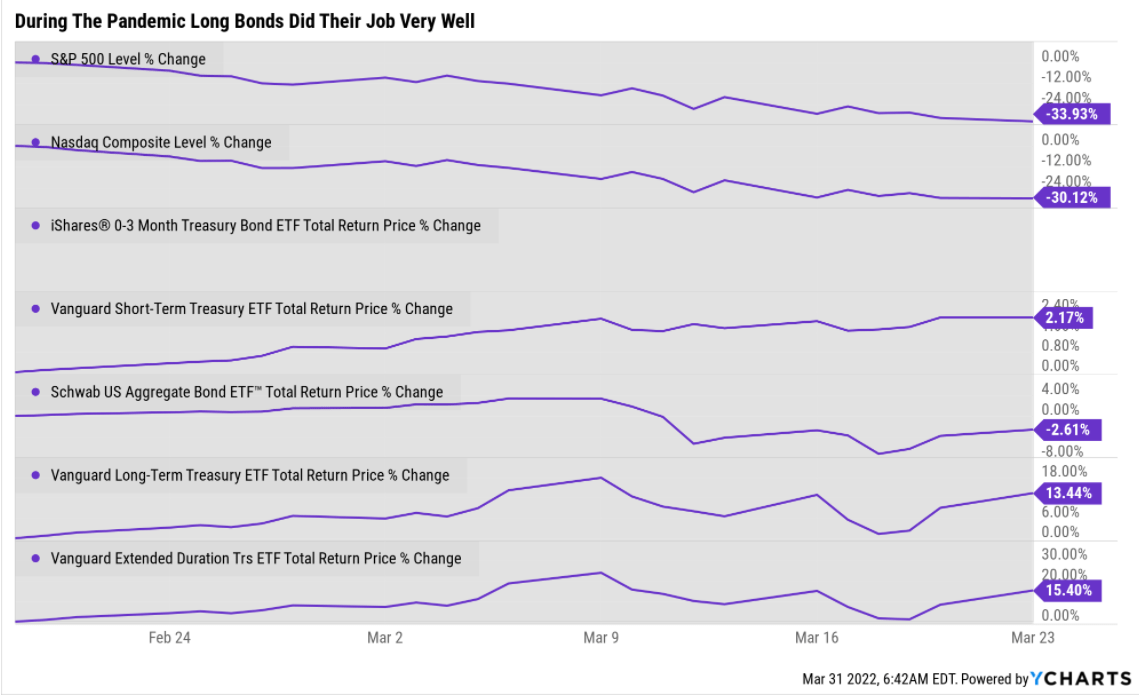
During the Pandemic crash, stocks fell 34% while long bonds went up 15%.
Dec 2018 Recession Scare Bear Market
Ycharts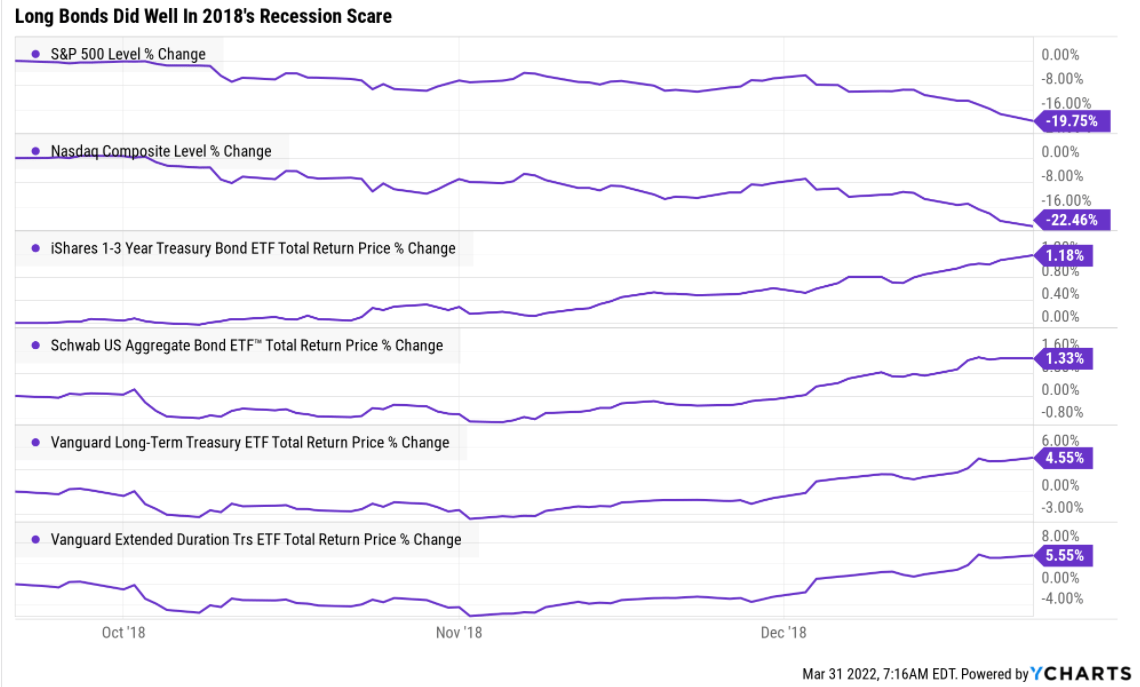
In the 2018 bear market, stocks fell as much as 21% intra-day while long bonds rose 6%.
2011 Bear Market
Ycharts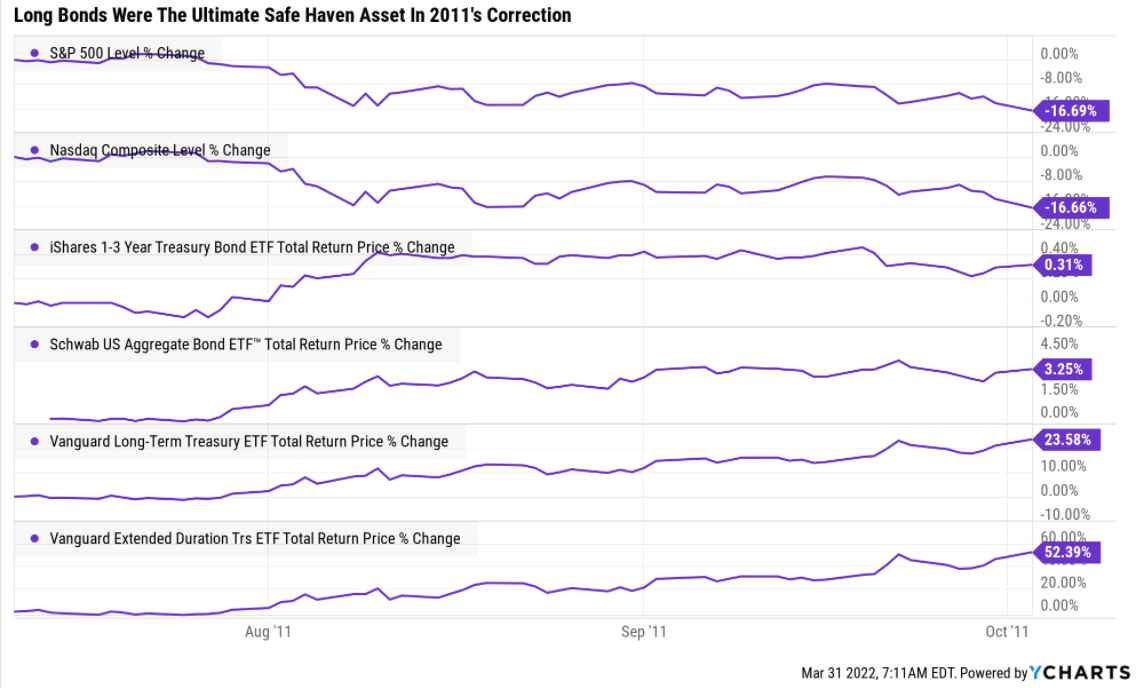
During the 2011 22% bear market (intra-day low), long bonds soared 52%.
Great Recession
Ycharts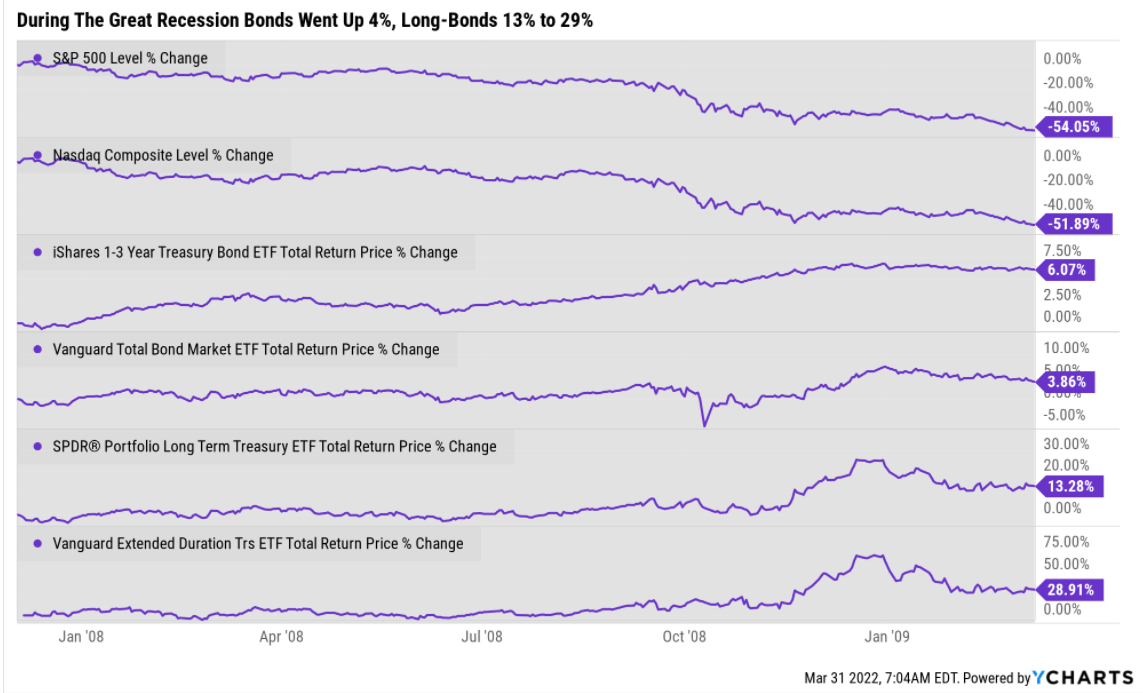
In the 2nd largest market crash in US history, stocks hit a -58% intra-day low during the Great Recession.
- All bonds: +0.7%
- managed futures: +13.5%
- long duration bonds +29% (peak up 70%)
Bottom line, if you agree with the blue-chip consensus that bond yields are likely to fall in 2023’s recession (as they have in 92% of recessions since WWII), you want to own long-duration US treasuries.
- Morgan Stanley’s #1 recommendation for clients right now
What about managed futures?
Bonds Beat Managed Futures During The Great Recession
Ycharts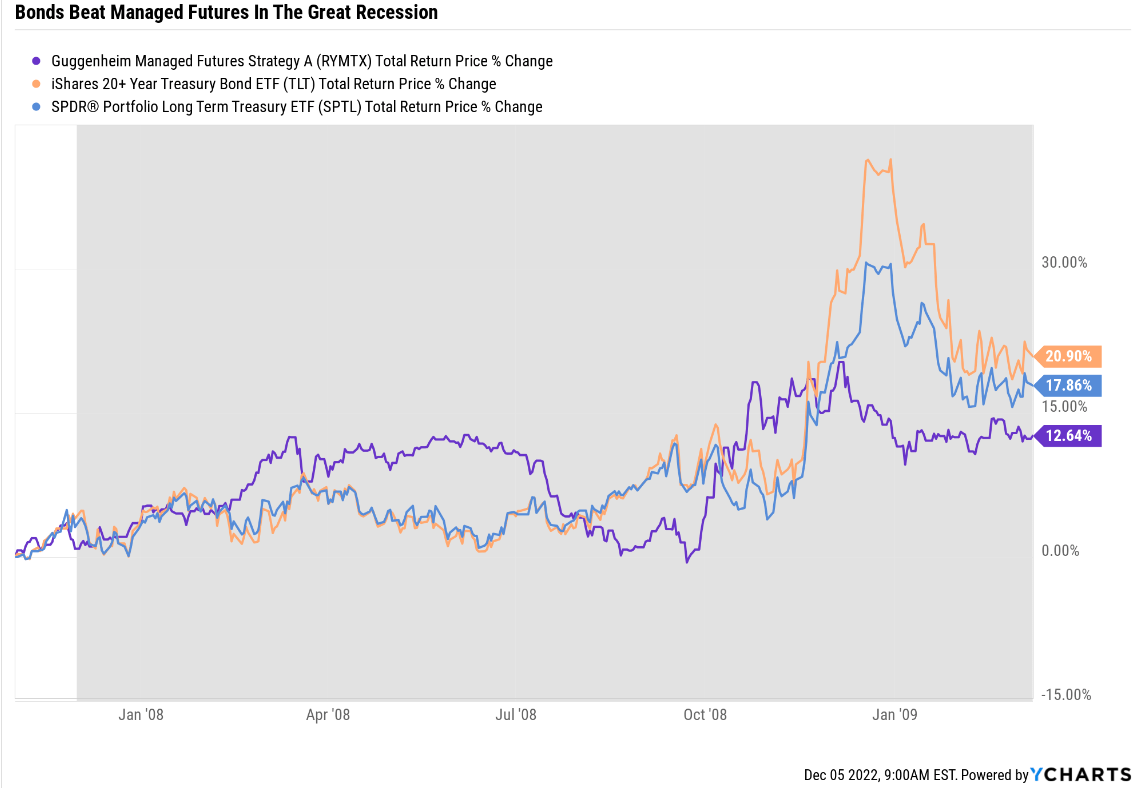
Bonds Beat Managed Futures During The 2011 Bear Market
Ycharts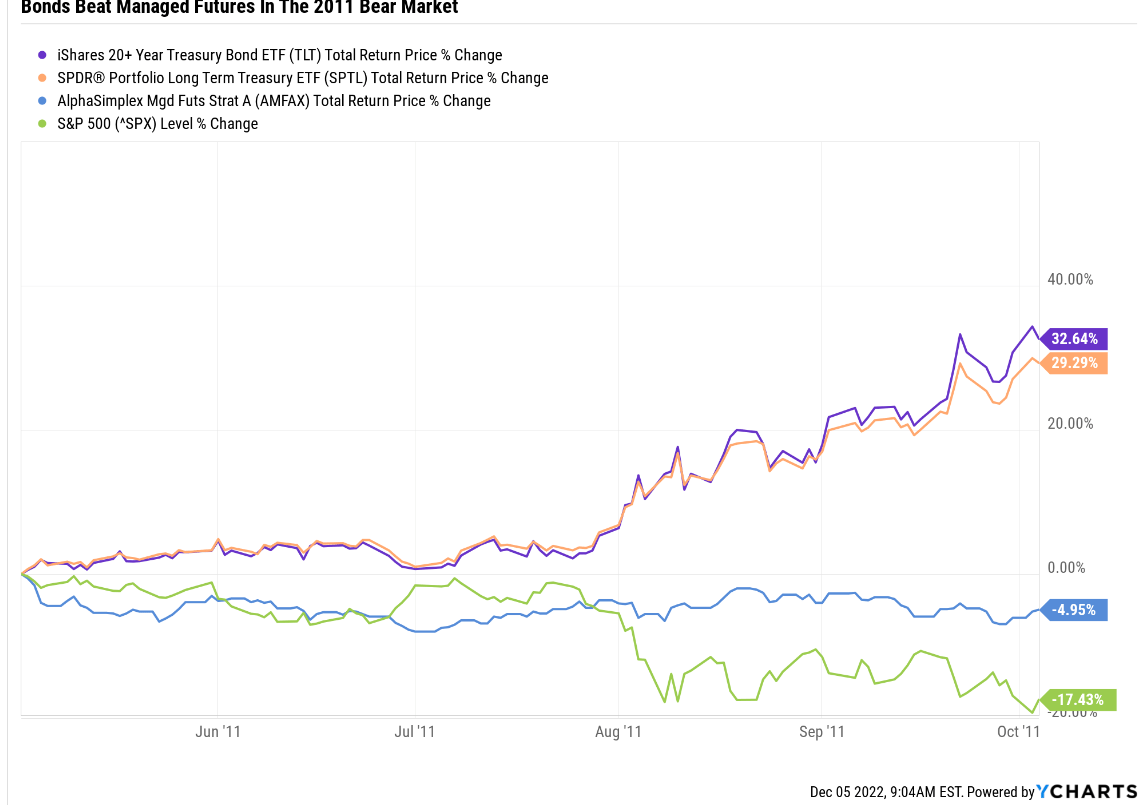
Bonds Beat Managed Futures During The 2011 Bear Market Except For PIMCO’s
Ycharts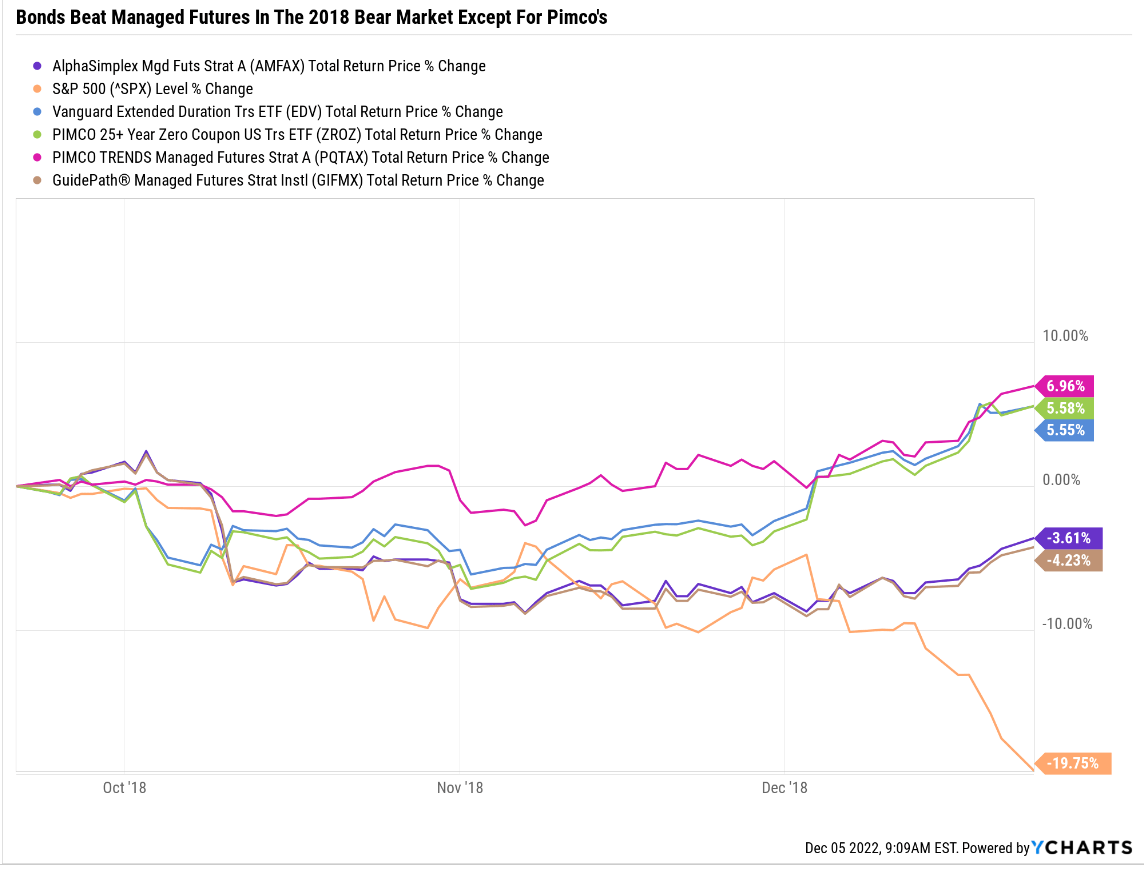
Bonds Beat Managed Futures During The Pandemic Bear Market
Ycharts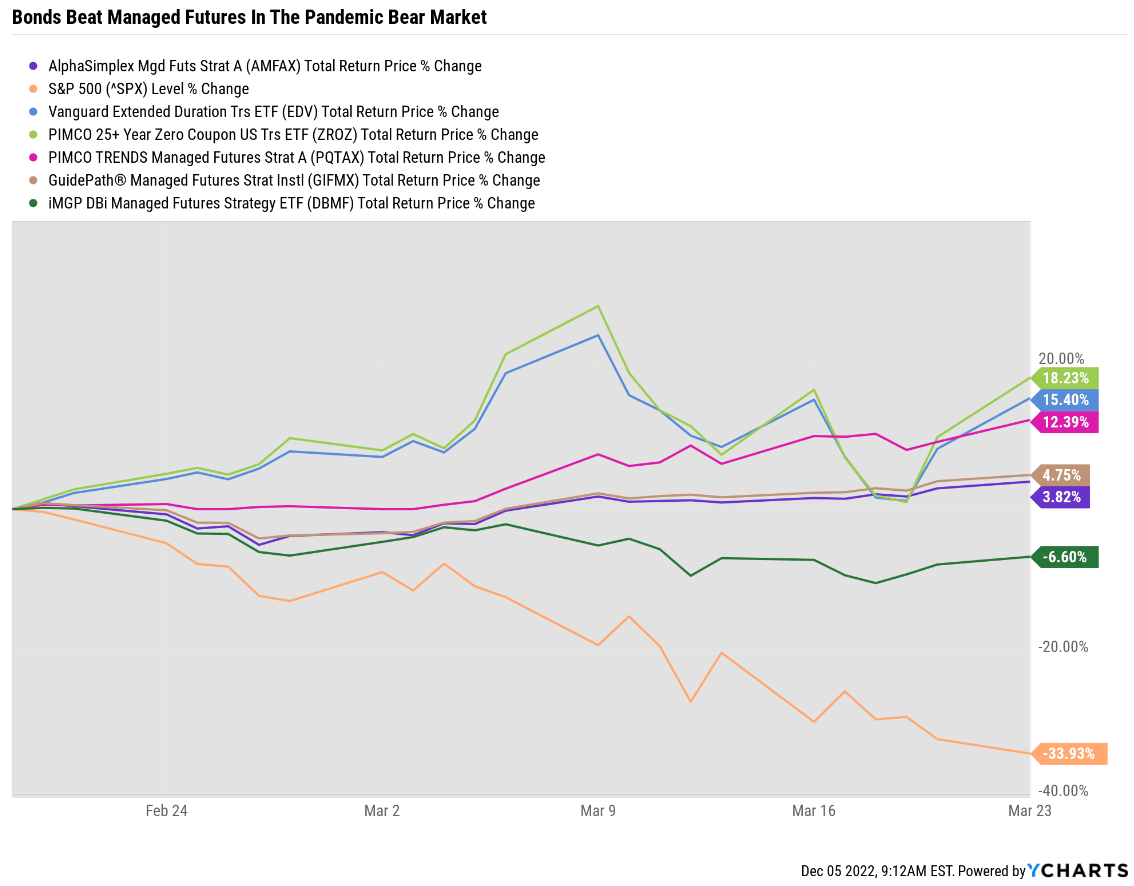
Why own managed futures at all if long bonds are the best long-term hedging asset?
- bonds are always a “risk-off” asset
- when stocks are roaring higher, bonds will often go down or deliver modest returns (4% CAGR since 2000)
- managed futures shift their strategies to follow the trends (long stocks in a bull market)
- historical returns for managed futures 9.5% pre-fee (4.5% post-fee) vs. 4.0% CAGR bonds since 2000
The post-fee returns for 4 or 5-star managed futures funds are 6% to 8.5% CAGR historically, a level of returns bonds can never match over the long term.
Bottom Line: HFND Is A Speculative Hedge Fund ETF Likely To Crash In The Coming Months, While Long-Duration Treasury ETFs Are Set To Soar
No one knows the future, but we can use economic data and historical trends to get a good idea of where interest rates and, thus, bond yields are likely to go in the first half of 2023.
- Nomura and HSBC base cases are 30-year bond yields will fall to fall from 3.6% to 2.5% in the 2023 recession
- 18% to 31% rally in long bond ETFs
In other words, one of the most hated asset classes of 2022 could be set to become one of the hottest in the coming months.
- Thanks to the Fed putting us into a recession on purpose
Managed futures will eventually follow the new trend of bonds up and yields down but will likely be slightly negative or flat in the first half of 2023.
And HFND? It will likely crash in the first half of 2023 thanks to its stock-heavy strategy and lack of leveraged futures contracts on its diversified bet against the US dollar.
Ultimately most asset managers (like Schwab, Fidelity, and PIMCO) and I recommend a diversified portfolio that includes stocks, bonds, and alternatives like managed futures.
- blue-chip consensus 5% to 20% managed futures
- replacing 5% to 20% of your bond allocation
That way, you can sleep well at night in all economic, inflation, interest rate, and market conditions, including stagflationary ones.
Is it possible that HFND will be a great hedge fund ETF in the future? Possibly, its fundamental strategy seems sound, and it could deliver around 7% long-term returns and a 7% yield over time.
But until we see how HFND’s final version will look, once it invests its 43% cash and we see how it performs in several bear markets, it’s just a potentially attractive hedging asset.
In its current version, one that is too speculative and badly positioned for the coming market correction to recommend to readers and Dividend Kings members.
Be the first to comment