

peshkov
This article was originally published on Dividend Kings on Tuesday, January 17th, 2023.
—————————————————————————————
Recession is likely coming in 2023. How can we tell?
- the most inverted yield curves in 40 years
- 85% of CEOs expect a mild one
- 85% of economists working with the Fed expect one
The economic data, except for the jobs market, is rolling over hard. For example, the Empire State Index, which is a monthly survey of manufacturers in New York State, was expected to be -7.2 for January. It just came in at -32.9.
The overall economic picture, as measured by 18 economic indicators, including nine leading indicators, points to a likely economic contraction within two to four months.
What about the strong job market? While it’s true that if we can avoid negative jobs reports and wages keep growing we are likely to avoid recession, jobs are a lagging indicator.
In the late 70s, we had eight months of positive job growth during the recession.
The good news is that the coming recession is likely to be mild. The better news is that even if it ends up being severe, there are plenty of safe high-yield blue-chips that you can buy today and sleep-well-at-night no matter what is coming next.
Let me show you why 4% yielding Royal Bank of Canada (NYSE:RY) is the ultimate high-yield Ultra SWAN (Sleep-well-at-night) bank for this recession.
In fact, it’s the safest bank in the world according to rating agencies and has a 4% yield retirees can trust, barring anything short of the apocalypse.
Reason One: Royal Bank of Canada Is The Safest Private Bank On Earth
Each year Global Finance Magazine puts together a list of the world’s safest banks based on the combined credit ratings of S&P, Fitch, and Moody’s.
Those credit ratings, while obviously not perfect (see the AAA-rated toxic mortgage fiasco during the GFC), are based on over 100 years of bond default data.
Global Finance
RY scores #11 among the world’s safest banks but #1 among private banks. The top 10 are government-owned banks you can’t invest in.
Royal Bank Of Canada Credit Scores
| Rating Agency | Credit Rating | 30-Year Default/Bankruptcy Risk | Chance of Losing 100% Of Your Investment 1 In |
| S&P | AA- Stable Outlook | 0.55% | 181.8 |
| Fitch | AA- Stable Outlook | 0.55% | 181.8 |
| Moody’s | Aa1 (AA+ Equivalent) Stable Outlook | 0.29% | 344.8 |
| DBRS | AA-High (AA+ Equivalent) | 0.29% | 344.8 |
| Consensus | AA Stable Outlook | 0.4% | 238.1 |
(Sources: S&P, Fitch, Moody’s, DBRS)
Four rating agencies estimate the risk of RY going bankrupt in the next 30 years at 0.4% or 1 in 238.
Another way to think of that is the rating agencies think it will take about 7,140 years for RY to realistically go to zero.
Or, to put it another way, the world’s best risk rating agencies think RY will survive for millennia and outlive not just us but our great, great, great (353 more greats) grandchildren.
Why?
Reason Two: Royal Bank of Canada Is Built To Last And Survive Just About Anything
Royal Bank of Canada was founded in Toronto in 1864 and began paying dividends in 1870. Since then, it hasn’t missed a single dividend payment.
- 153 years of legendary dividend dependability
- 12-year dividend growth streak (since the Great Recession)
That means that RY has been paying quarterly dividends without fail through dozens of recessions, depressions, two world wars, and seven killer pandemics.
When the Spanish flu wiped out 5% of humanity? RY kept paying dividends.
Recessions, invasions, 9/11, and economic catastrophes, nothing could stop RY from paying shareholders the cut of its profits.
The last time it cut its dividend was in WWII when ordered by the Canadian government.
Today Canada’s big six banks are world-renown for their dependable income, which is why they are a staple in Canadian pension funds, endowments, and retirement accounts.
In fact, they are some of the most regulated banks on earth, with a symbiotic relationship with regulators. Thanks to some of the most prudent risk management in the world, the last time Canadian banks had a financial crisis was in the 1840s.
Reason Three: Some Of The Best Risk Management On Earth
Ultra SWANs like the Royal Bank of Canada aren’t “risk-free” stocks; they aren’t bond alternatives. Even the safest bank on earth has plenty that can go wrong as part of its risk profile.
Royal Bank Of Canada Risk Profile Summary
- economic cyclicality risk (relatively high commodity exposure)
- relatively lofty home prices and high debt among consumers
- high exposure to mortgages
- regulatory risk (regulators keep raising capital requirements)
- foreign diversification risk: international growth (including in the US) is complex and not as lucrative as the regulated oligopoly in Canada
- current risk: from 40% of international revenue
The good news is that Canada never got into trouble with subprime NINJA (no income, no job, no asset) loans like the US. Regulators require Canadian banks to hold a lot of their mortgages on their balance sheets.
And those mortgages often come with 30% to 50% down payments and the average duration of a CA mortgage is 5 years, though homes are amortized over 25 years.
The standard mortgage in Canada isn’t the 30-year fixed, as it is in the U.S., but a five-year mortgage amortized over 25 years. That means the loan balance has to be refinanced at the end of five years, exposing the borrower to any rate increase that has occurred in the interim.” – LA Times
Now the CA economy might get into trouble if interest rates climb and stay high for many years. Every year 20% of mortgages will reset at higher rates in the worst-case scenario.
Right now, mortgage rates in Canada are 6% to 6.5% depending on the bank and duration.
Business Council Of British Columbia 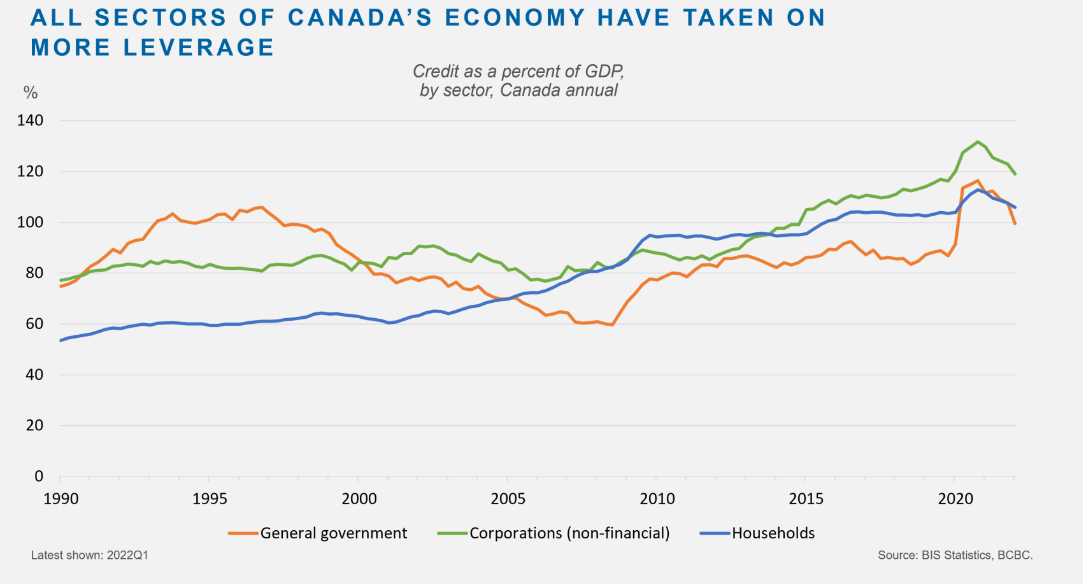
Canada’s debt has climbed to levels that have some people very worried.
Business Council Of British Columbia 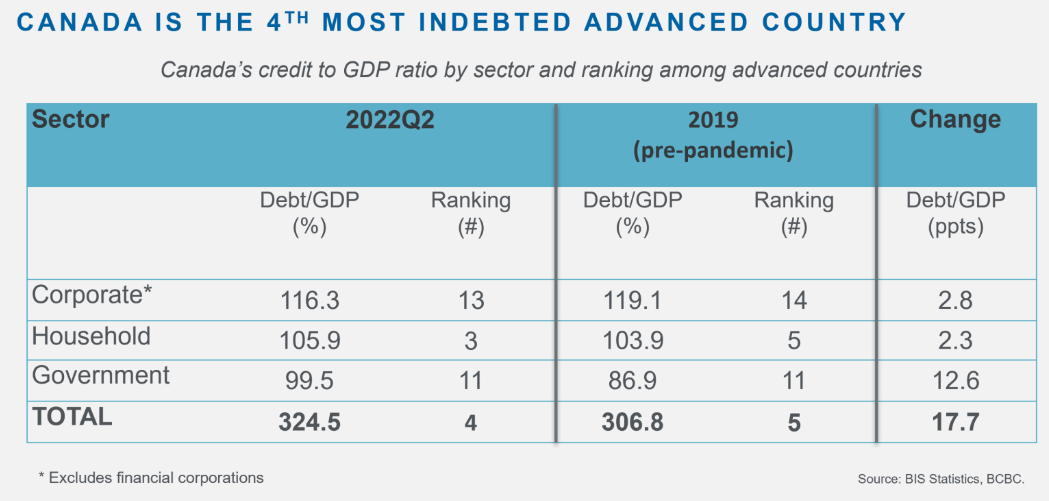
Canada’s total debt/GDP is 325%, and its household debt/GDP is 104%, compared to 66% in the US.
So how do Canadian banks stay so safe when their country is the 4th most indebted developed country on earth?
The answer is its rock-solid regulatory framework and conservative banking culture.
CA banks are regulated by the Office of the Superintendent of Financial Institutions (OSFI), an independent agency that reports to the Minister of Finance (the Minister) and the Financial Consumer Agency of Canada (FCAC).
OSFI uses capital buffer regulations on top of the standard 4.5% Tier one capital ratio set by Basel III and just raised its buffer another 0.5% to 11%.
earnings presentation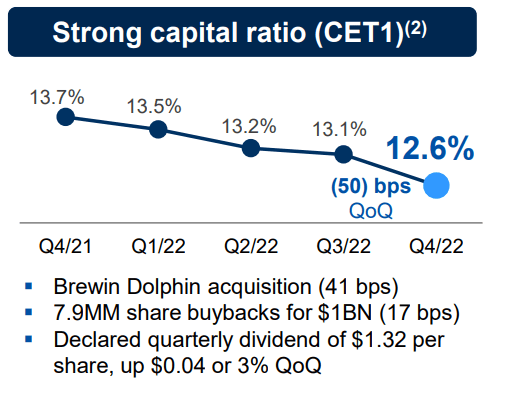
RY’s CET 1 ratio has declined a bit in the last year, but that was mostly due to M&A activity, a higher dividend, and buybacks.
earnings presentation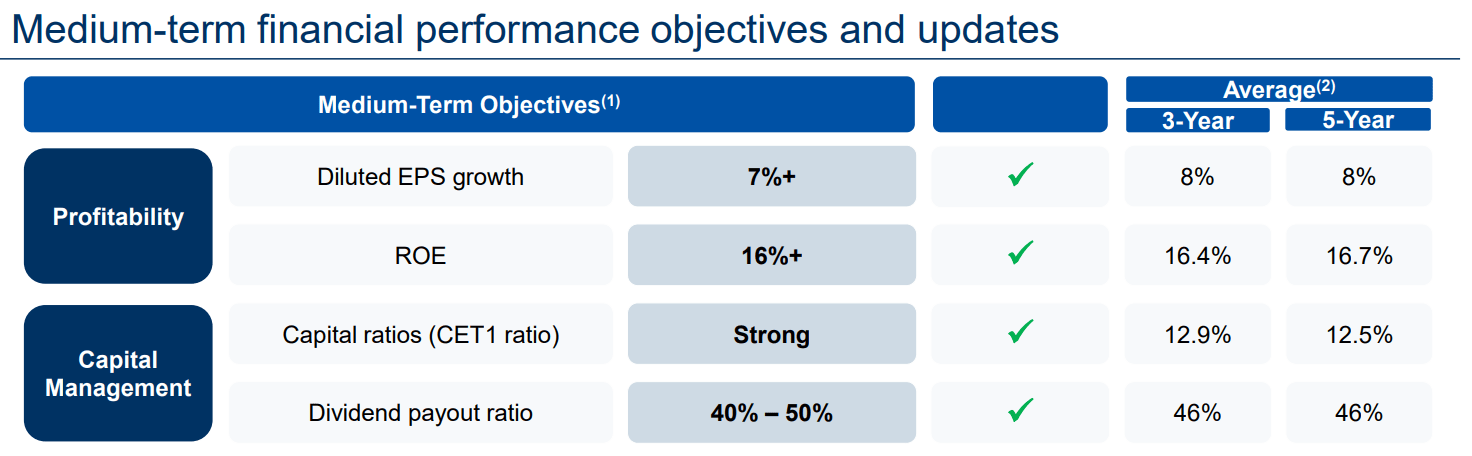
RY’s average CET1 ratio of 12.5% to 12.9% is very safe, and by the end of 2023, analysts expect it to be 13.1%.
And, of course, we can’t forget about RY’s conservative banking culture.
Reason Four: Legendary Risk Management
How do we quantify, monitor, and track such a complex risk profile, including loan underwriting? By doing what big institutions do.
Long-Term Risk Management Analysis: How Large Institutions Measure Total Risk Management
DK uses S&P Global’s global long-term risk-management ratings for our risk rating.
- S&P has spent over 20 years perfecting their risk model
- which is based on over 30 major risk categories, over 130 subcategories, and 1,000 individual metrics
- 50% of metrics are industry specific
- this risk rating has been included in every credit rating for decades
The DK risk rating is based on the global percentile of how a company’s risk management compares to 8,000 S&P-rated companies covering 90% of the world’s market cap.
RY scores 91st Percentile On Global Long-Term Risk Management
S&P’s risk management scores factor in things like:
- supply chain management
- crisis management
- cyber-security
- privacy protection
- efficiency
- R&D efficiency
- innovation management
- labor relations
- talent retention
- worker training/skills improvement
- occupational health & safety
- customer relationship management
- business ethics
- climate strategy adaptation
- sustainable agricultural practices
- corporate governance
- brand management
RY’s Long-Term Risk Management Is The 80th Best In The Master List 84th Percentile In The Master List)
| Classification | S&P LT Risk-Management Global Percentile |
Risk-Management Interpretation |
Risk-Management Rating |
| BTI, ILMN, SIEGY, SPGI, WM, CI, CSCO, WMB, SAP, CL | 100 | Exceptional (Top 80 companies in the world) | Very Low Risk |
| Royal Bank of Canada | 91 |
Exceptional |
Very Low Risk |
| Strong ESG Stocks | 86 |
Very Good |
Very Low Risk |
| Foreign Dividend Stocks | 77 |
Good, Bordering On Very Good |
Low Risk |
| Ultra SWANs | 74 | Good | Low Risk |
| Dividend Aristocrats | 67 | Above-Average (Bordering On Good) | Low Risk |
| Low Volatility Stocks | 65 | Above-Average | Low Risk |
| Master List average | 61 | Above-Average | Low Risk |
| Dividend Kings | 60 | Above-Average | Low Risk |
| Hyper-Growth stocks | 59 | Average, Bordering On Above-Average | Medium Risk |
| Dividend Champions | 55 | Average | Medium Risk |
| Monthly Dividend Stocks | 41 | Average | Medium Risk |
(Source: DK Research Terminal)
RY’s risk-management consensus is in the top 16% of the world’s best blue chips and is similar to:
- Bank of Nova Scotia (BNS): Ultra SWAN
- Bank of Montreal (BMO): Ultra SWAN
- Medtronic (MDT): Ultra SWAN aristocrat
- Caterpillar (CAT): Ultra SWAN aristocrat
- Alphabet (GOOG) (GOOGL): Ultra SWAN
The bottom line is that all companies have risks, and RY is exceptional, at managing theirs, according to S&P.
How We Monitor RY’s Risk Profile
- 16 analysts
- four credit rating agencies
- 20 experts who collectively know this business better than anyone other than management
When the facts change, I change my mind. What do you do, sir?” – John Maynard Keynes
There are no sacred cows at iREIT or Dividend Kings. Wherever the fundamentals lead, we always follow. That’s the essence of disciplined financial science, the math behind retiring rich and staying rich in retirement.
OK, so now that you know why RY is the world’s safest private bank, here’s why it’s potentially worth buying them today.
Long-Term Return Potential: You Don’t Have To Sacrifice Great Returns For Safety
Management is guiding for 7+% long-term growth. How reasonable is that?
FAST Graphs, FactSet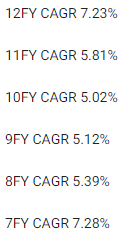
Given that RY has grown at 7% since the GFC and over the last seven years, in a low-rate world, that’s pretty realistic.
earnings presentation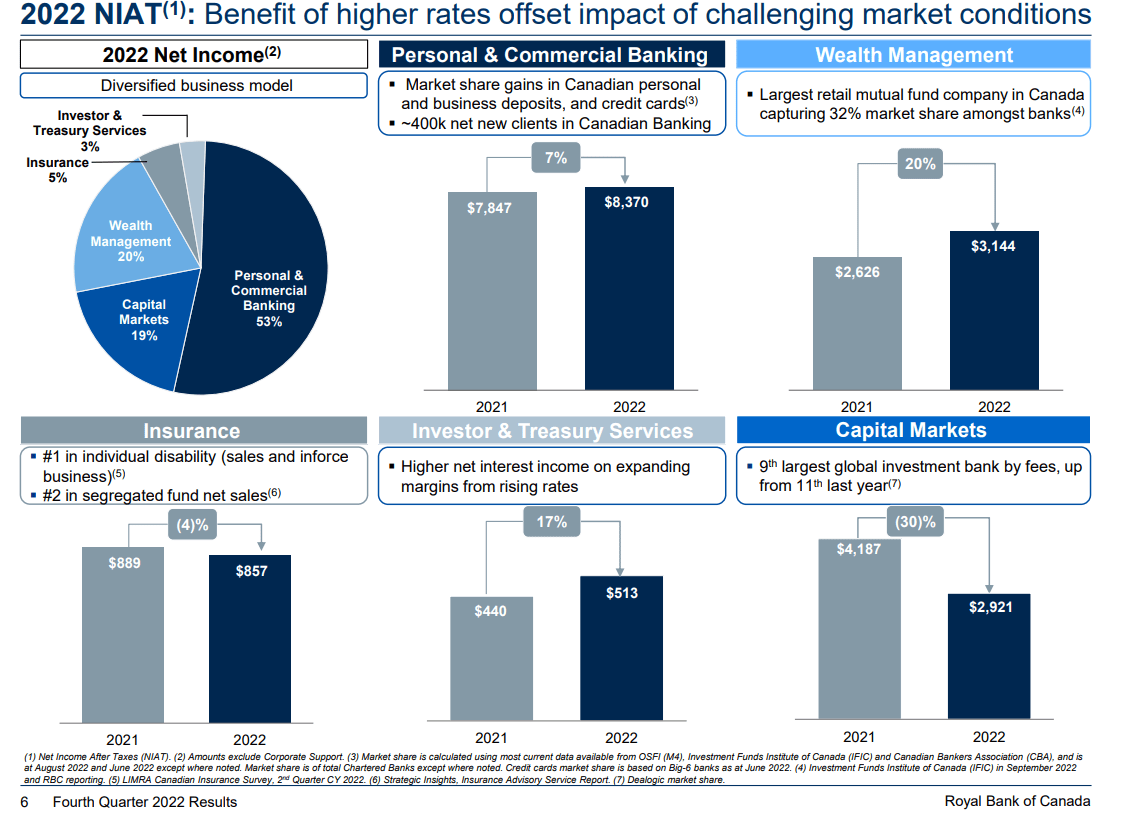
CA’s recession is expected to be as mild as America’s and possibly, they might avoid a recession entirely if energy prices rebound.
Meanwhile, Canadian banks are bathing in the benefits of higher rates which has been more than enough to offset a collapse in the capital markets business.
Consensus Long-Term Return Potential
| Investment Strategy | Yield | LT Consensus Growth | LT Consensus Total Return Potential | Long-Term Risk-Adjusted Expected Return |
| Royal Bank of Canada | 3.9% | 7.0% | 10.9% | 7.6% |
| REITs | 3.9% | 6.1% | 10.0% | 7.0% |
| Schwab US Dividend Equity ETF | 3.4% | 7.6% | 11.0% | 7.7% |
| 60/40 Retirement Portfolio | 2.1% | 5.1% | 7.2% | 5.0% |
| Vanguard Dividend Appreciation ETF | 1.9% | 10.2% | 12.1% | 8.5% |
| Dividend Aristocrats | 1.9% | 8.5% | 10.4% | 7.3% |
| S&P 500 | 1.7% | 8.5% | 10.2% | 7.1% |
| Nasdaq | 0.8% | 10.9% | 11.7% | 8.2% |
(Sources: DK Research Terminal, FactSet, Morningstar, Ycharts)
RY offers about 11% return potential, which is on par with many high-yield blue-chip options. The difference is that RY’s dividend dependability is the stuff of legend, and it will be a cold day in hell before they cut their dividend.
Inflation-Adjusted Consensus Return Forecast: $1,000 Initial Investment
| Time Frame (Years) | 7.9% CAGR Inflation-Adjusted S&P 500 Consensus | 8.6% CAGR Inflation-Adjusted RY Consensus | Difference Between Inflation-Adjusted RY Consensus And S&P Consensus |
| 5 | $1,465.25 | $1,513.38 | $48.13 |
| 10 | $2,146.96 | $2,290.33 | $143.37 |
| 15 | $3,145.84 | $3,466.14 | $320.31 |
| 20 | $4,609.44 | $5,245.60 | $636.16 |
| 25 | $6,753.99 | $7,938.60 | $1,184.61 |
| 30 (retirement time frame) | $9,896.29 | $12,014.14 | $2,117.85 |
| 35 | $14,500.55 | $18,181.99 | $3,681.44 |
| 40 | $21,246.95 | $27,516.32 | $6,269.37 |
| 45 | $31,132.11 | $41,642.72 | $10,510.60 |
| 50 | $45,616.37 | $63,021.37 | $17,405.00 |
| 55 | $66,839.43 | $95,375.46 | $28,536.02 |
| 60 (investing lifetime) | $97,936.56 | $144,339.57 | $46,403.02 |
(Sources: DK Research Terminal, FactSet)
For a company that rating agencies think will still exist in the year 9,162, a potential 12X inflation-adjusted return over 30 years and a 144X real return over an investing lifetime is appealing.
Royal Bank of Canada Total Returns Since 1999
Portfolio Visualizer Premium 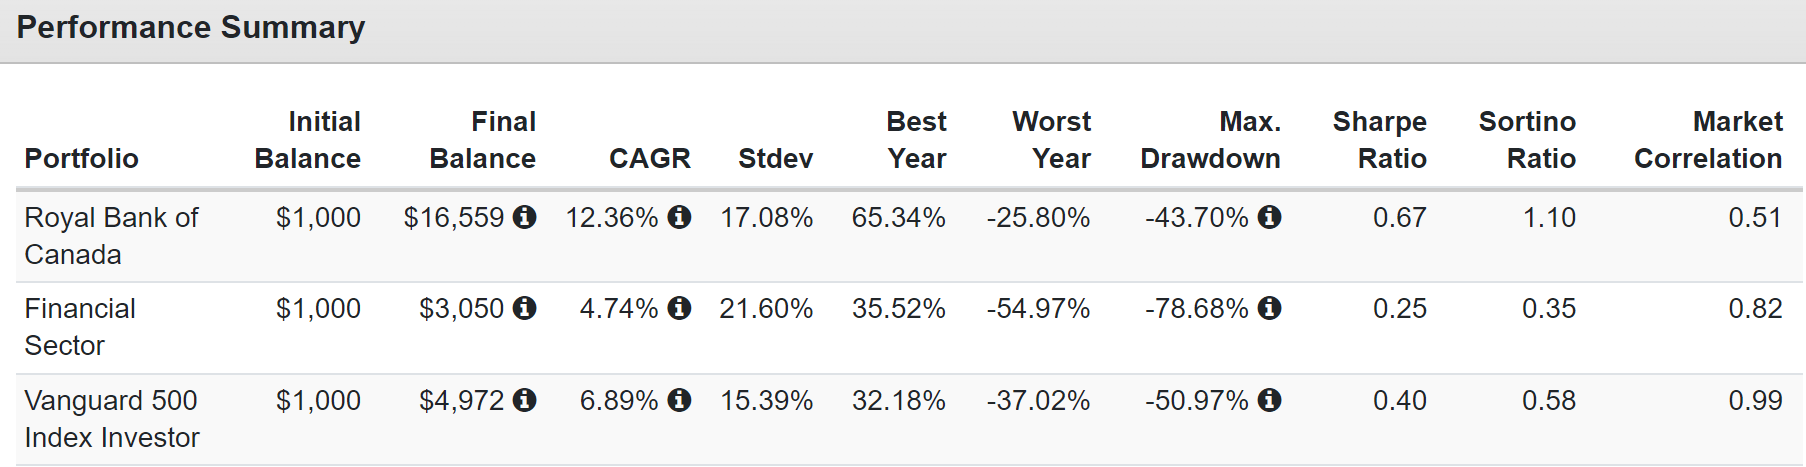
RY is a consistent market beater, delivering double-digit returns for decades.
It’s such a safe bank that it only fell 44% in the Great Recession when many financials fell 80%.
Portfolio Visualizer Premium 
I don’t know about you, but I feel no need to buy US banks because US banks are plentiful in high-yield blue-chips like SCHD. But banks like Royal Bank? That I can certainly endorse within a diversified portfolio.
Royal Bank of Canada 2025 Consensus Total Return Potential
(Source: FAST Graphs, FactSet)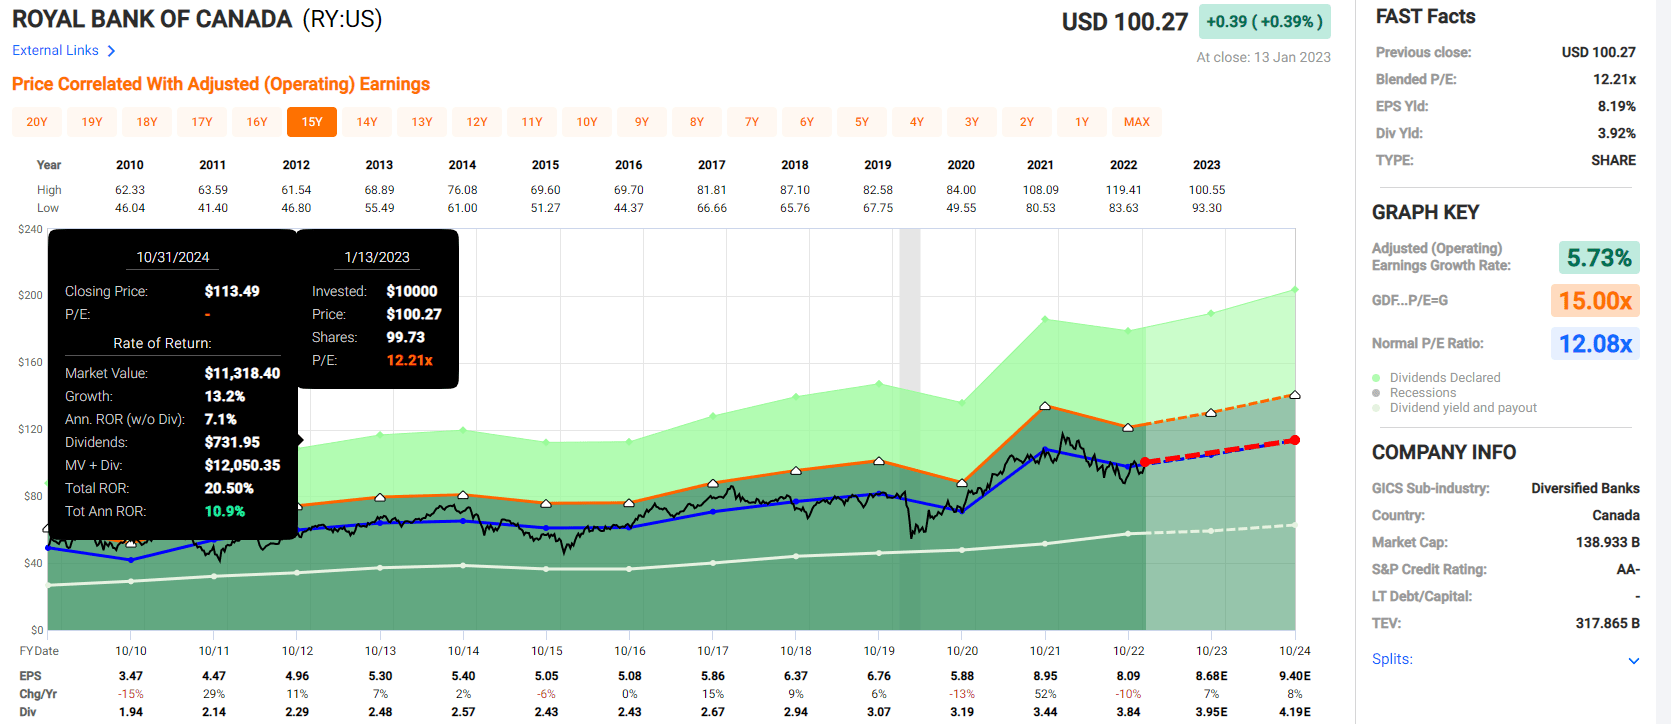
(Source: FAST Graphs, FactSet)
Fair Value: $108.31
Current Price: $101.07
Discount To Fair Value: 7%
DK Rating: Potentially Good Buy
From its modest discount, RY offers an attractive 11% annual return potential through late 2024.
Royal Bank of Canada 2028 Consensus Total Return Potential
(Source: FAST Graphs, FactSet)
Over the next five years, RY might double the market’s returns, with a 91% total return.
- 8% to 13% CAGR consensus total return potential range over the next five years
Royal Bank of Canada Investment Decision Score
Dividend Kings Automated Investment Decision Tool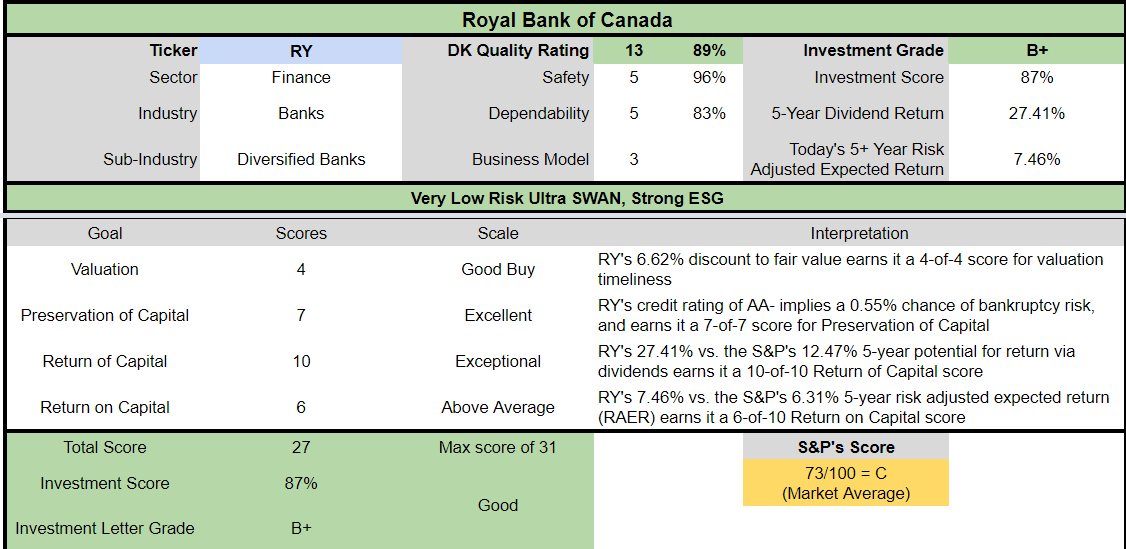
RY is a potentially good high-yield opportunity for anyone comfortable with its risk profile. Look at how it compares to the S&P 500.
- 7% discount to fair value vs. 4% premium S&P = 11% better valuation
- 3.9% potentially very safe yield vs. 1.7% (2.5X higher and safer)
- approximately 10.9% long-term annual return potential vs. 10.2% CAGR S&P
- about 20% higher risk-adjusted expected returns
- 2.5X higher income potential over five years
Bottom Line: The World’s Safest Bank Offers A 4% Yield Retirees Can Trust In Any Economy
Let me be clear: I’m NOT calling the bottom in RY (I’m not a market-timer).
Ultra SWAN quality does NOT mean “can’t fall hard and fast in a bear market.”
Fundamentals are all that determine safety and quality, and my recommendations.
- over 30+ years, 97% of stock returns are a function of pure fundamentals, not luck
- in the short term; luck is 25X as powerful as fundamentals
- in the long term, fundamentals are 33X as powerful as luck
While I can’t predict the market in the short term, here’s what I can tell you about RY.
- the safest private bank on earth according to rating agencies
- AA-credit rating (should survive for millennia)
- hasn’t missed a dividend payment in 153 years
- risk management and conservative underwriting that’s the stuff of legend
- 91st percentile global risk management
- 3.9% very safe yield
- 10.9% long-term return potential
- 7% undervalued
If you want a true “buy and hold forever” Ultra SWAN with an attractive yield and a dividend that will survive anything other than the literal apocalypse, RY is open of the best choices in this recession.
Be the first to comment