


These here are my picks for some big yielding preferred shares.
iridi/iStock via Getty Images
Get ready for charts, images, and tables because they are better than words. The ratings and outlooks we highlight here come after Scott Kennedy’s weekly updates in the REIT Forum. Your continued feedback is greatly appreciated, so please leave a comment with suggestions.
We’re bringing you the latest in inefficient markets. We’re going to focus on preferred shares, and we will cover 8 of them in this article.
We start with 4 of them from the same REIT:
The comparison looks like this:
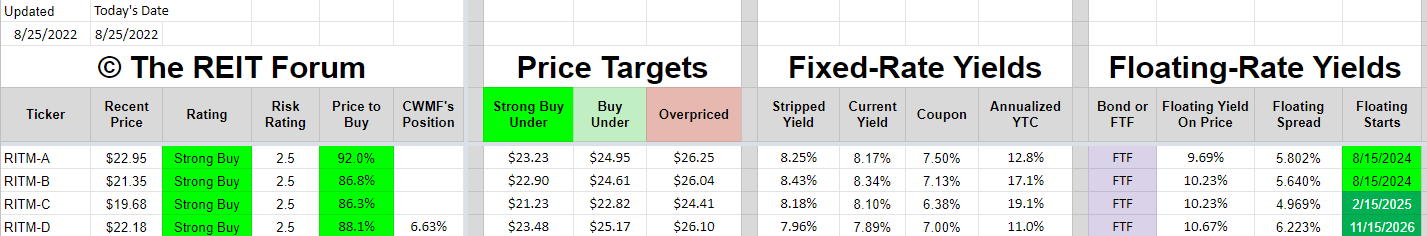
The REIT Forum
Which one has the weakest floating yield on price? RITM-A.
Which one has the least upside to call value? RITM-A.
If investors assume Rithm (RITM) is going to call the shares on 8/15/2024, then they would rather have RITM-B for a significantly larger capital gain. If they assume RITM won’t call the shares, then RITM-B still wins for the much higher yield after shares begin floating.
What if RITM only calls RITM-A but doesn’t call RITM-B? In that scenario, RITM-B would probably start trading very close to $25.00. So while it wouldn’t be a call, investors would probably have the opportunity to close out their position at a similar price. It’s very unusual to see shares called at $25.00 while a very similar share trades materially below $25.00. What if it happened? Well, investors would still be getting a great yield on the shares of RITM-B.
Now what about the RITM-C and RITM-D? they take longer to float. However, RITM-C offers the biggest upside to call value. That’s pretty nice for maximizing the potential gains. On the other hand, RITM-D has the biggest floating spread, which is great for income generation after the shares begin floating.
What if you assume rates will be high in 2024, then crash to 0 in 2026? You should probably be looking at fixed-rate shares then and there are some great opportunities in the fixed-rate shares as well. However, it is worth noting that even if you assume rates falling, RITM-D’s spread of 6.223% is still pretty large. With shares trading below $22.50, investors are getting quite a few extra shares for their investment. If rates were near 0% and the investor’s yield on cost was still around 7%, that would still be pretty good.
I was going to switch over to common shares here, but that section became so large it wasn’t going to mix well with the preferred shares.
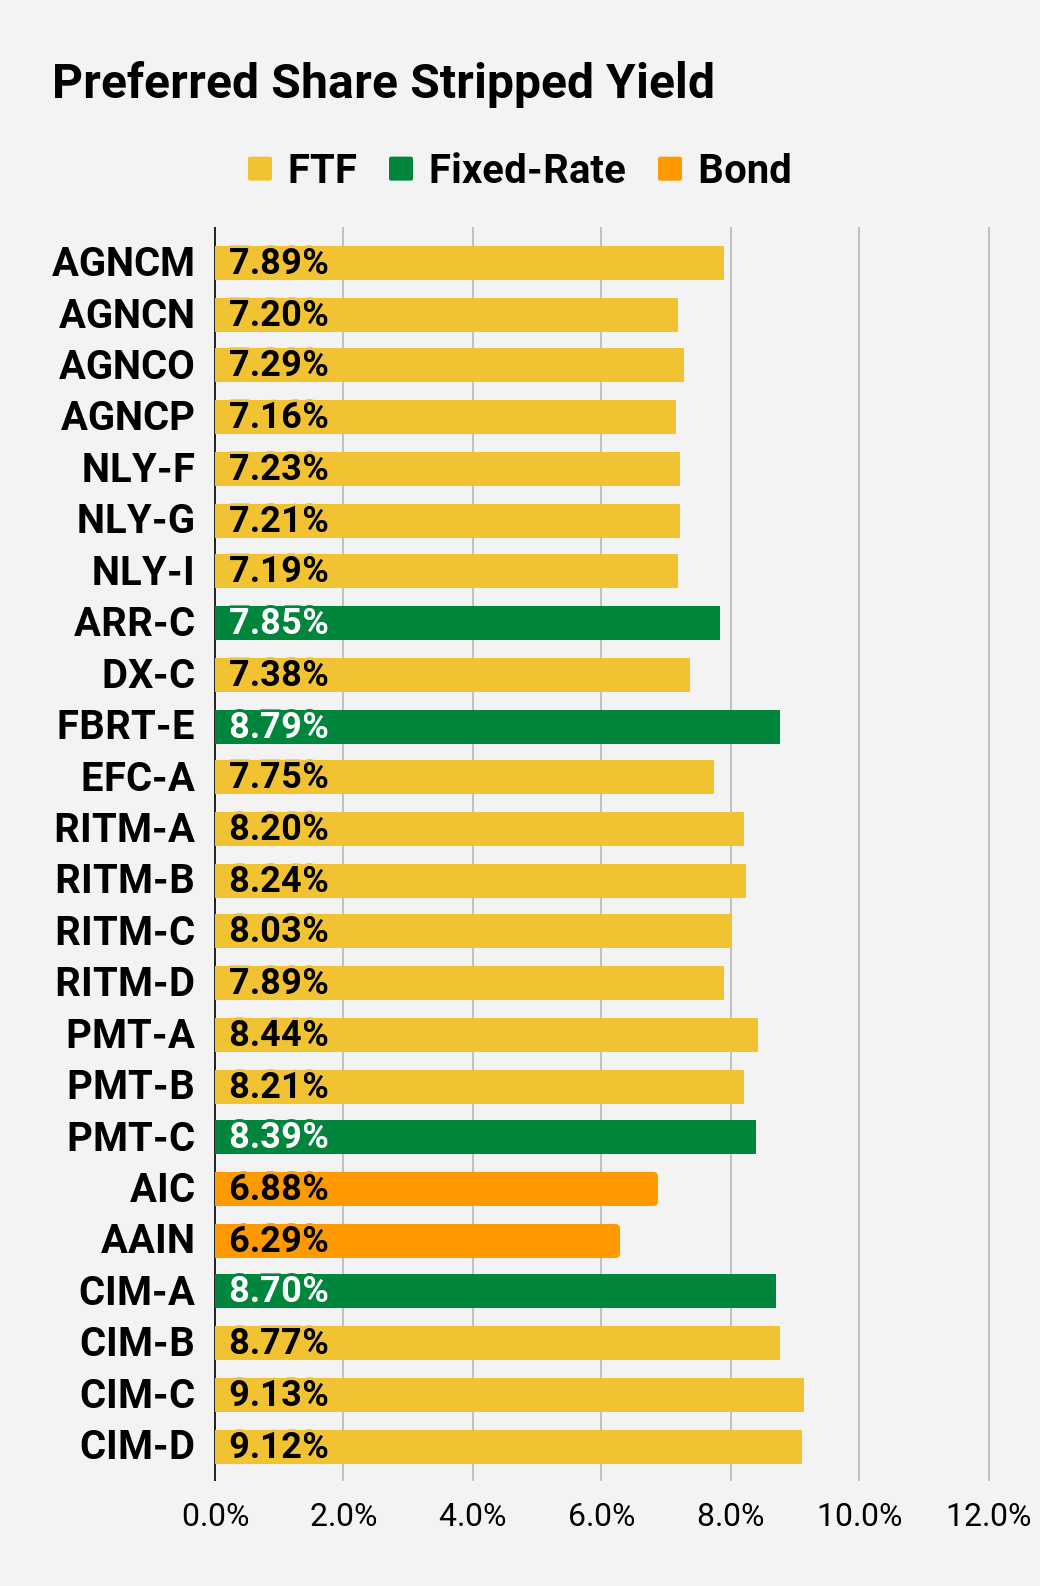
Instead, I want to highlight some more preferred shares:
The table is shown below:
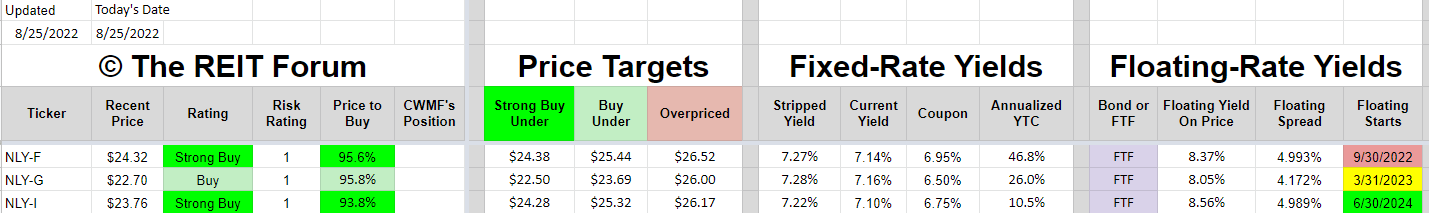
The REIT Forum
The relative attractiveness is pretty similar now. The Price-to-buy column only spans from 93.8% to 95.8%. That’s a difference of 200 basis points, which is reasonably small. However, the market hasn’t always been so efficient.
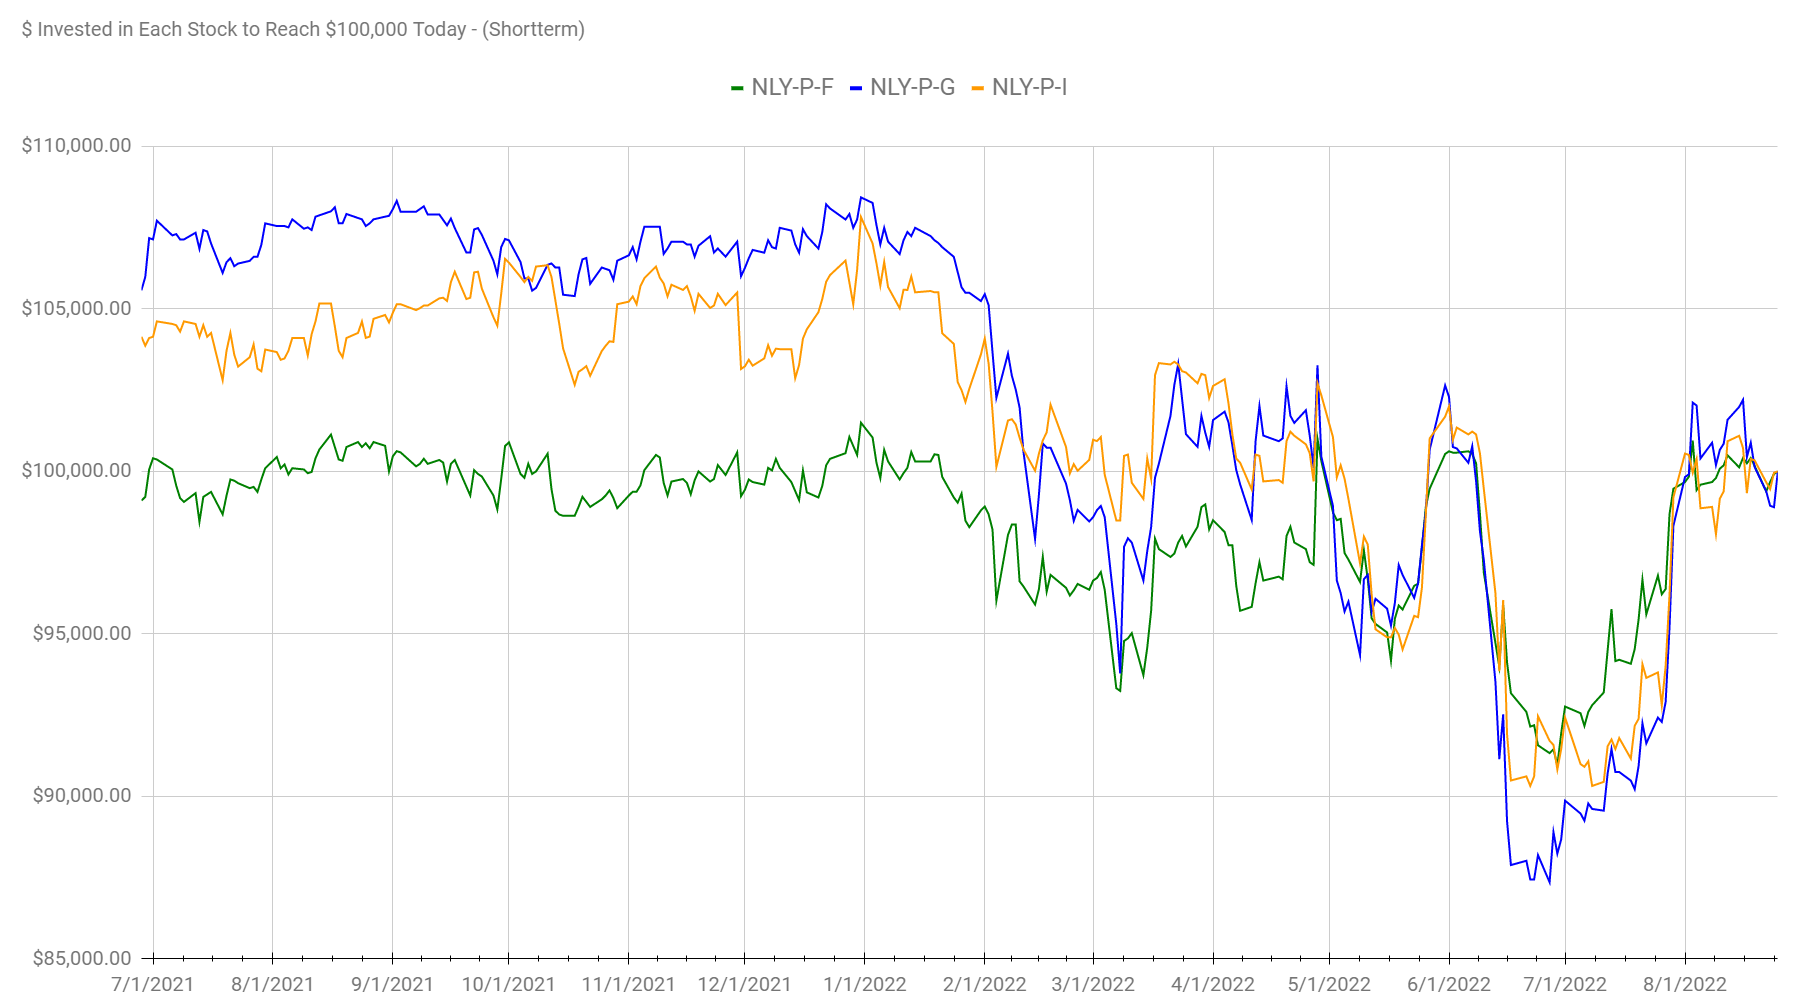
The REIT Forum
You may notice that NLY-G was often the most expensive share to ride on the way in. Why is that? Because all 3 shares traded pretty close to $25.00 despite NLY-G having a materially lower floating spread. The gap between 4.172% and 4.989% is material and it warrants a difference in share prices. Today, investors could pick any of the 3 and be getting a pretty similar deal. Each is pretty good, but not great. In this environment, we can get much better discounts with other shares.
For investors willing to take on a bit more risk, I want to suggest MFA-C (MFA.PC):
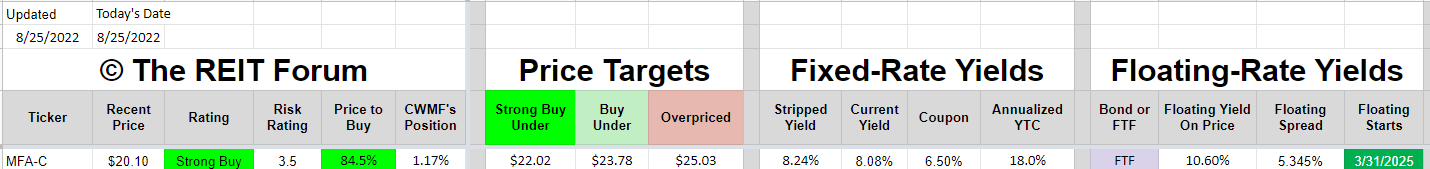
The REIT Forum
Shares have a substantial discount to call value and a substantial discount to our targets. The floating spread of 5.345% isn’t too bad, though it isn’t great either. However, when shares are trading near $20, it becomes much more attractive. The dividend rate is based on the $25 call value, so buying near $20 means investors are getting 25% more shares and therefore 25% more income. If short-term rates remain at the current levels, the yield on these shares (at the current price) would climb to 10.6%. That’s materially higher than the 8.24% stripped yield today, though I find that 8.24% stripped yield to be a respectable return anyway.
Following this review, my top choices among the shares we discussed are RITM-B, RITM-C, RITM-D, and MFA-C.
RITM-A is offering a materially weaker risk/reward profile. The NLY preferred shares are cheap enough to be attractive, but we’re still spoiled for choice. While they are attractive, they are clearly not quite as attractive as the other options.
The rest of the charts in this article may be self-explanatory to some investors. However, if you’d like to know more about them, you’re encouraged to see our notes for the series.
Stock Table
We will close out the rest of the article with the tables and charts we provide for readers to help them track the sector for both common shares and preferred shares.
We’re including a quick table for the common shares that will be shown in our tables:
Let the images begin!
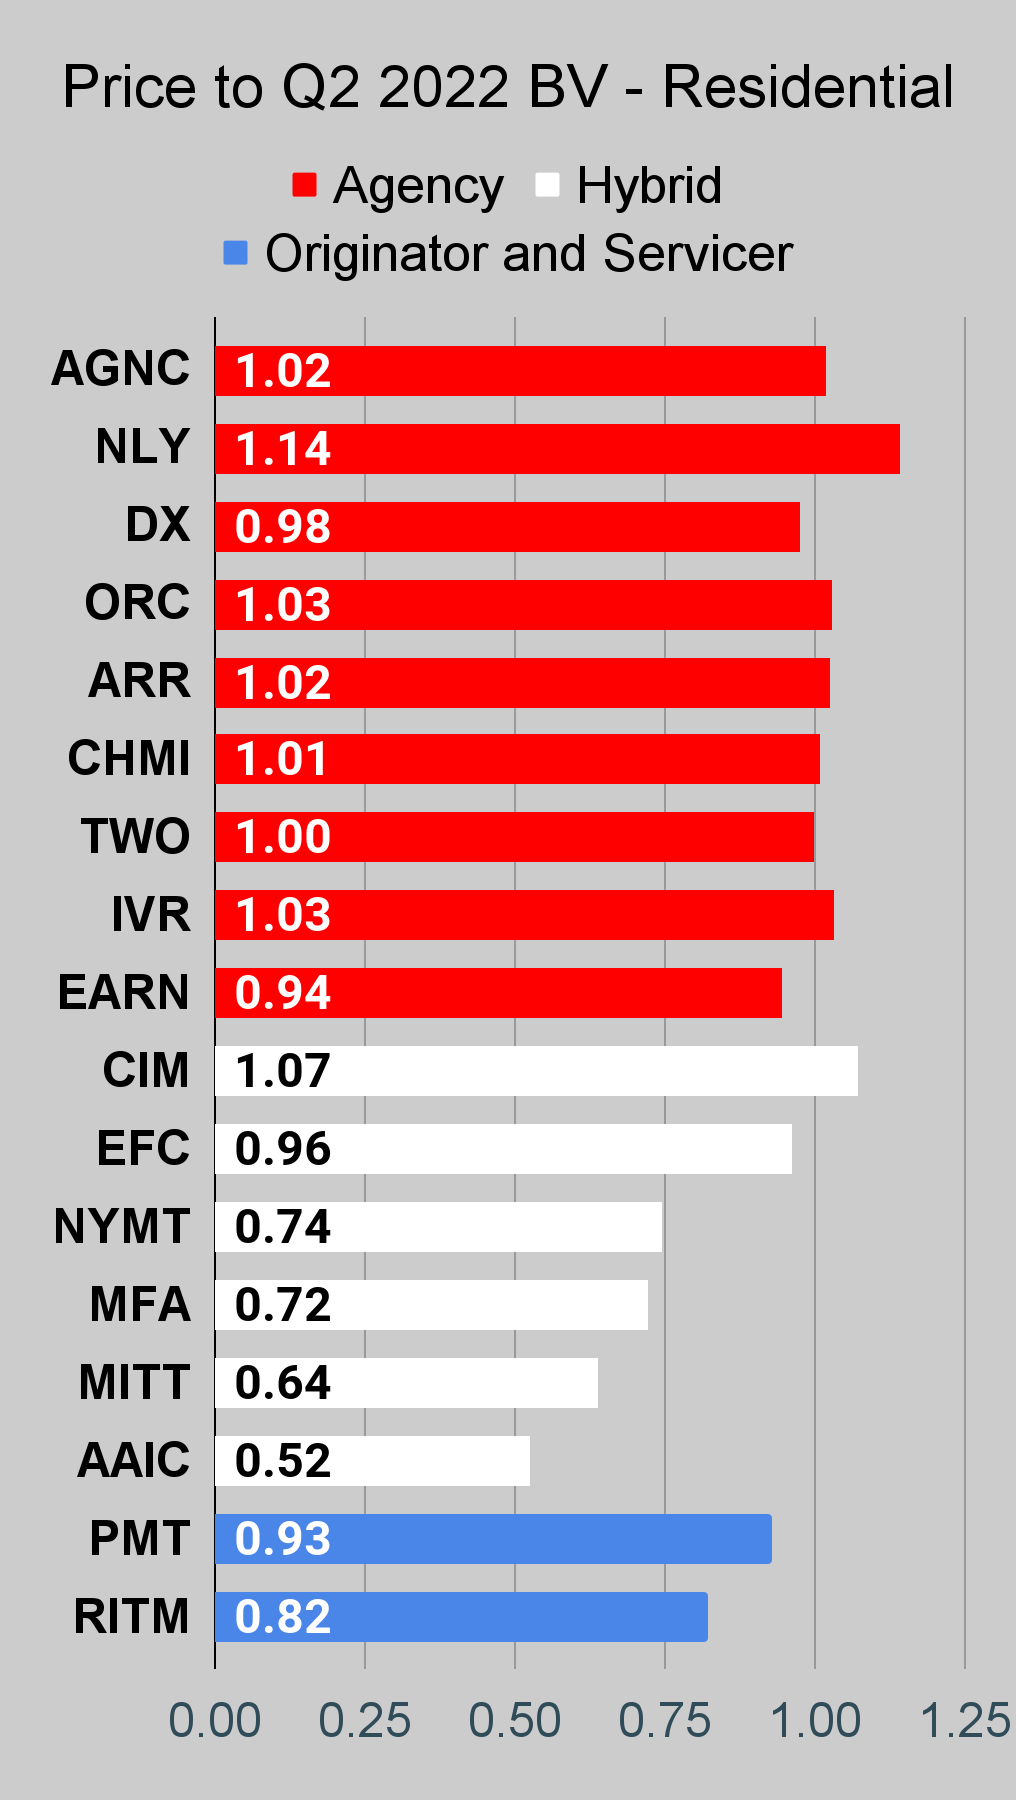
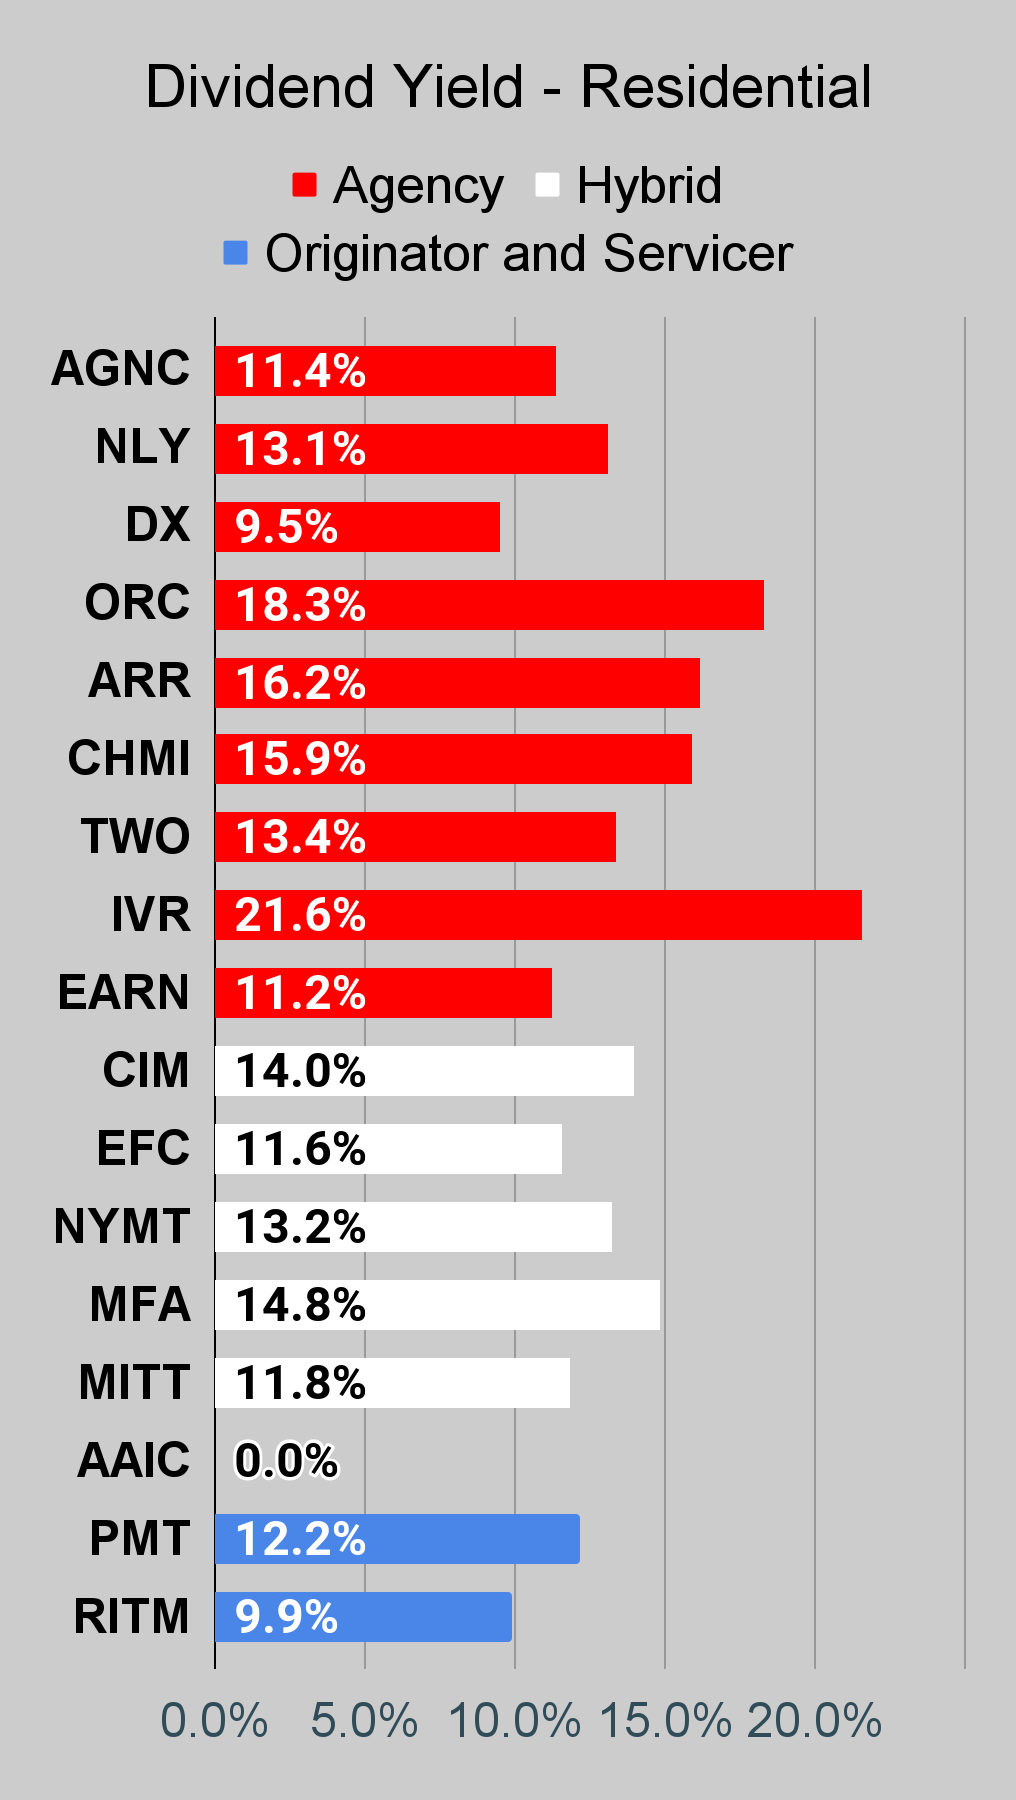
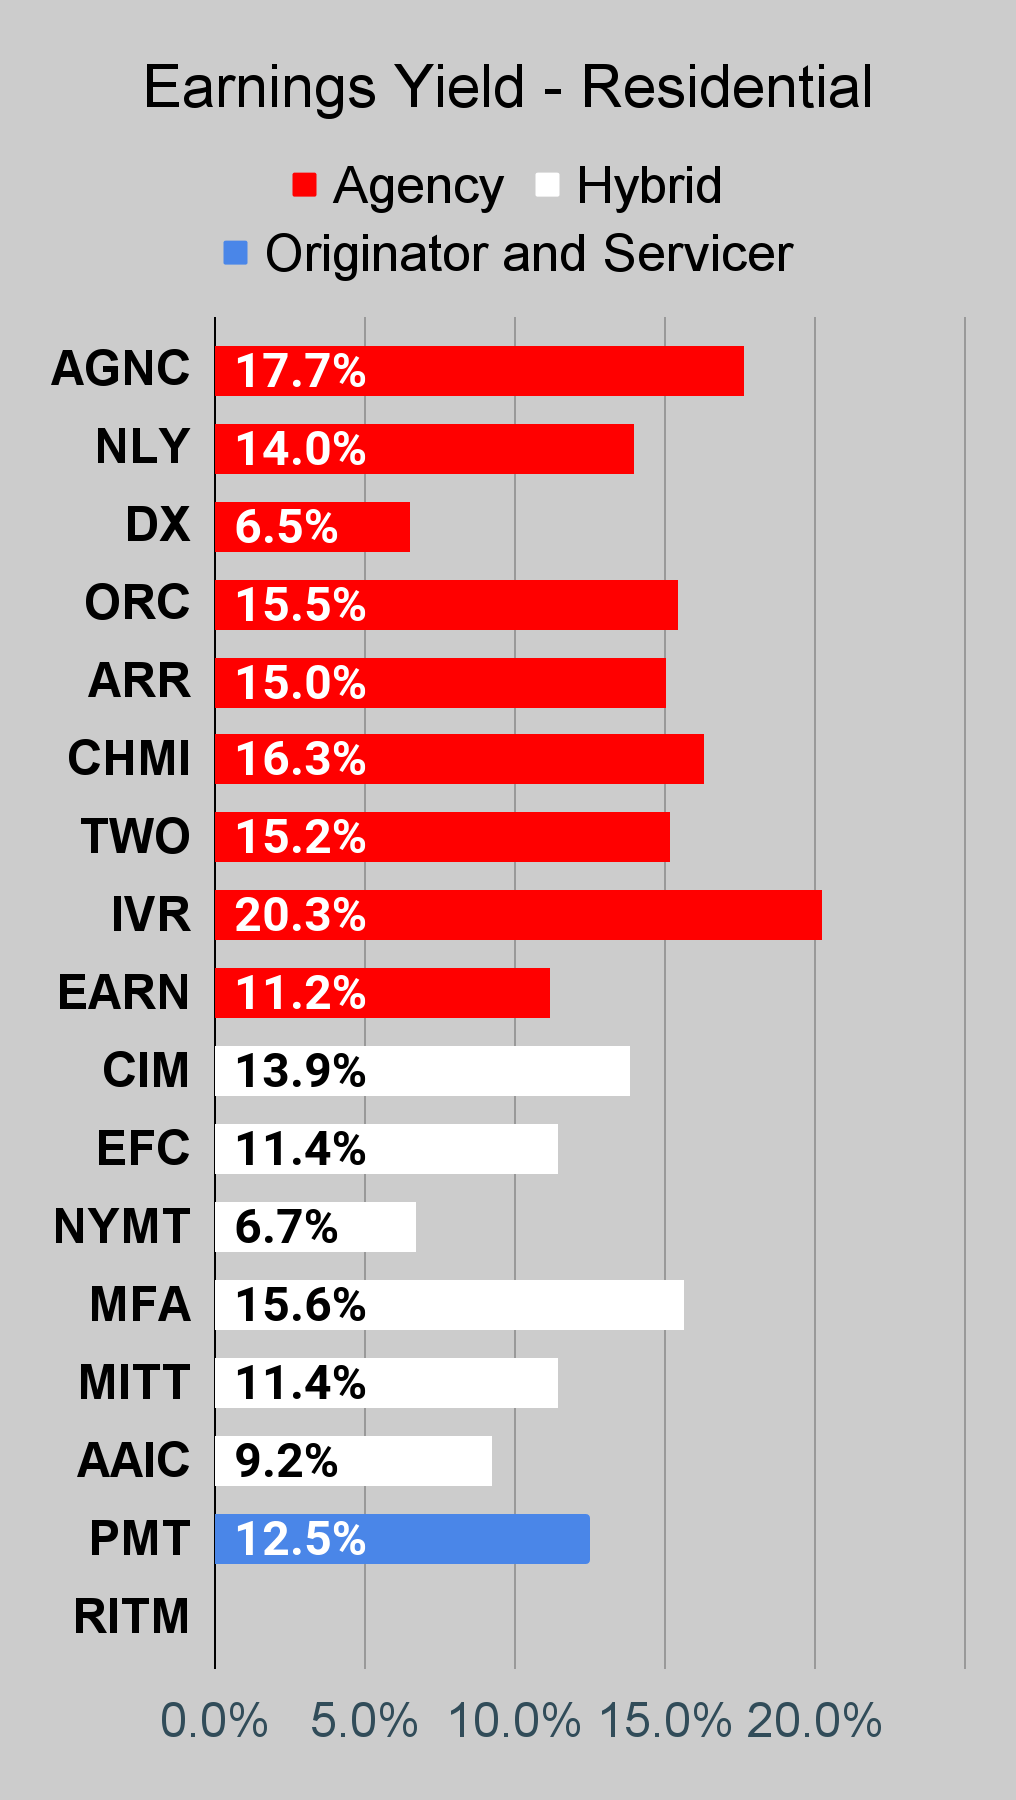
Residential Mortgage REIT Charts
Note: The chart for our public articles uses the book value per share from the latest earnings release. Current estimated book value per share is used in reaching our targets and trading decisions. It is available in our service, but those estimates are not included in the charts below.
 The REIT Forum |
 The REIT Forum |
 The REIT Forum |
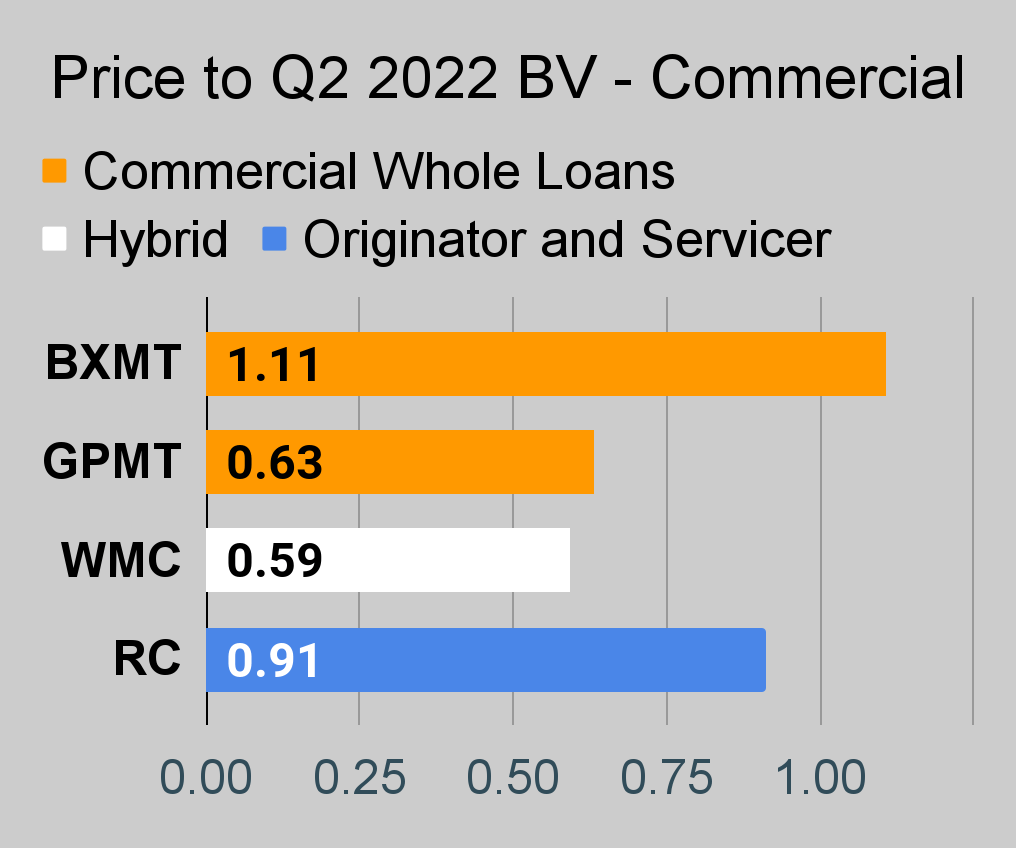
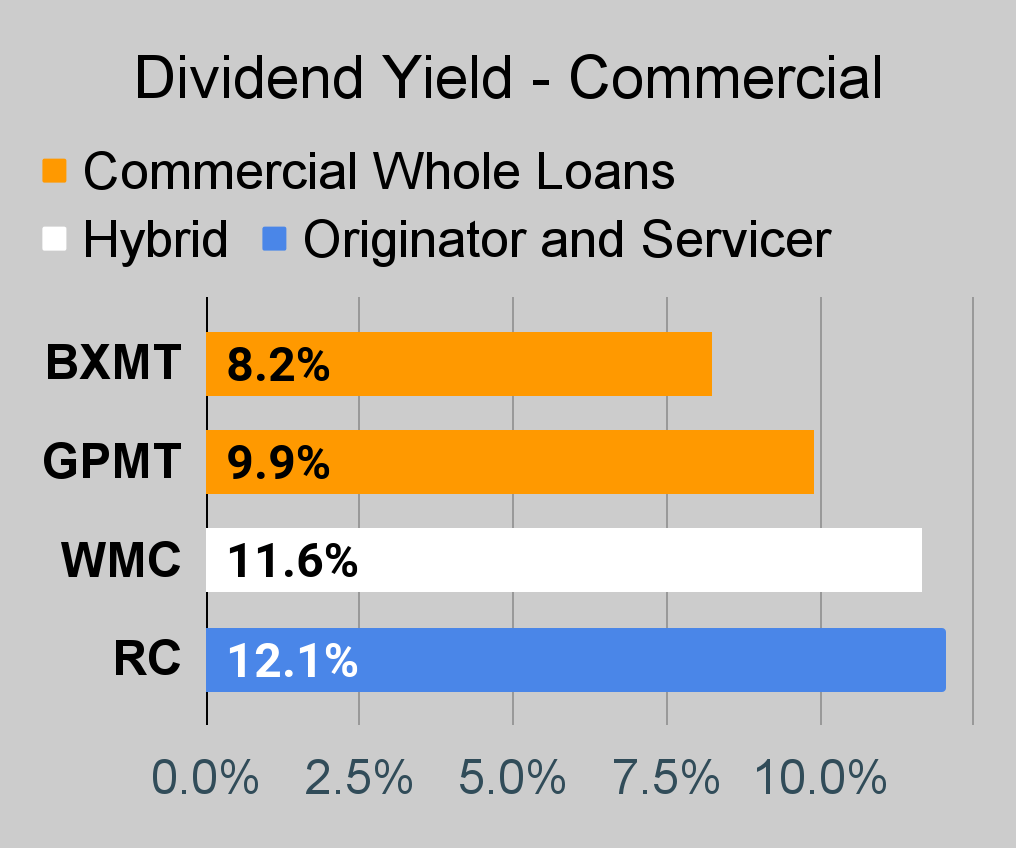
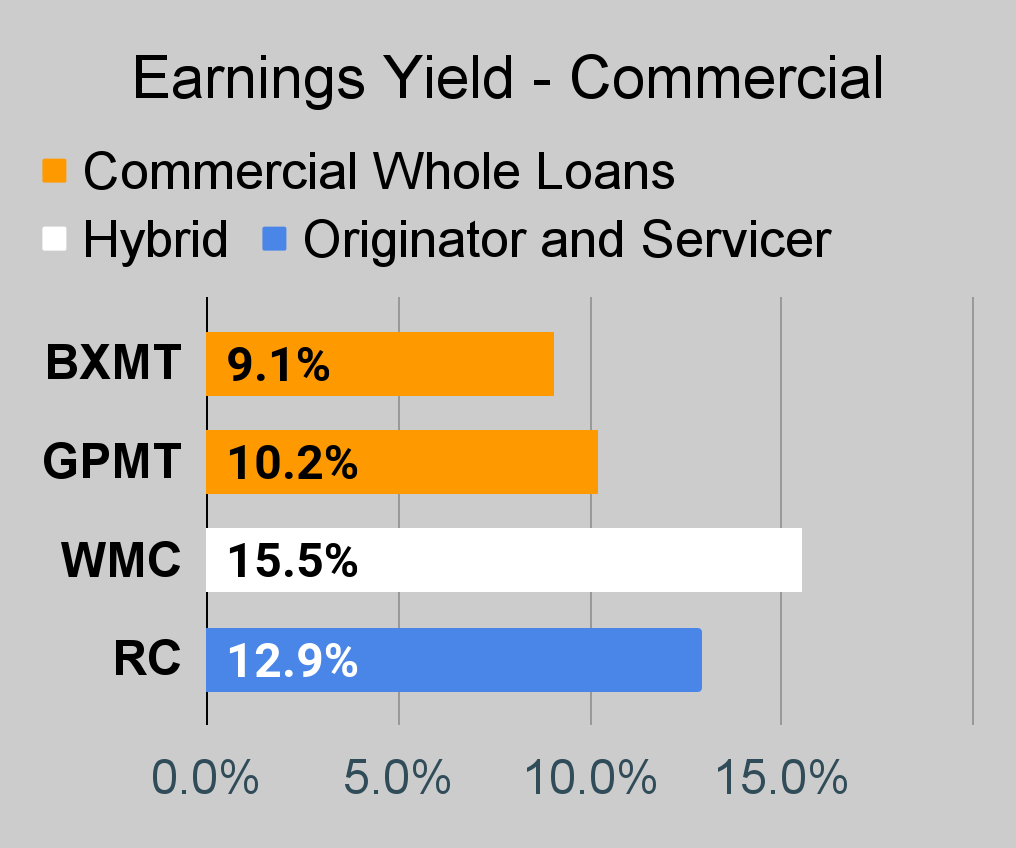
Commercial Mortgage REIT Charts
 The REIT Forum |
 The REIT Forum |
 The REIT Forum |
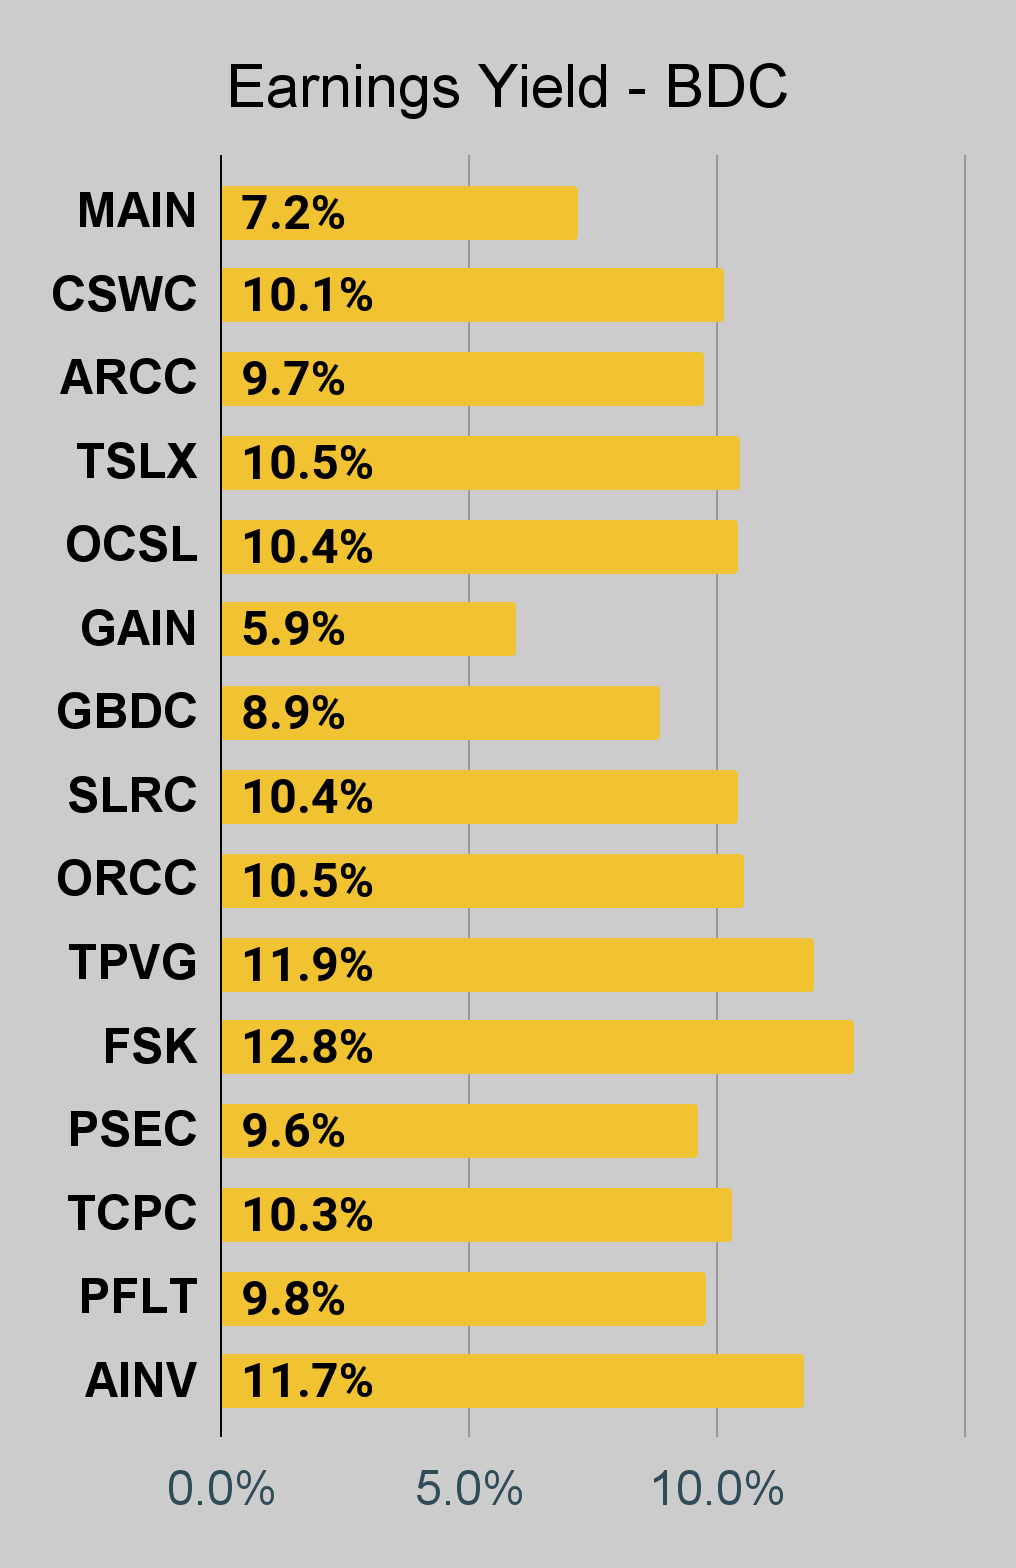
BDC Charts
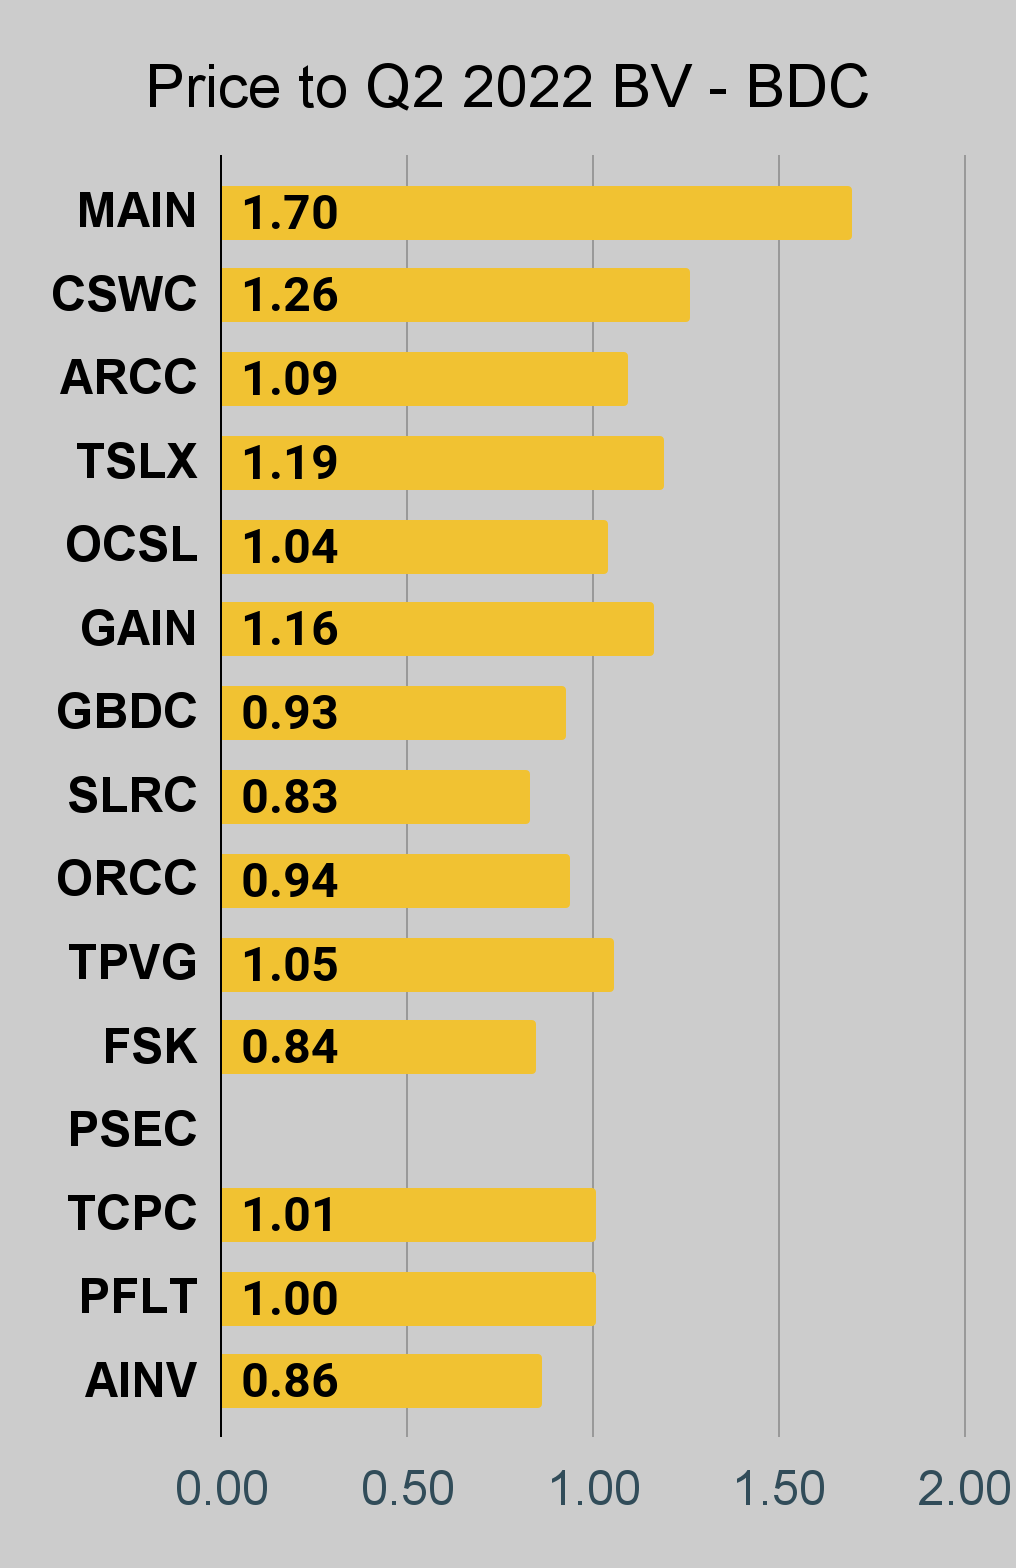 The REIT Forum |
 The REIT Forum |
 The REIT Forum |
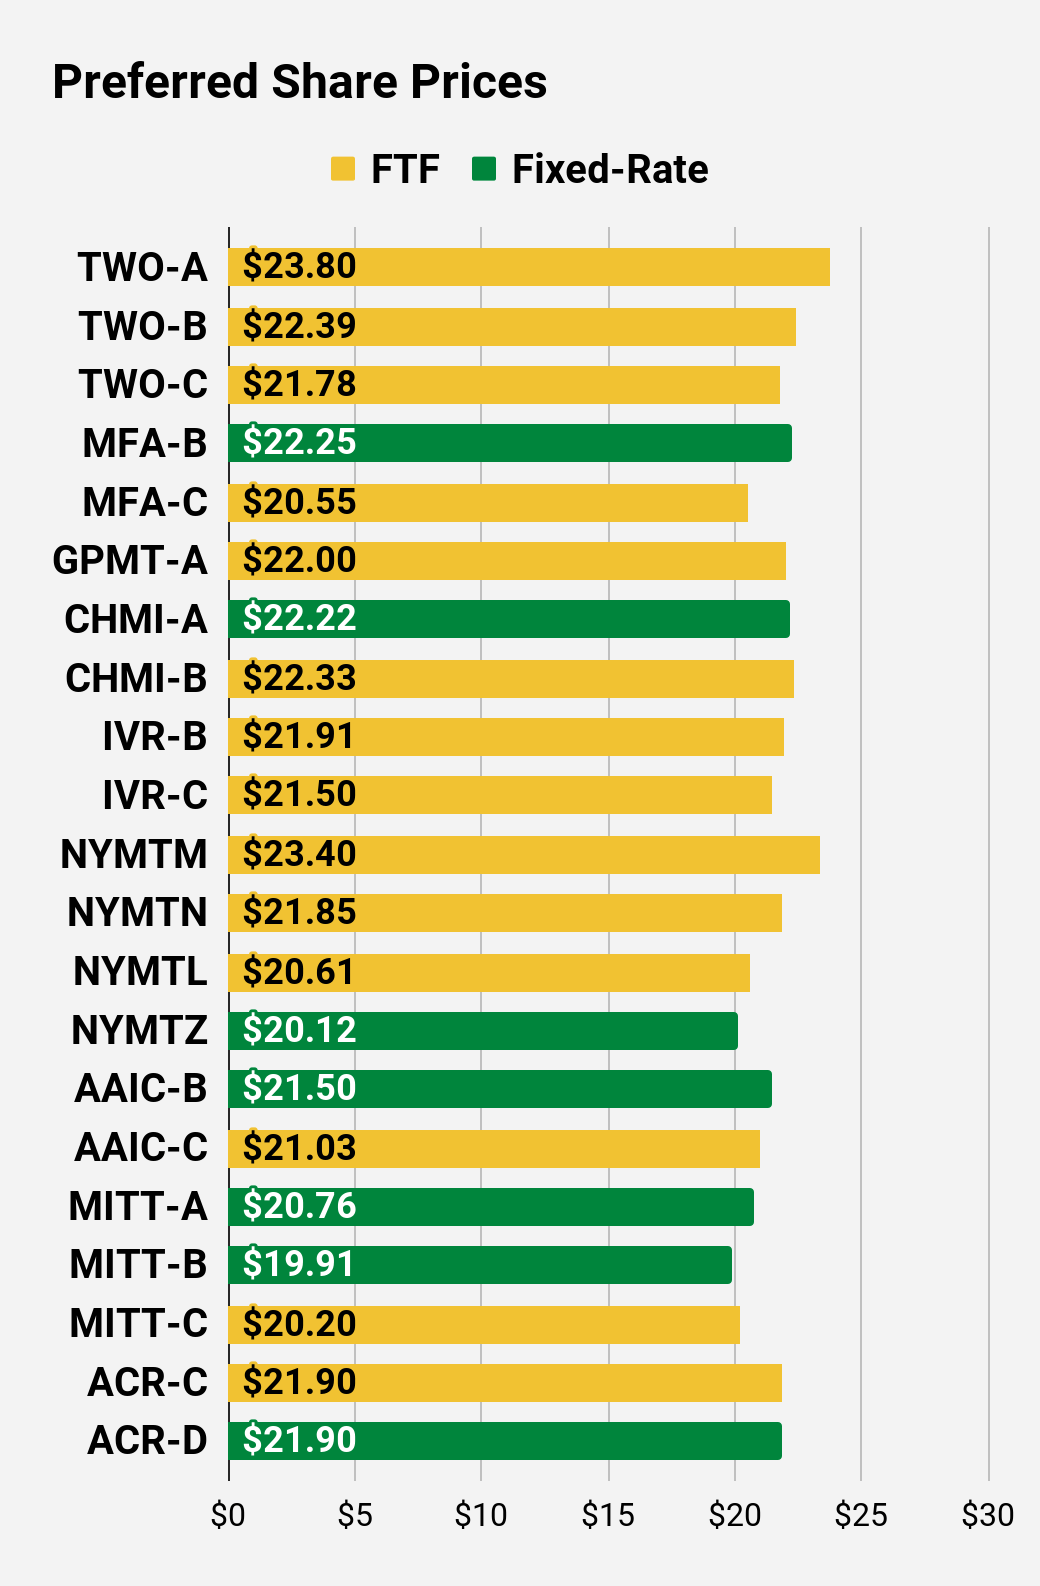
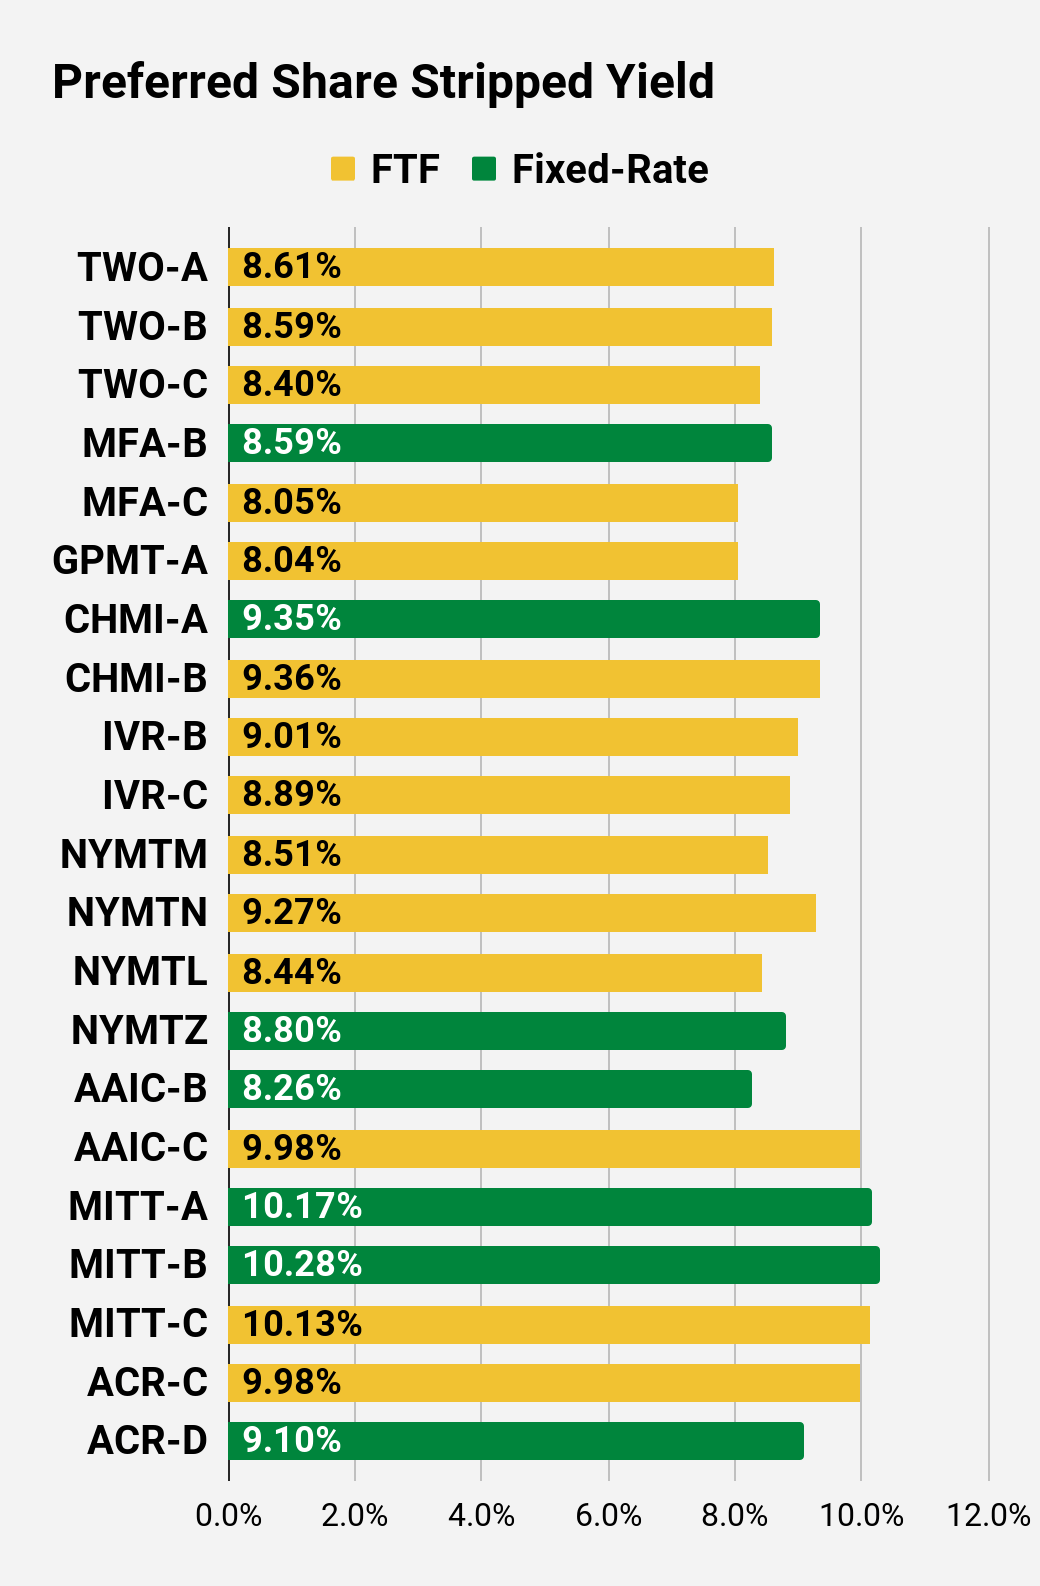
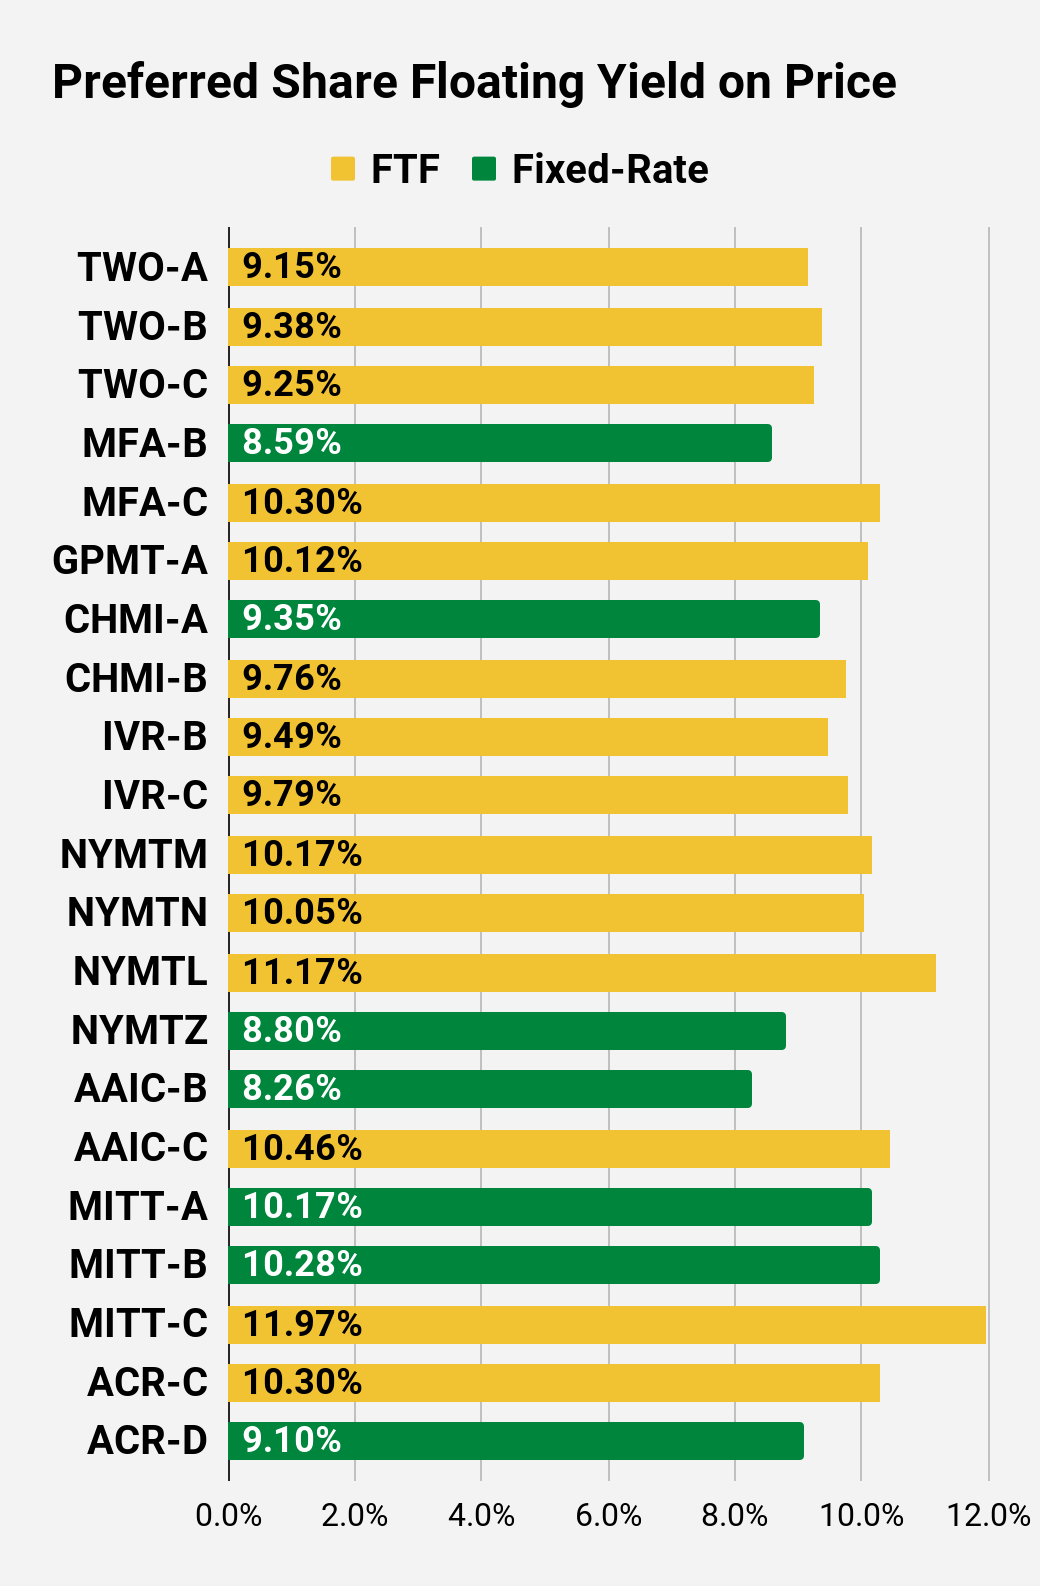
Preferred Share Charts
 The REIT Forum |
 The REIT Forum |
 The REIT Forum |
 The REIT Forum |
 The REIT Forum |
 The REIT Forum |
Preferred Share Data
Beyond the charts, we’re also providing our readers with access to several other metrics for the preferred shares.
After testing out a series on preferred shares, we decided to try merging it into the series on common shares. After all, we are still talking about positions in mortgage REITs. We don’t have any desire to cover preferred shares without cumulative dividends, so any preferred shares you see in our column will have cumulative dividends. You can verify that by using Quantum Online. We’ve included the links in the table below.
To better organize the table, we needed to abbreviate column names as follows:
- Price = Recent Share Price – Shown in Charts
- BoF = Bond or FTF (Fixed-to-Floating)
- S-Yield = Stripped Yield – Shown in Charts
- Coupon = Initial Fixed-Rate Coupon
- FYoP = Floating Yield on Price – Shown in Charts
- NCD = Next Call Date (the soonest shares could be called)
- Note: For all FTF issues, the floating rate would start on NCD.
- WCC = Worst Cash to Call (lowest net cash return possible from a call)
- QO Link = Link to Quantum Online Page
Second Batch:
Strategy
Our goal is to maximize total returns. We achieve those most effectively by including “trading” strategies. We regularly trade positions in the mortgage REIT common shares and BDCs because:
- Prices are inefficient.
- Long-term, share prices generally revolve around book value.
- Short-term, price-to-book ratios can deviate materially.
- Book value isn’t the only step in analysis, but it is the cornerstone.
We also allocate to preferred shares and equity REITs. We encourage buy-and-hold investors to consider using more preferred shares and equity REITs.
Performance
We compare our performance against 4 ETFs that investors might use for exposure to our sectors:
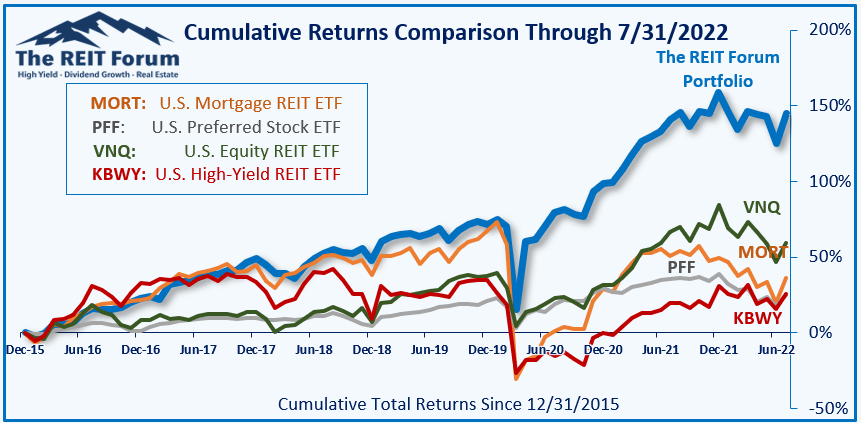
The REIT Forum
The 4 ETFs we use for comparison are:
|
Ticker |
Exposure |
|
One of the largest mortgage REIT ETFs |
|
|
One of the largest preferred share ETFs |
|
|
Largest equity REIT ETF |
|
|
The high-yield equity REIT ETF. Yes, it has been dreadful. |
When investors think it isn’t possible to earn solid returns in preferred shares or mortgage REITs, we politely disagree. The sector has plenty of opportunities, but investors still need to be wary of the risks. We can’t simply reach for yield and hope for the best. When it comes to common shares, we need to be even more vigilant to protect our principal by regularly watching prices and updating estimates for book value and price targets.
Ratings: Bullish on RITM-B, RITM-C, RITM-D, MFA-C
Be the first to comment