

Twomeows_IS
Price Action Analysis of SPY
The price action of SPY representing the stock performance of the overall market average has reached a critical point. We observed that:
- Price has reached the 200 moving average (red line) which has been tested at least twice prior as a strong resistance.
- There is also a strong counter-trend line observed and tested 3 times prior.
SPY (ThinkOrSwim)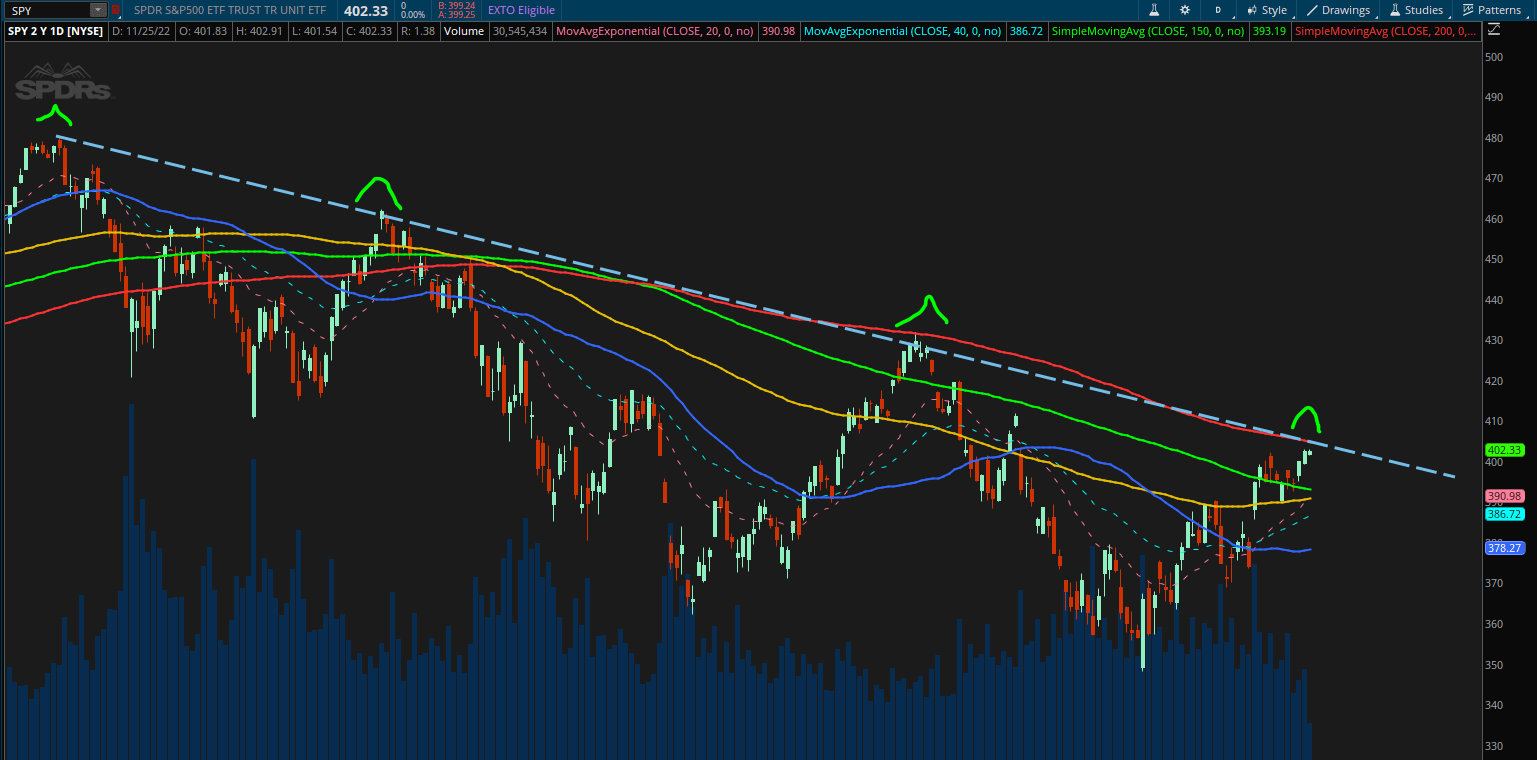
The confluence of 2 strong resistances suggests the price action of SPY is likely to retrace and continue its overall downtrend pattern after a temporary rally over the last month. At the same time, if price action can convincingly break out of this confluence of resistance, it will also suggest a strong likelihood that this “Rally on Downtrend” price pattern is broken and SPY is in the early stages of a long-term rally.
Because of these reasons, investors should watch the price actions of SPY closely over the next few days to decide whether to add more to their investment position to benefit from a potential market rally and eventual recovery.
In my opinion, there are 4 main reasons that the market is near the bottom and we are likely to see a market recovery sooner rather than later.
Inflation Rate Likely Peaked
There are a few reasons for the current market downtrend that is teetering on the brink of a recession. As a consequence of the Covid 19 pandemic disrupting economic activities at almost all levels, what follows is the global energy crisis and supply chain crisis. This crisis is likely made worse by the war in Ukraine. The end result is a runaway inflation that prompted the Fed to increase the interest rates to unprecedented levels since the 2008 housing crisis to curb rising inflation.
The good news is that on the 23 Nov, Fed announced they are moderating the rate increase:
“A substantial majority of participants judged that a slowing in the pace of increase would likely soon be appropriate,” the minutes stated. “The uncertain lags and magnitudes associated with the effects of monetary policy actions on economic activity and inflation were among the reasons cited regarding why such an assessment was important.”
If this ‘slowing in the pace of increase’ in rate hikes follows through, it might provide the much-needed trigger for a full market recovery.
The 10-Year Yield is Falling
According to Investopedia, treasury securities reflect market expectations of future interest rate fluctuations. Even before the Fed makes the announcement to slow down the interest rate on 23 Nov, the 10-year yield futures were already trading downwards, currently below the 50 moving average support (blue line).
10-Year Treasury Yield (ThinkOrSwim Chart)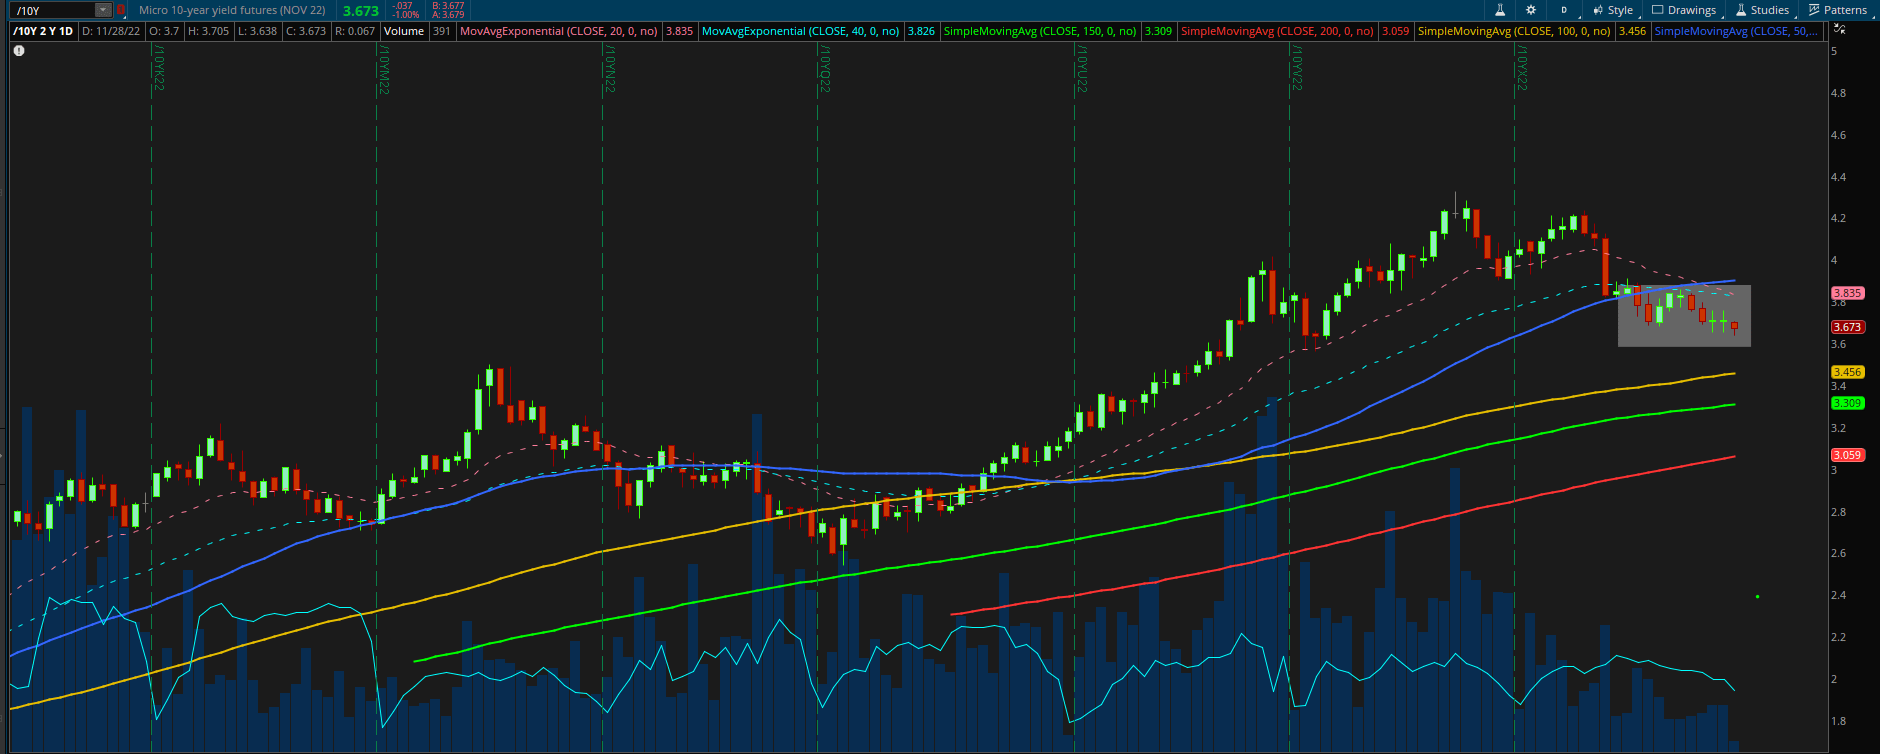
Such price action suggests market participants are expecting ‘future interest rates’ to continue to go down, which is aligned with the latest intentions announced by the Fed to slow down interest rates.
Favorable put/call ratio
If we compare the chart of SPY against the CPCE Put/Call ratio chart, we observed that when the CPCE peaked back in 2020. It coincides with the covid crash of SPY. What follows is a massive rally of SPY to a new all-time high.
Now, we are observing a CPCE level comparable to that during the covid crash. This suggests a rally of SPY similar to 2020 might be following soon.
CBOE Options Put/Call Ratio (StockChart.com)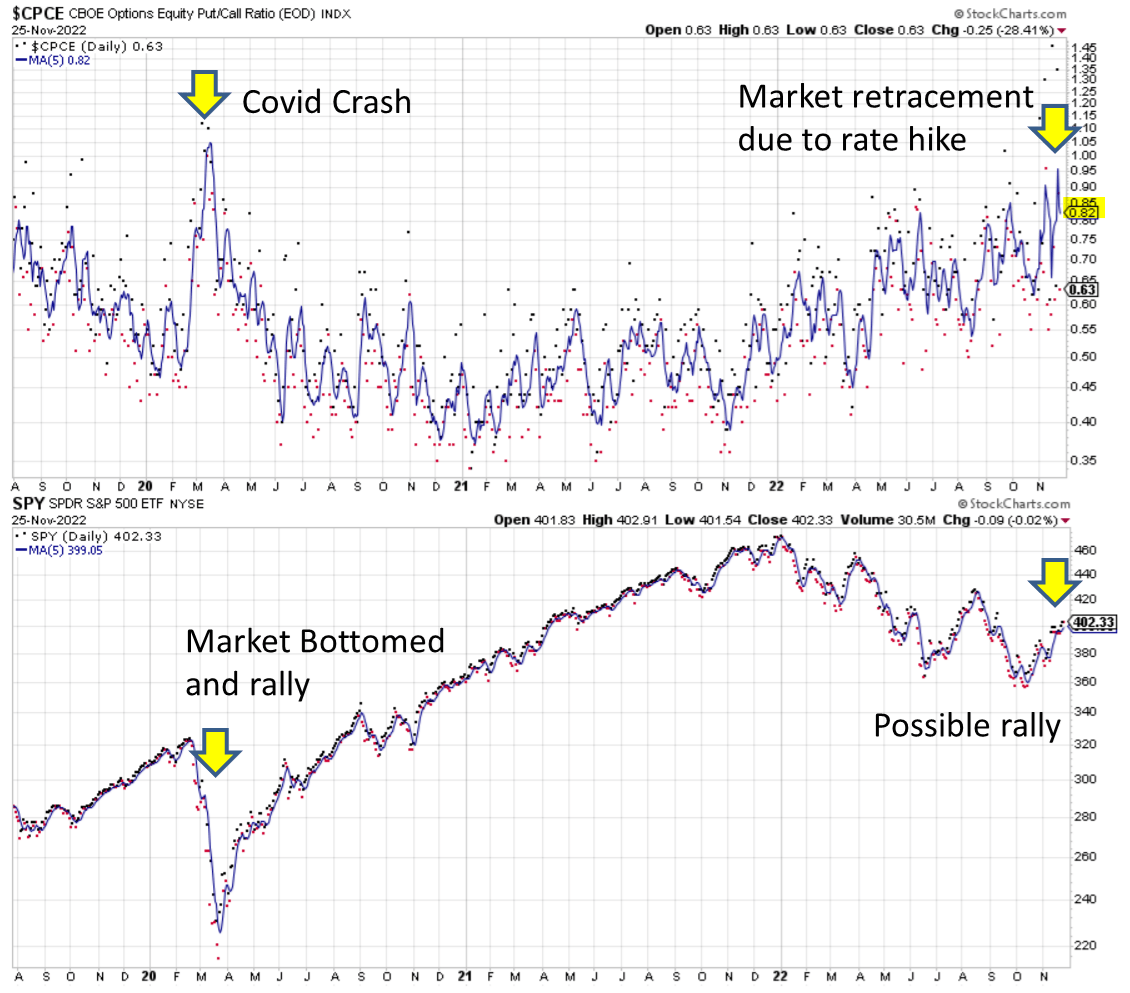
According to Investopedia:
- An extremely high put-call ratio means the market is extremely bearish. To a contrarian, that can be a bullish signal that indicates the market is unduly bearish and is due for a turnaround. A high ratio can be a sign of a buying opportunity to a contrarian.
Investors who believe in such a contrarian view should regard this as an opportunity to add more positions to their current portfolio.
Favorable Bull/Bear ratio
Bull/Put Ratio (Yardeni Research, Inc)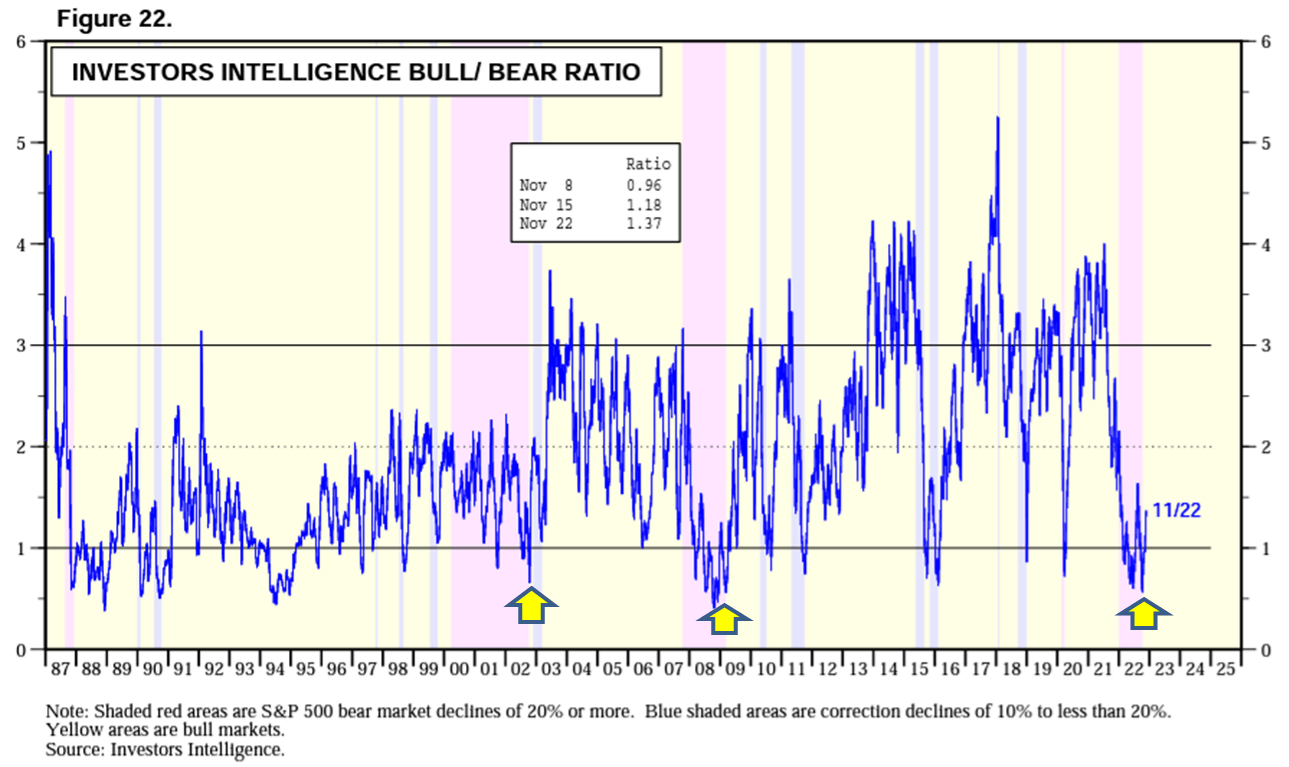
The Bull/Bear ratio indicates the proportion of bullish market participants against bearish participants. The chart above shows that whenever this indication goes below 1 significantly and moves back up, it tends to coincide with the end of the bear market (pink regions).
Conclusion
No one can predict with absolute certainty where the market will go in the short term. However, in the long run, the overall market always goes up. In fact, inflation is one of the reasons why the market always goes up in the ‘long run’. Long-term investors should consider this as an opportunity to add more positions to fundamentally good companies.
Although there are signs that the market has potentially bottomed, investors should also be patient and enter their positions in small tranches using dollar cost averaging techniques. In the short term, the market is driven by emotions and manipulations and so it can still go down significantly before recovering.
Be the first to comment