

Eric Francis/Getty Images Entertainment
By Rob Isbitts
After the strangest market year I’ve ever seen (2022), I think the basic elements of charting can help unlock some very useful perspectives on just how key parts of the market and economy will resolve themselves. Here’s what I consider to be a balanced look at what investors can look for, and my bottom-line conclusions.
Part of that goes beyond market opinions, to a strong opinion I have about how charts literally help us visualize the odds facing us in different markets. And, how some basic technical analysis guidelines can be used to size up this crazy, non-committal market environment that 2022 has left us with.
Chart 1: AAPL
So, let’s start with this chart of the historical trailing Price-Earning Ratio of a stock you may have heard of, Apple Inc. (AAPL). The P/E of that largest of S&P 500 Index holdings traded in a range from about 12x to 20x earnings. Then, as the COVID crash quickly subsided in early 2020, the stock price and P/E ratio vaulted into a new “trading range.” Since that time, AAPL has traded in a P/E range of between 20 and over 40.
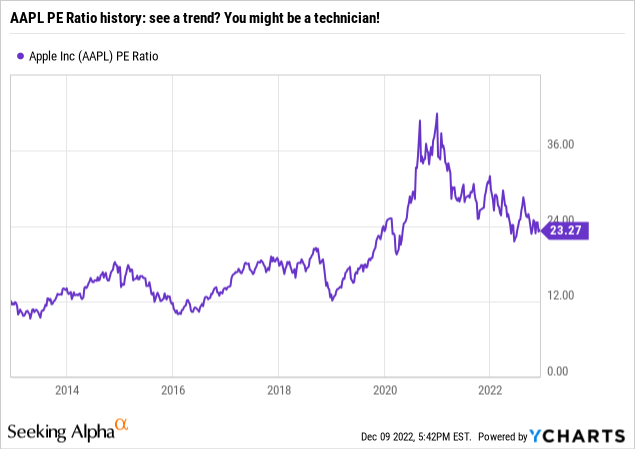
This is no different than monitoring the price behavior of a security. Trading ranges are real. Why? Because plenty of investors, especially big-money investors, follow them and invest based on them!
So, if AAPL’s P/E were break down decisively below 20 and gather a head of steam, we can put two things on the radar: a falling stock price that needs to be reckoned with if you hold it. And, a search for a bottoming of that P/E ratio in the 12x area. Why? Because the market has a memory, and real money trades on this. Even long-term money. I suspect there are investors out there who would love to own AAPL the next time around, but as long-term investors, they prefer an entry point where the trailing P/E is in the low teens, about half that of what it is now. This is essentially where quantitative and technical analysis work together to inform the investor. It also helps them put a valuation on the stock, versus simply being cheerleaders based on hype, analyst ratings, and other sales-tools Wall Street throws at investors all the time.
My bottom-line on AAPL: like so much of the current market, it suffers from price stagnation, a.k.a. a giant, whippy trading range. The stock’s price (chart not shown here) has been in a $50 trading range (about 30% from top to bottom) for the past 18 months. That has allowed the P/E Ratio to come down as earnings kept chugging along. But even if we ignore the price range trap that this and many other stocks are in, that ever-slipping valuation chart above AAPL a “wait and see” for me, rather than putting it on a short list to consider buying or selling with urgency.
Chart 2: Chevron
OK, so that’s AAPL. How about Chevron Corporation (CVX), the oil giant? Oil stocks were the sole high-flyer for most of 2022, after a period of extreme weakness. The energy sector, once the largest in the S&P 500 Index, became one of its smallest. Stock prices for big oil have flown higher, with CVX still up 48% year-to-date, even after a more than 10% pullback. So, now what?
I could regale you with technical charts, but this article is about using a technician’s eye to blend in with the rest of the investor crowd. After all, for decades, we chartists were considered akin to voodoo artists. Then, the big money started following all the things we have followed for decades, albeit with more short-term applications. So after all this time, charts are, well a bit more cool.
CVX’s profit margin is the focus in the chart below. You see that measure has had a lid on it for a decade. Technicians call that a “resistance level.” In other words, when CVX’s profit margin rises to about 10%, it has been a topping point…except this year, where margins exploded upward, 50% higher (15% versus 10%) than that decade-long resistance.
The key now: is this a long-term breakout in margins, which could lift CVX stock higher in the coming 1-2 years? Or, is it what I’d call a “fakeout-breakout,” where investors get all giddy, and that enthusiasm fades. That makes the indicator in question (profit margin in this case), akin to when you throw a tennis ball up in the air. It goes up quickly, stops, and then gravity brings it down fast.
Frankly, if I had mastered that back in the day, I would have been a good tennis player. But I digress.
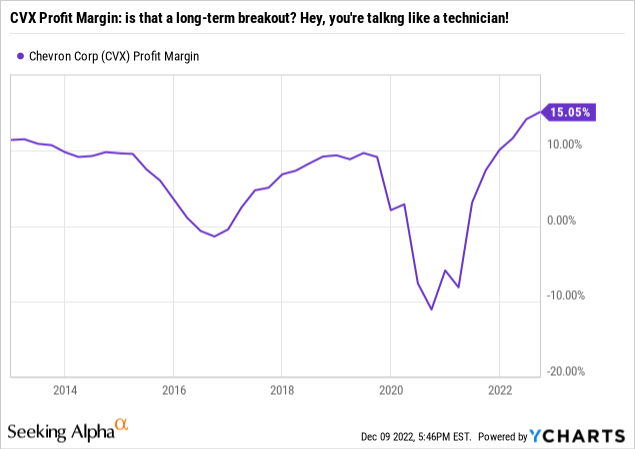
Bottom-line on CVX: sure, the stock price for this sector leader and the energy sector in general had a great year in 2022. However, the chart above suggests that at the very least, CVX needs a rest, unless you are confident that the recent margin boost is a new, higher range that will persist. So, the more quantitative chart agrees with the technical chart (not shown here), in that we are somewhere between a “hold if you own” and “look out below” if price momentum to the downside gets more significant.
Chart 3: CPI
Now, let’s take this technical “happy hour” to the broader economy. The US Consumer Price Index spiked this year. But when you see just how much it spiked, it should give you pause. Since 1980, CPI made it as far as 5% or so, but that was it. This time around, it hit more than 8%.
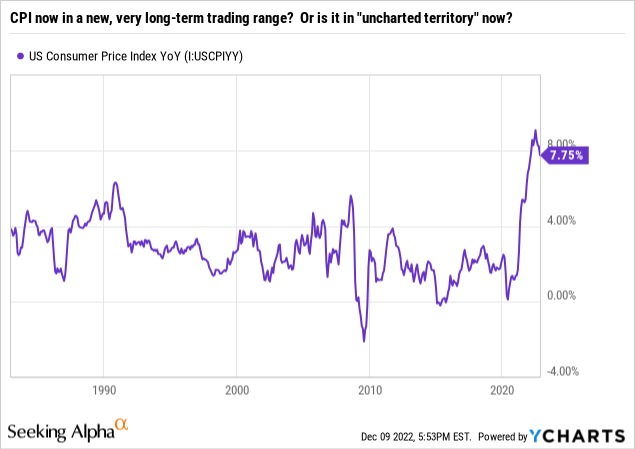
You can see why in the chart. The “central tendency” or very familiar range for CPI to investors since most of us started investing has been in the 2-3% range. If you are more of a newbie investor, you may think that 0-2% inflation was some sort of birthright. It is not. And when you use this chart to understand where the “price” of CPI has been historically, it shines new light on the economic outlook. Falling inflation? Sounds great. But falling to 5% versus 2% is a world of difference. The latter is something investors are used to. The former, not so much.
Bottom-line: But one of the biggest debates I hear among investors these days is, in my view, a false argument. You see, if inflation is coming down, that’s OK. But if it settles in the 4-5% range, as opposed to the 2% range many bullish investors are counting on during 2023, that is not good news for the economy, stocks, and probably not for bonds either.
If you are surprised that inflation is lower after that spike, you shouldn’t be. The bigger thing to expect and watch for is the market’s reaction if we settle in with inflation “only” around 4-5%. My firm belief is that consumers will not get comfortable with that, and the excitement over the relative near-term decline in the CPI will convert to concern about how stubbornly high it remains.
Chart 4: S&P 500 10-Year Rolling Returns
S&P 500 10-year rolling returns (Ycharts and Seeking Alpha)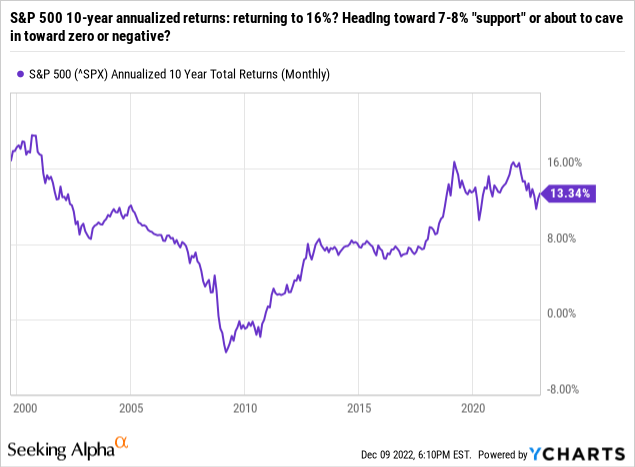
Finally, we look at one of my very favorite “non-traditional” technical indicators. I have used charts like this for over a decade in my written research. And, I think “rolling return” charts like this one for the 10-year annualized returns of the S&P 500 is as helpful a tool to size up markets as any I know.
After all, the market price of any security or index is just a point in time and space. When you connect the dots, so to speak, the analysis jumps out at you, and you can see things for what they are. I think of it as the difference between watching the whole movie versus 30 seconds of that same movie. Which one is going to give you a better understanding of what the movie is about? Obviously, the former.
This is why just tracking investments “year to date” or over other fixed time frames is, in my view, one of the costliest things investors do to decrease their wealth potential. And Wall Street knows this full well. Over the past few decades, big firms have taught investors to draw conclusions over snapshots of data. When I was an investment advisor, I used to use rolling return charts to answer this question: “how often was your return over, say a 12-month period, within a certain range?” If your goal is X%-Y%, and your return has landed in that range 90% of the time on a rolling basis, don’t let the occasional other-10% situation throw you off course. But investors do let that happen. That’s why I present stuff like this!
So, in the case of the S&P 500, the 10-year annualized return spent a lot of time in the 8% range, but in the past 5 years, it has zipped higher into the teens and generally hung out there. This is the risk that so many investors have not accounted for. They assume recent past is prologue. But as you can see, if you look back before 2017, that 10-year return was typically well below that 7-8% “support” level that followed. Blame the Global Financial Crisis for that, but not fully. There were some mediocre years on either side of 2008.
Most significantly from a perspective standpoint, just seeing that there was an extended period of 10-year returns that were negative or very low single-digits should serve as a warning to investors: don’t just assume the returns you have experienced in the past 5 years, even with the intermittent declines as in 2020 and 2022, will just pick back up again. The technical view on this is as follows: there is an 8-16% range from top to bottom, but the range below that will cause distress for many newer investors if it comes to pass. Right now, we are in the middle of that strong 10-year return range. But if 2022 is not the last down year in this cycle, we could see that 10-year return figure drop quickly, as it did on the left side of the chart, following the 2000-2003 3-year bear market.
Bottom-line: predicting what the market’s return will be in 2023 is folly. My opinion on that is as worthless as any out there. But if we want to instead keep our eyes on the prize, we should instead focus on a breakdown in that 10-Year S&P 500 return trend. At first it doesn’t seem like much. But if we start to see it slide into the single-digits, then toward zero, as it could if 2023 is another rough year, that has a more significant emotional impact on investors.
Their long-term appetite and interest in the stock market starts to wane. I’ve seen this three times in my career (1987, 2000, 2008). That would create first a bearish market climate, then the best buying opportunity we’ve seen in a very long time. For that to occur, investors would have to turn from excited to “buy the dip” to near-complete apathy. That is how bear markets end, as opposed to when everyone is looking to buy the bottom.
Putting it all together
All 4 of these charts, and my conclusions on them, can be tied together with a single theme: the investment climate is in a period of stagnation. The first bear market phase came and went, and yielded to a trading range market the second half of this year. Rather than try to put all my chips on predicting the future, I’ll simply conclude that this is a time to gather more evidence and avoid making wide-reaching, sudden moves. The market environment of late 2022 and early 2023 has yet to show you that will be rewarded since rallies don’t last. And, dives toward new lows also don’t follow through. Trading ranges are part of technical analysis, whether it is applied to the basic visual above, or to a complex set of technical/price indicators. Keep that front of mind, you can enter 2023 with the type of balanced readiness that every investor should strive for.
Technical Analysis: we mock because we love?
My late father taught me to chart stocks by hand when I was 16. Graph paper and pencil were our tools. He never did this professionally, but he started me down a path that would guide my investment work for decades. It still does, after the fundamental and quantitative parts of the process are completed. 42 years later, technical analysis has become more popular, but way too complex. It is also way too controversial than it needs to be. It is simply a way to visualize the story the market, or a security is trying to tell you.
The 4 examples shown are among many I could use to depict what I see in the current environment, using what I consider to be “basic technical analysis.” As with most things in investing. there are no wrong answers here.
My goal was to alert some investors to what visualizing past and recent investment activity and can do to broaden your perspective. The one thing we all have in common as investors: we want to make good decisions!
As iconic comedian Jeff Foxworthy (pictured at the top of this article) might say, you might be a technical analyst! This, despite many investors walking around thinking that the work of technicians are of little value, and that earnings trends and P/E ratios are all that matters. My response: it depends what you mean by “technician.”
If you say things like “this stock’s P/E Ratio makes it cheap right now,” you might be a technician.
And, if you think CPI data should be viewed in a picture, with the noise of the month-to-month changes smoothed out, you might be a technician.
Oh, and if you think the Federal Reserve’s “dot-plot” means anything, then say it with me: you might be a technician!
Be the first to comment