

Eric Francis/Getty Images News
Risk comes from not knowing what you are doing – Warren Buffett
Written by Sam Kovacs
Introduction
Not everyone agrees with us. Thankfully our results do.
Unlike many dividend investors, we believe that investors should sell overvalued stocks and buy undervalued stocks.
The idea being that in so doing, you can shift to value and increase your income dramatically.
Index investors tell us that we’re just the lucky benefactors of randomness. Buy and hold investors tell us that what we’re doing is extremely risky.
Some have this fallacy that by selling a stock and buying another, you need to bat 100 because your replacement needs to do well.
This makes no sense. If you choose not to sell, the stock you keep needs to do well also.
The fact that you never sell is only masking your subpar returns, not actually changing them.
Here’s an analogy which you should understand.
Let’s say you have a basketball team. All of your players are All Stars. The best of the best.
Say you play 5 of these players for 35 minutes in the regular time. The game goes to overtime. Your starters are now overextended, they’re tired, they’re running out of steam.
Remember, the bench is full of players who are just as good, and are rested. What do you do?
Of course, you sub your tired players and put on the well-rested players.
Think of stocks the same way. The pendulum always swings. The MAD Charts I’ll present to you in this article will prove this.
Back in August, I wrote an article where I gave 5 stocks to sell before the next pullback: Nike (NKE), Moody’s (MCO), Honeywell (HON), Domino’s Pizza (DPZ), and Intuit (INTU).
Of course, we got the usual responses, which I suppose we’ll get this time around. Half of the people get it. The others don’t.
“Trying to time the market is a sucker’s game”.
“Selling an entire position of a blue chip company is a recipe for disaster”.
Just a semester later, and the real recipe for disaster would have come from holding these stocks would have been a bad idea.
Dividend Freedom Tribe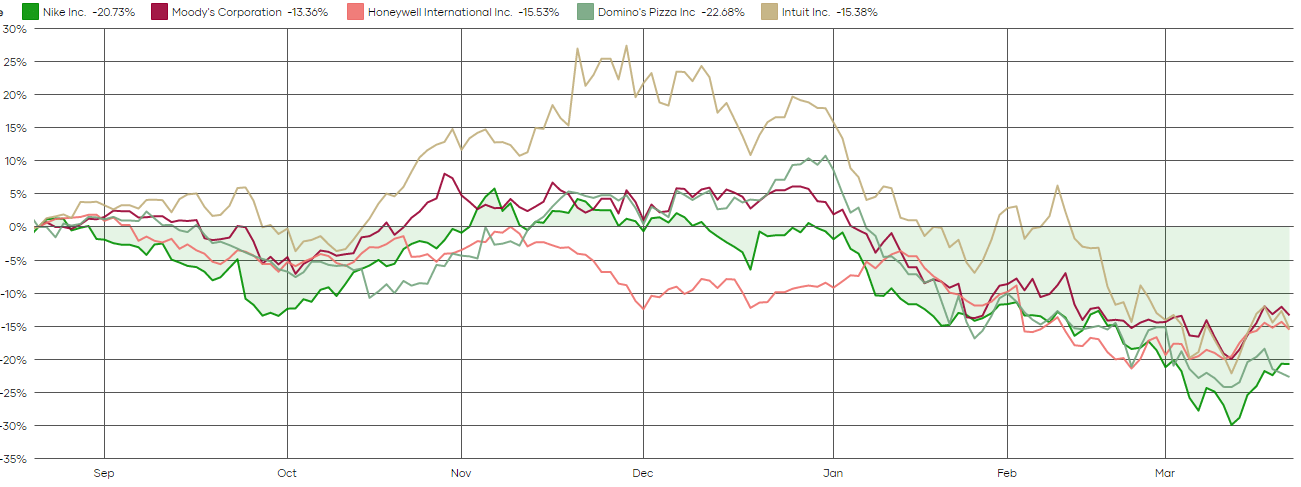
The best of the bunch is down 12%, the worst of the bunch is down 22%.
On the other hand buying undervalued stocks that we were actively suggesting investors buy over the summer, such as Chevron (CVX) or Nexstar Media (NXST) among others, would have been a good idea.
Don’t make your life overly complicated. Focus only on all stars, and bench those which are out of breath for those who are well-rested.
Here are 3 such trades you should make before the S&P 500 (SPY) goes on its next leg up to 5,000.
Sell WMT buy CLX
Walmart (WMT) is one of those dividend aristocrats you simply can’t go out criticizing. We’ve been saying that WMT has been a sell for over a year, and while the stock hasn’t fully corrected, it hasn’t exactly gone anywhere either.
Look at the MAD Chart below.
Dividend Freedom Tribe – WMT MAD Chart
At today’s price of $142, WMT yields 1.58%.
As a dividend investor, if you’re gonna invest in stocks which yield 1.58%, you need an awful lot of dividend growth to compensate you for the low yield.
We have a rule of thumb threshold, that says that to make a dividend stock a good investment, it needs the potential to yield 8% on the original investment in 10 years, after accounting for dividend reinvestments.
This means if you invest $10K today, you want $800 in income for it to be a good potential investment.
If it has the potential to do $1,000 on $10K in 10 years, then it’s a great income investment.
Let’s look at the income that would be derived from a WMT investment over the next 10 years if you invest 10k and reinvest dividends, while it grows at 3% per annum (the 10-year CAGR).
Dividend Freedom Tribe – WMT Income Simulation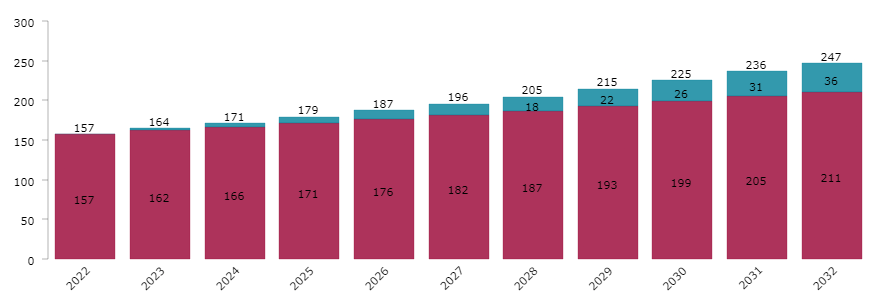
In year 10, you’d receive a sensational $247, or a 2.47% yield on the initial investment.
This is pathetic, and not worth pursuing. To be an interesting dividend investment WMT has a required growth rate of 16% to 19% per annum. That’s not EVER gonna happen.
Why would you hold onto WMT as an income investor given these subpar prospects, when you could sell and buy another blue chip like Clorox (CLX)?
We started buying Clorox in the summer of 2019 at $154 per share. In April 2020, at $184 we suggested investors should hold on, and we ultimately exited at average costs just over $200 in the summer of 2020.
And it is now time to buy back into CLX, as the stock has gone from inflation hero to inflation’s ugly duckling as margins came under pressure.
Dividend Freedom Tribe – CLX MAD Chart
The MAD Chart above should convince you that the pendulum always swings and that you only want to partake in half of those swings.
Had you bought CLX alongside us and sold alongside us, you’d be up 29% minus any provision for taxes.
Had you bought CLX and held onto your bag, you’d be down 14%.
As long as whatever you bought after selling Clorox 19 months ago didn’t plunge 45%, then you’d be doing better than the buy and hold investor. It’s not voodoo, it’s common sense.
At a 3.47% yield, CLX is approaching its decade-long maximum yield of 3.6%. During the past 30 years, CLX has never yielded more than 4%. That happened for a brief episode during the Great Financial Crisis.
But CLX is still a top-quality stock, as this slide from their recent investor presentation will remind you.
Seeking Alpha – CLX Investor Presentation
And management still prides themselves in delivering dividend growth higher than peers.
Seeking Alpha – CLX Investor Presentation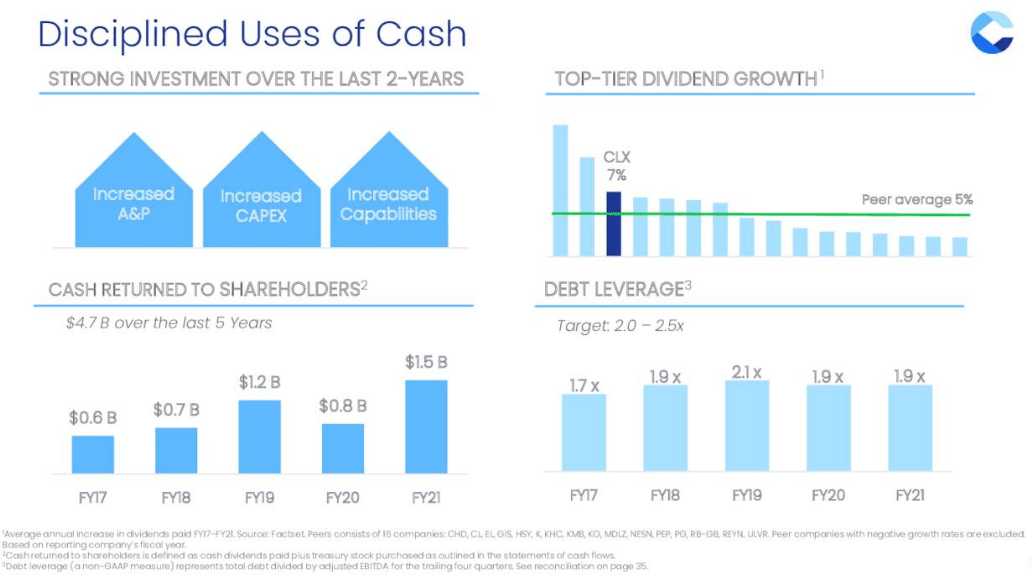
To be a “good” or a “great” income investment as defined above, CLX needs to deliver 5.2% to 7.7% dividend growth.
I believe the company will likely be able to grow within that range and expect growth to normalize to 5% to 6% over the next decade.
This is sufficient to make it a value buy, for the first time in years.
Selling WMT to buy CLX would move you from one very high quality consumer staple company to another, but double your income in the process and give you the potential to have up to 4x more income in 10 years.
It’s common sense.
Sell IRM Buy O
Let’s move on to a REIT pair trade. We have bought and sold IRM a pair of times over the past few years.
In June and August 2020, we made the case for buying the stock when it was priced at $28-$29.
We really wanted you to buy the stock back then and for good reason. Robert went as far as saying that you’d “hate yourself for not buying the stock”, which wasn’t sensationalism.
Since then the stock has returned over 100% when including dividends, or nearly 3x as much as the S&P 500.
But as we told our members a few months ago, with the lack of dividend growth sustaining for a long time, and IRM reaching valuations which have been at the top of its range for the past 7 years, taking gains definitely makes sense.
Dividend Freedom Tribe – IRM MAD Chart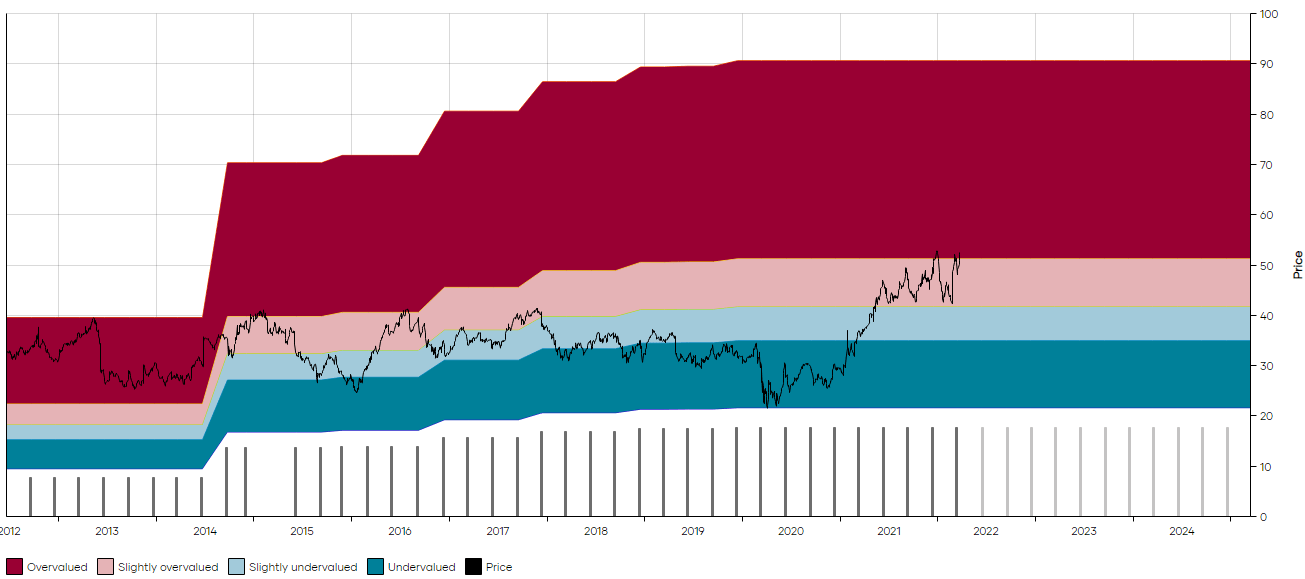
On the other hand, Realty Income (O) is now once again becoming attractively priced.
Unlike IRM, O trades in a much tighter range, and our buying and selling has been a little more nimble. We bought it last at $57, then sold at $68 and $72 last summer.
Yes, the price is only 10% below that level now, but you mustn’t think of it that way.
Our Hybrid model portfolio has returned 13.4% since then while O has been down 10%.
So in reality, making the decision to sell O and favor other elements of the portfolio was a 24% difference in performance.
And now that the dividend has increased 5%, O has proven that it is once again in a position to increase its dividend at a higher rate making it attractive at $66.
Dividend Freedom Tribe – O MAD Chart
Sometimes buying and selling make you look like a fidget, but let’s not ignore the value of the time you had while not being invested in a position.
O yields 4.44%, which is slightly less than IRM’s 4.7%, but its dividend potential is a lot better.
If O continues to grow at 4-5% per annum, it will work out very nicely.
It currently has a required growth rate of 1.7% to 4.1%. I believe the dividend will grow just above the upper end of that range.
Investing 10K today in O, assuming dividend reinvestment and a 4.5% dividend growth rate, will net you $1,110 in 10 years, or 11% on your investment.
O is superior to nearly all REITs in quality and is a great buy at $66.
Sell XOM Buy VLO
Now this one is a little more nuanced, as when you’ll look at the MAD Chart for Exxon (XOM) below, you’ll realize that it’s currently yielding more than its 10-year median yield.
FYI, the 10-year median yield is represented by the line where the pink and blue areas meet. The red and deep blue break off at the 1s and 4th quartiles.
With a current yield of 4.22%, XOM still yields more than its 3.7% median.
At the current rate, it has a required growth rate of 2.49% to 4.9% per annum.
Now I don’t doubt that Exxon can deliver such growth, it hasn’t demonstrated this in the past year, and as the company interrupted its multi-decade long streak of dividend hikes during the height of the pandemic (which IMO was a mistake they should have made a token increase), one can argue that management isn’t as incentivized to increase the dividend aggressively, and rather is more interested in solidifying its balance sheet.
Dividend Freedom Tribe – XOM MAD Chart
While it could go higher, I’m not particularly bullish.
On the other hand, I am bullish on EOG (EOG) which currently yields only 2.5%.
Dividend Freedom Tribe – EOG MAD Chart
However, the company has been increasing its dividend at an incredible rate. Thanks to last year’s incredible 84% dividend increase, it now has averaged 24% annual growth over the past decade, despite this having been extremely choppy.
The thing is EOG is swimming in cash.
The below chart from the company’s investor presentation should show this.
Seeking Alpha – EOG Investor Presentation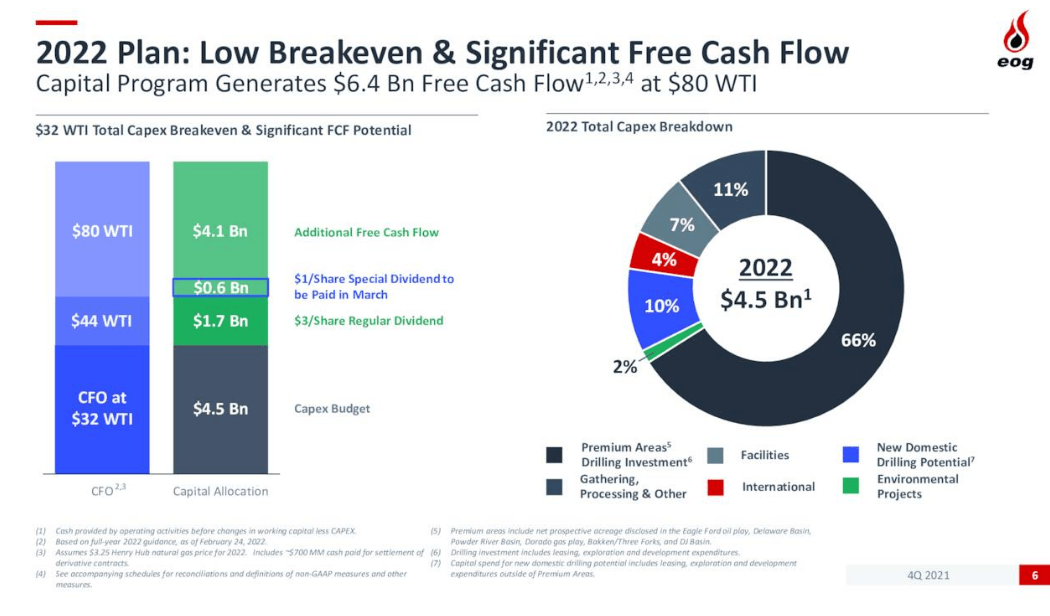
This shows the cash generation at $80 WTI. If the current $110 oil holds, then after paying for all of its CAPEX, all of its dividend, and adding a $1 special dividend per share, then the firm will still have an extra $7bn in free cash flow, enough to do the same all over next year.
Investors can expect more debt reduction, more capex, more special dividends, and more generous dividend increases.
I wouldn’t be surprised to see EOG reach $160 to $170 this year.
Conclusion
All of these 6 stocks are very high quality businesses. But the pendulum swings in varying directions for different stocks at different times. Some also just have better growth opportunities, as the last example showed.
Don’t get attached to your stocks. They are a means to an end and not an end in itself.
Buy low. Get paid to wait. Sell high.
Be the first to comment