

ThitareeSarmkasat
Written by Nick Ackerman, co-produced by Stanford Chemist. This article was originally published to members of the CEF/ETF Income Laboratory on September 22nd, 2022.
There have been three ETFs that I have tracked for short and ultra-short maturity exposure. I consider these to be somewhat like “cash alternatives.” The heavy emphasis is on “like.” They are susceptible to price declines where cash simply isn’t.
Now that rates are rising, these ETFs are starting to offer some yields once again. Yields are up significantly from last year when we last revisited these funds. I still don’t see them as long-term investments that one would want to hold for years. That being said, if you think we are in for continued volatility, putting some money into these could be a suitable option. That way, you’d be able to easily rotate into more aggressive holdings when the time feels right.
In this space, there are plenty of options. These are just three that I’ve found to focus on that do a fair job. They are also from the largest fund sponsors.
PIMCO Enhanced Short Maturity Active ETF (MINT)
This ETF is an actively managed ETF from PIMCO. PIMCO is a fixed-income powerhouse. They simply “seek maximum current income, consistent with preservation of capital and daily liquidity.”
- Inception in 2009
- Expense ratio 0.37%
- Yield 2.30%
- Dividend frequency: monthly
- AUM $11.25 billion
- Duration: 0.44 Years
JPMorgan Ultra-Short Income ETF (JPST)
An actively managed ETF from JPMorgan (JPM). This ETF is designed to “deliver current income while seeking to maintain a low volatility of principal.”
- Inception in 2017
- Expense ratio 0.18%
- Yield 1.97%
- Dividend frequency: monthly
- AUM $21.77 billion
- Duration: 0.29 Years
BlackRock Short Maturity Bond ETF (NEAR)
Finally, another actively managed ETF is brought to us by BlackRock (BLK). This ETF’s investment objective is to “maximize current income.” They also add that NEAR “seeks to maximize current income through diversified exposure to short-term bonds.”
- Inception in 2013
- Expense ratio 0.25%
- Yield 2%
- Dividend frequency: monthly
- AUM $4.417 billion
- Duration: 0.45 Years
Performance
Over the last year, the performance of MINT, JPST and NEAR has resulted in share price declines. However, these funds have done exceptionally well relative to the market as measured by the S&P 500 and other bond assets as measured by Vanguard Total Bond Market (BND). In fact, they’ve shown almost no movement. That’s exactly what we should expect from these short-duration assets.
Price Returns (Seeking Alpha)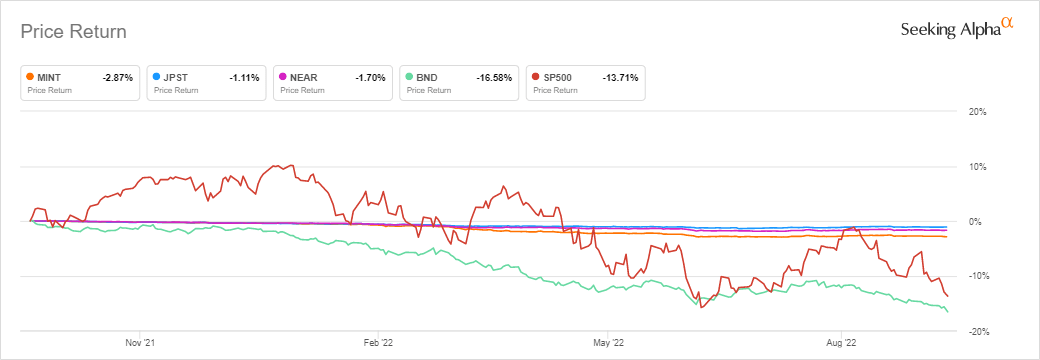
When looking at total returns, we see similar results. Although, JPST has come incredibly close to being almost positive in the last year.
Total Returns (Seeking Alpha)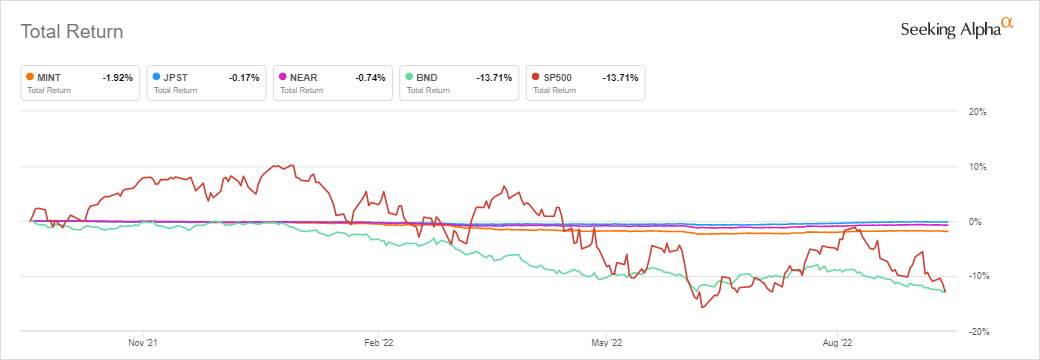
The idea here is this is why I view them as short-term alternatives you can hide out in them for short periods of time. If we look over the last six months now, JPST and NEAR have jumped into a slightly positive total return territory. For MINT, we are still seeing a slight loss. The duration of JPST is lowest at this time compared to the other two, which is seemingly playing a role in the results we see here.
Total Returns (Seeking Alpha)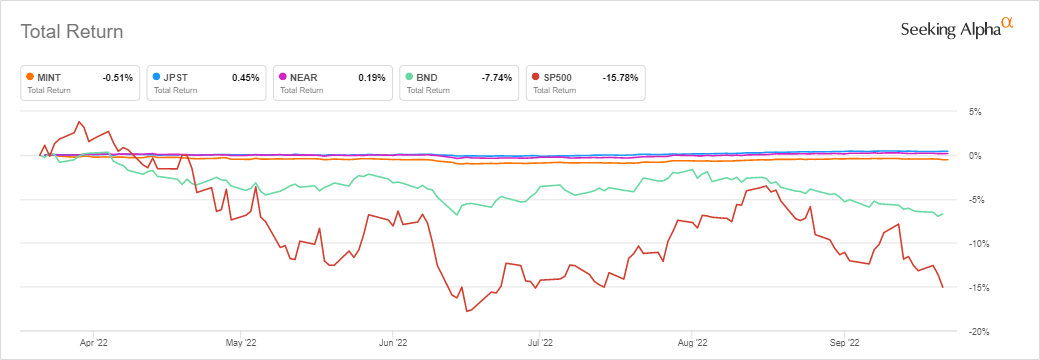
The lower the duration, the lower the negative impact of higher interest rates. At 0.29 years, for every 1% increase in interest rates, JPST’s portfolio would expect to decline by 0.29%. However, around 80% of the portfolio matures in less than one year. This is similar to the other funds with a higher concentration in these short and ultra-short-term maturities. That means they are receiving par back frequently.
With BND, investors have to wait longer to receive par back, with its average maturity at 8.9 years and average duration of 6.7 years. They, too, invest primarily in investment-grade bonds, but waiting longer to receive par back means the portfolio is taking a heavier hit with interest rates.
They also are providing a better outlook going forward due to the higher yields that they are now starting to pay.
Dividends
With rates rising, yields on these ETFs are also starting to rise, with their dividends increasing monthly at this point. With the Fed still on the gas pedal of raising rates, with another 0.75% basis point raise this week, we should continue to see these ramping up.
MINT:
MINT Dividend History (Seeking Alpha)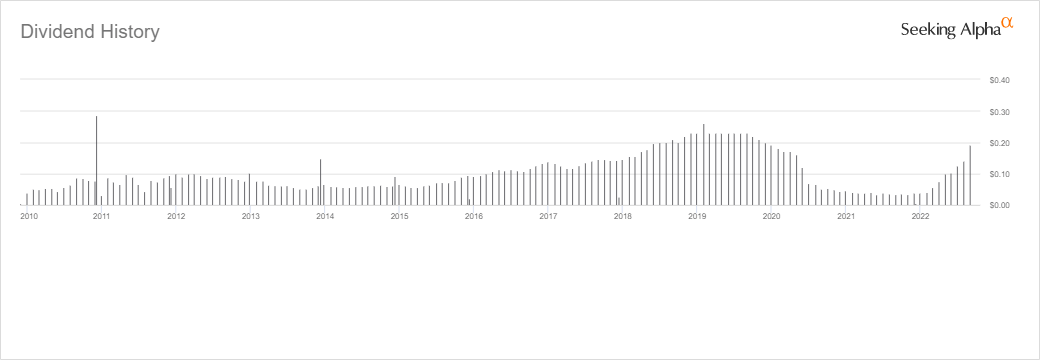
JPST:
JPST Dividend History (Seeking Alpha)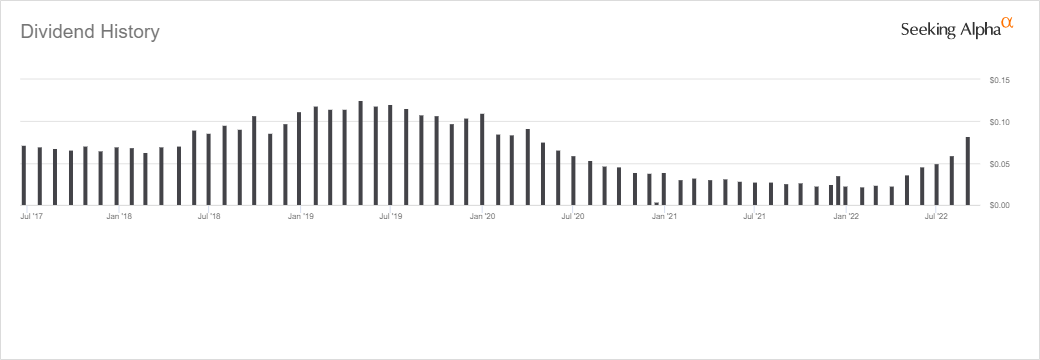
NEAR:
NEAR Dividend History (Seeking Alpha)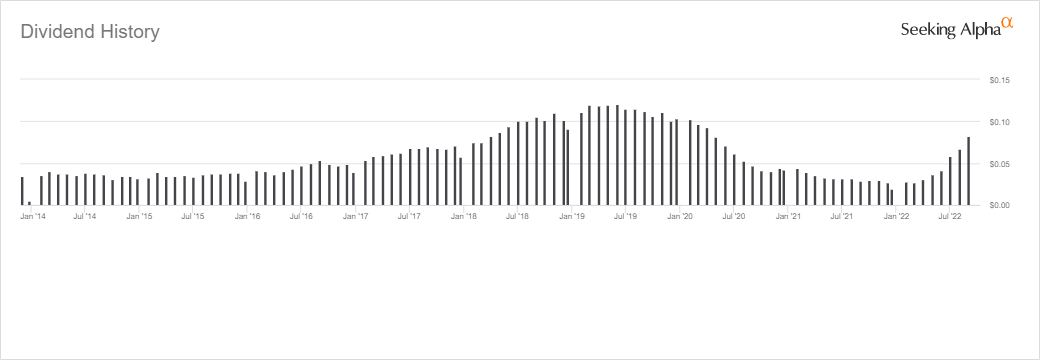
The yields I showed above are only set to rise even further. We can see the same trend in each of these funds. Heading through 2018 and 2019, the dividends for these three were rising. In fact, the Fed’s last rate hiking cycle was passed at the end of 2018. I’m not sure if investors remember the taper tantrum that showed up in Q4 2018, but it did seem to have an impact that investors were nervous about a slowdown.
What I find noteworthy is that the dividends for these funds were still rising through most of 2019 before leveling out a bit. This shows there is some delay between the time that rates are increased and when it stops impacting these funds in terms of their dividends.
Similarly, when rates were slashed to 0% in March 2020 due to the COVID pandemic, there was a downward slope in the dividends. It wasn’t all immediate.
I mean, this makes sense that this would happen because the average maturity of these short-term debt obligations tends to run out around a year. Therefore, as those mature and are replaced after rates are hiked or slashed, it would take some time to work through the fund. The average life of a holding for JPST is 0.56 years. Thus, around 6 months to a year until the dividend finally bottoms out makes sense. MINT is similarly at 0.49 years, but NEAR is the highest at 1.25 years.
Interest Rates
Here’s a look at the Federal Funds Effective Rate over the last ten years. This interest rate chart will also highly correlate with the dividends paid on these ETFs.
Fed Funds Rate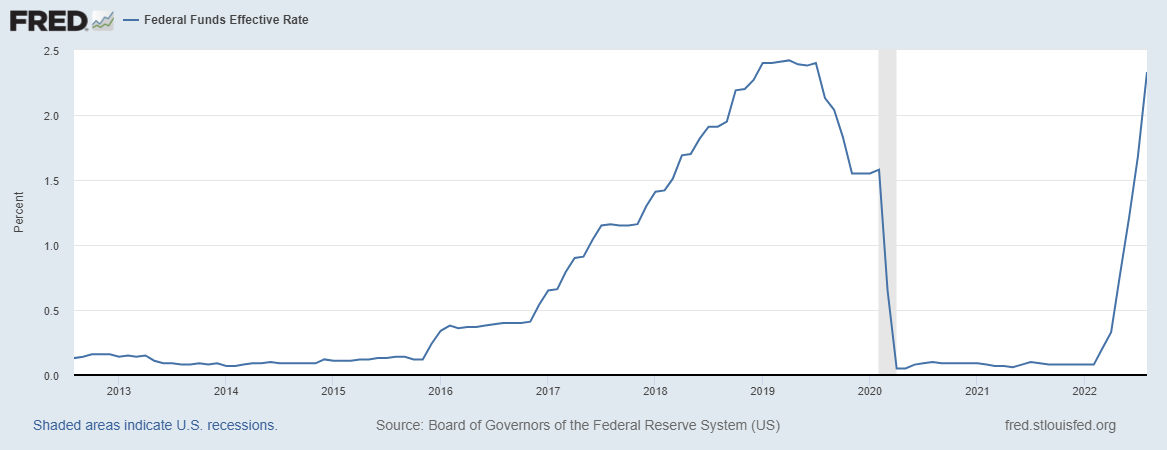
This rate hiking cycle has been quite aggressive to combat the out-of-control inflation. We are already right near the peak of the last cycle. With more rate increases through the remainder of the year, this will top out over the previous cycle.
Over the longer term, we still aren’t near the levels we saw in the 70s and 80s. This provides some context of the type of environment we’ve been in during the last decade; relatively speaking, even the last two decades have been at very low rates. CD rates through the 80s averaged 12%, which seems unfathomable today. I know we had plenty of readers that lived through that period, though.
Fed Funds Rate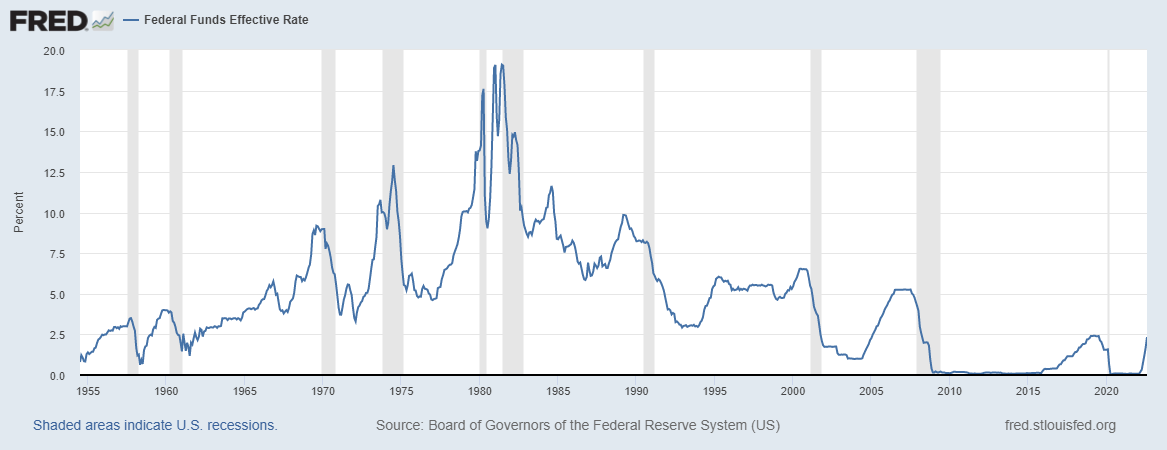
The higher these rates, the higher the yields on these ETFs. With the looks of it, we should be zooming past the previous rate levels. That will result in the yields of these funds going even higher and providing some real money.
Conclusion
All of this being said, rampant inflation means the real return of these funds will be negative as purchasing power will still diminish. Again, that highlights yet another reason why these are more short-term opportunities.
Additionally, some high-yield savings accounts and CDs offer similar or even higher yields at this time. Savings accounts would, of course, not have the risk of falling share price that ETFs have. There are pros and cons to each option.
That also isn’t to mention that with equity and longer-term credit investment prices being lower, I think we should be nibbling into the market. That’s just my personal perspective. I’m never one to know where the bottom is, so I’m doing some buying all the time, with more aggressive buying during downturns.
These would be more for investors comfortable with having some “cash” set aside in short-term ETFs. Ready to deploy quickly to other investments when the opportunity presents itself. Collecting 2-3% yields could be attractive in smaller sleeves of one’s portfolio with a strong likelihood of continued increases, which isn’t the worst place to be.
Be the first to comment