

3 picks to help Seeking Alpha readers grow their wealth. RomoloTavani/iStock via Getty Images
Get ready for charts, images, and tables because they are better than words. The ratings and outlooks we highlight here come after Scott Kennedy’s weekly updates in the REIT Forum. Your continued feedback is greatly appreciated, so please leave a comment with suggestions.
We’re going to focus in on preferred shares again. Usually, the preferred shares are pretty stable. Volatility in this space is pretty rare. It happens during significant market events, but the current level of volatility in the preferred shares is still pretty unusual. The price swings are leading to significant changes in which shares are most or least attractive at any given time. Consequently, I’ve been writing far more preferred share updates for subscribers and want to share more of that work with all my readers.
Last time, we talked about preferred shares from AGNC, NLY, and CIM. Since we covered those recently, I’ll be ignoring them in today’s article even though there are some interesting opportunities there.
This article was prepared for a subscriber update, so prices come from the update. The index cards I’m including use prices as of today’s market close. Therefore, the prices listed in the commentary won’t match the index card perfectly.
NRZ Preferred Shares
NRZ-D: As the only preferred share which uses the five-year Treasury for the reset rate, NRZ-D (NRZ.PD) is in a unique position and may be excluded from some databases. We find the use of the 5-year Treasury as being attractive and think it warrants NRZ-D getting a higher price. All else equal, we would prefer to use the 5-year Treasury rate, so that’s a favorable factor. Regardless, the unusual factor may be negatively impacting NRZ’s price. If I were in NRZ’s shoes, I’d be tempted to repurchase and retire some of these shares.
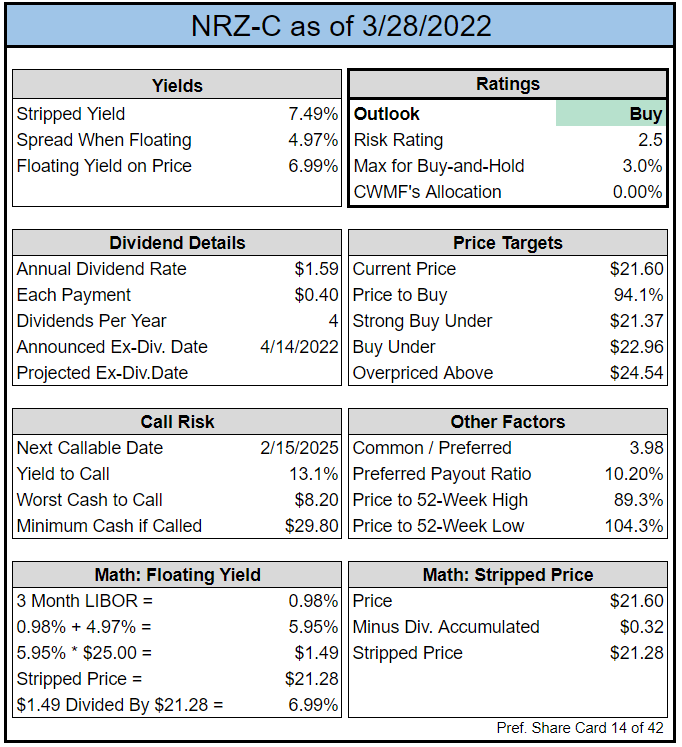
Contrasting NRZ-D with NRZ-C (NRZ.PC), I think NRZ-D will offer more income than NRZ-C. However, NRZ-C will offer more upside to call value. Either would be a good choice.
NRZ-D really stands out for the 5-year Treasury rate combined with the large floating spread. If the 5-year Treasury rate doesn’t decline significantly, it would mean a big dividend increase for NRZ-D. Really big. It would raise the yield by nearly 2%. That’s a big boost.
NRZ-C: Much like NRZ-A (NRZ.PA) and NRZ-B (NRZ.PB) but with a lower floating spread. Who wants that lower spread? I think it’s a much better deal. For instance, NRZ-A trades at $25.08 vs NRZ-C at $21.47. Putting dividend accrual aside, an investor in NRZ-C can buy 1,168 shares for the price of 1,000 shares of NRZ-A.
The floating spread is only 4.969%, but the investor in NRZ-C gets 16.8% more shares. In the future, they will earn the floating spread and the short-term rate on those shares. Since the investor gets 16.8% more shares, it is the equivalent of getting a floating rate of 5.804% (compared to the 5.802% on NRZ-A). Except, NRZ-C also gets the short-term rate on the extra shares. So if short-term rates were ZERO, then NRZ-C would generate a tiny bit more income by virtue of a greater share count. If rates are higher, the margin by which NRZ-C wins is increased.
When we consider call value, this is a pretty easy question. Is the call risk worse for the share trading at $25.08 or the share trading at $21.47? When the investor buys at $21.47, there is no reason to be concerned about the “call risk”.
Does NRZ-A win at anything given current prices? Yes, the stripped yield is a tiny bit higher (7.58% vs. 7.53%). That’s not worth much. Literally, pennies.
The REIT Forum The REIT Forum The REIT Forum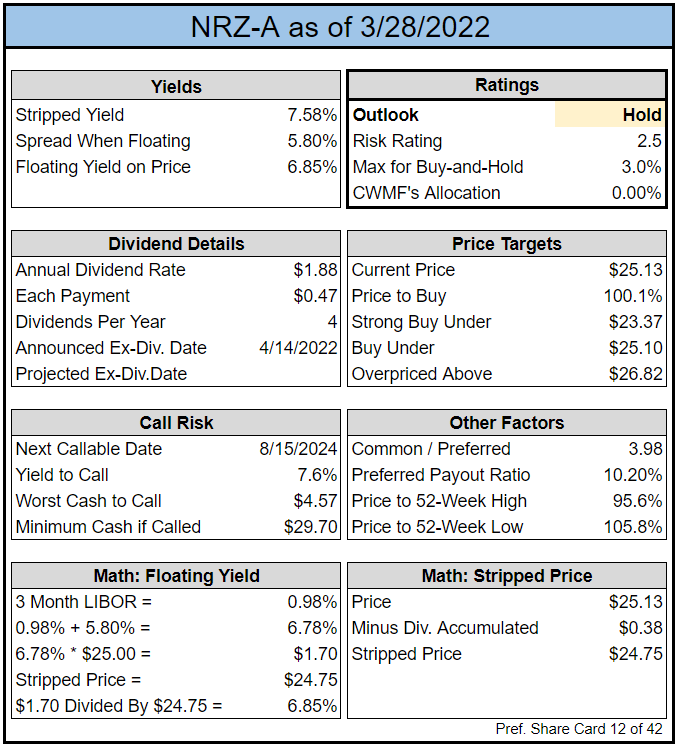

MFA Preferred Shares
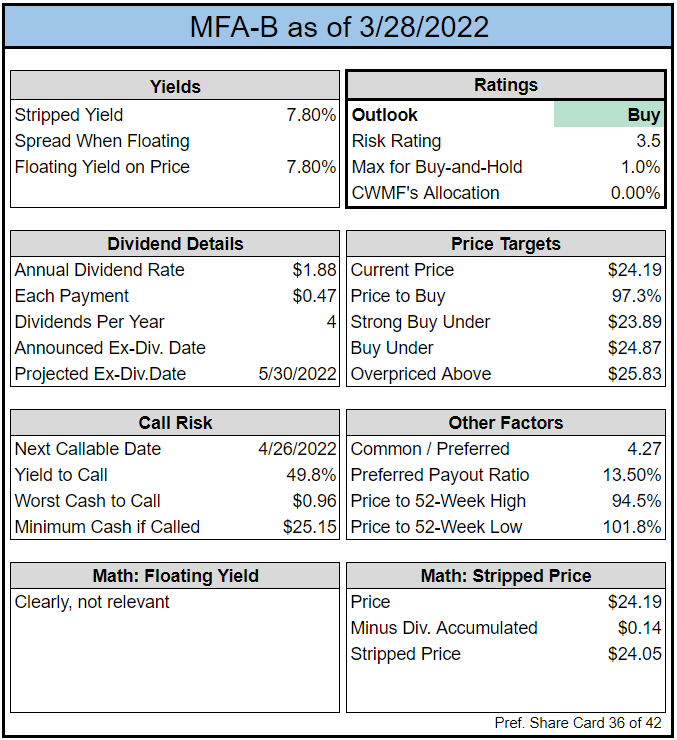
MFA-C: Similar situation to NRZ-C. MFA-C (MFA.PC) just offers a nice overall value. The floating rate at 5.352% is pretty average for the risk rating. However, MFA-C trades at $21.98 compared to MFA-B at $24.40. While MFA-C has a lower yield today, it has far more upside to call value. Further, if rates are even modestly higher when the floating rate kicks in, it would mean an increase in the dividend rate. The initial coupon was only 6.5%, so if short-term rates are higher than about 1.15%, it means bigger dividends. If those short-term rates are anywhere near 2% or even 4%, then MFA-C is a dream come true.
The REIT Forum The REIT Forum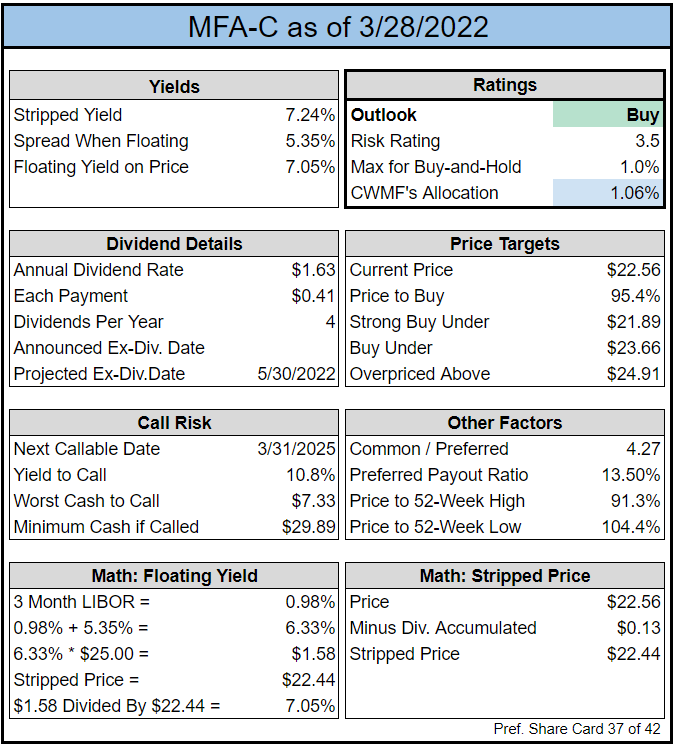
Risks
There are a few risks. The mortgage REIT could fail (unlikely given NRZ’s relatively low-risk rating for common shares).
Note: NRZ’s preferred share risk rating and common share risk rating appear to conflict. However, the scale for preferred share risk ratings is harsher than the scale for common shares. For instance, a preferred share with a rating of 3 would generally be significantly less risky than a common share with a rating of 3.
Further, the preferred share risk rating is not limited to fundamental risk. It also includes the risk of volatility. As valuations have demonstrated over the past few months, both risk ratings were correct. NRZ’s common shares have performed well compared to the sector. Yet, some of NRZ’s preferred shares took an unreasonably large hit.
While MFA Financial (MFA) has a higher risk rating on common shares, MFA’s portfolio is in a pretty good position. Significant appreciation in home values makes homeowners very reluctant to default. While the assets MFA owns have credit risk, I wouldn’t expect them to be severely hit by that risk unless the housing market collapses like the great financial crisis.
Is that possible? Yes, it’s “possible”. However, it isn’t remotely probable. While home prices are a bit on the high end (in my view), they weren’t driven there by the same level of speculation. There is a risk of home prices declining, but I would be shocked if they declined to the extent necessary to impair MFA’s preferred equity. That’s a very unlikely event in my view.
It’s also possible for another financial crisis to emerge. We saw a significant financial crisis during the pandemic. Remember, home prices did not fall during the pandemic. Instead, we saw mortgage REIT book values fall as part of a financial crisis due to wider credit spreads, but the underlying homes were fine. Such a financial crisis is unlikely to repeat. The safeguards in place are better today.
Conclusion
Solid choices are still available in this sector. We’ve seen a big rally for some of our positions, but that doesn’t remove all the bargains. This is why we’ve put so much capital to work. It’s an opportunity to lock in a solid yield which also carries significant upside to call value. That’s a nice combination and we went over a year without opportunities like this.
The rest of the charts in this article may be self-explanatory to some investors. However, if you’d like to know more about them, you’re encouraged to see our notes for the series.
Stock Table
We will close out the rest of the article with the tables and charts we provide for readers to help them track the sector for both common shares and preferred shares.
We’re including a quick table for the common shares that will be shown in our tables:
Let the images begin!
Residential Mortgage REIT Charts
Note: We are modeling some significant changes to BV since 12/31/2021 and some management teams have already publicly indicated a material change in BV per share. The chart for our public articles uses the book value per share from the latest earnings release. Current estimated book value per share is used in reaching our targets and trading decisions. It is available in our service, but those estimates are not included in the charts below.
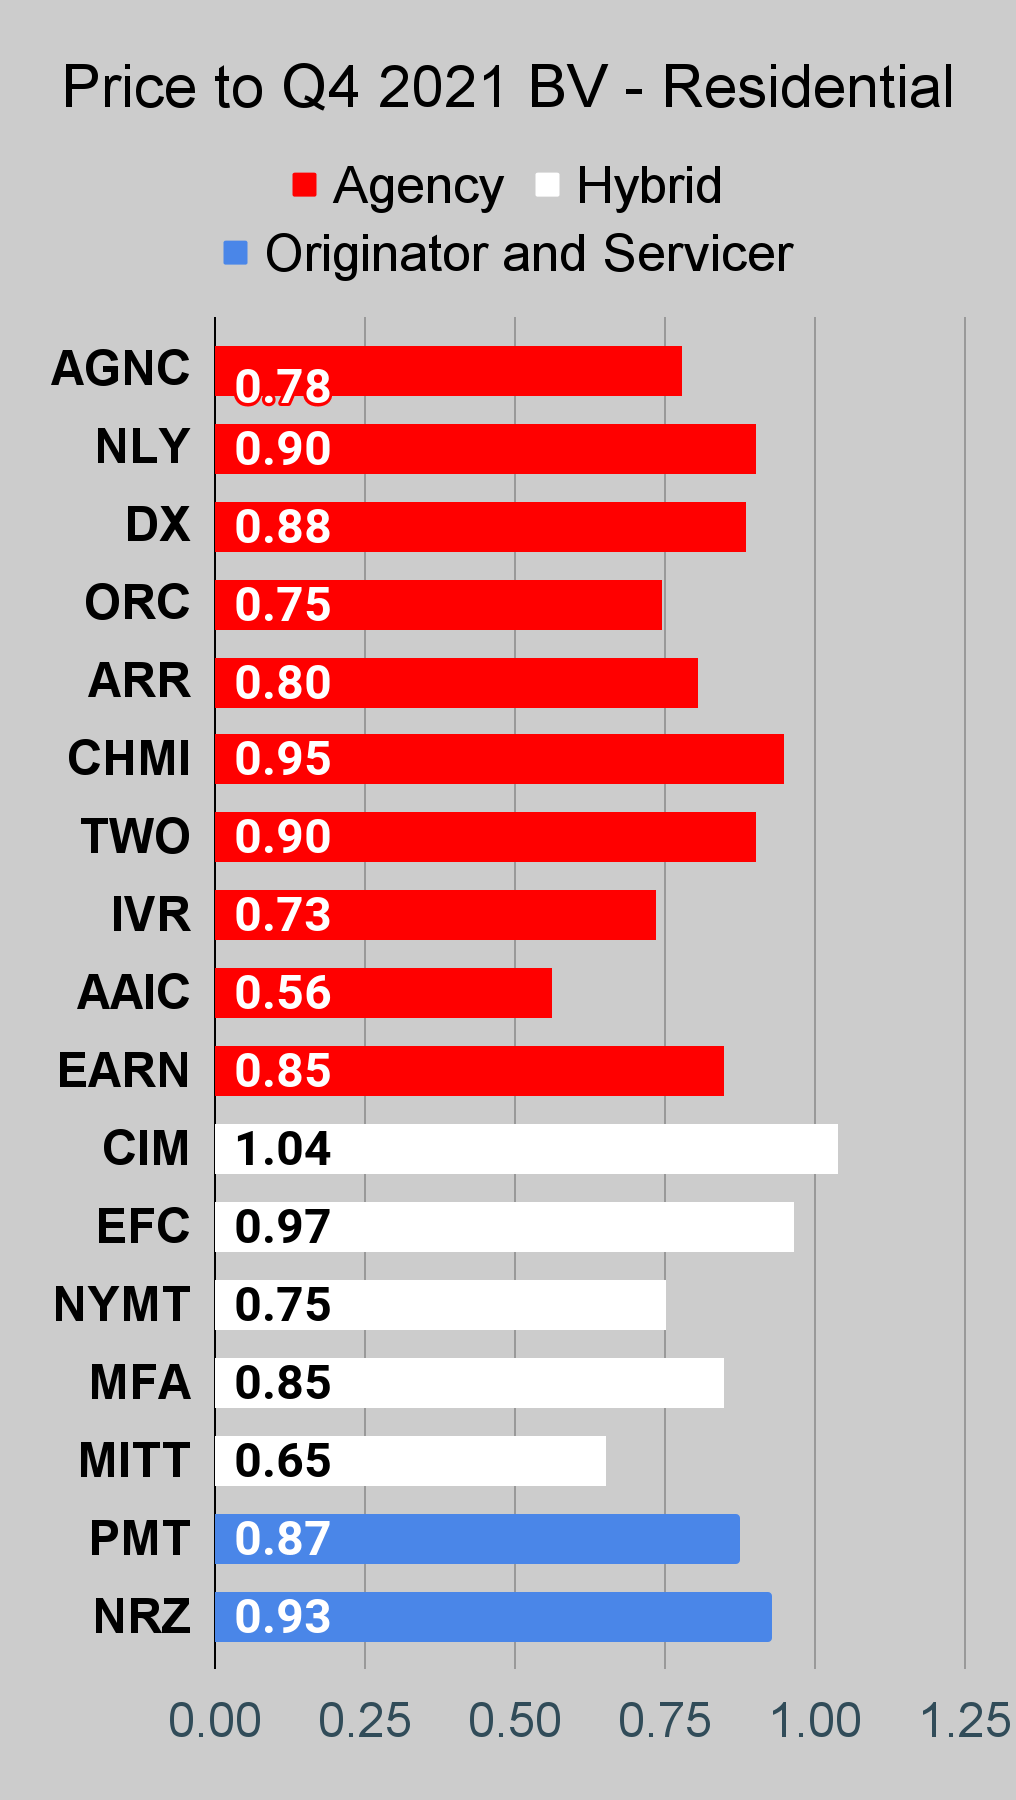 The REIT Forum |
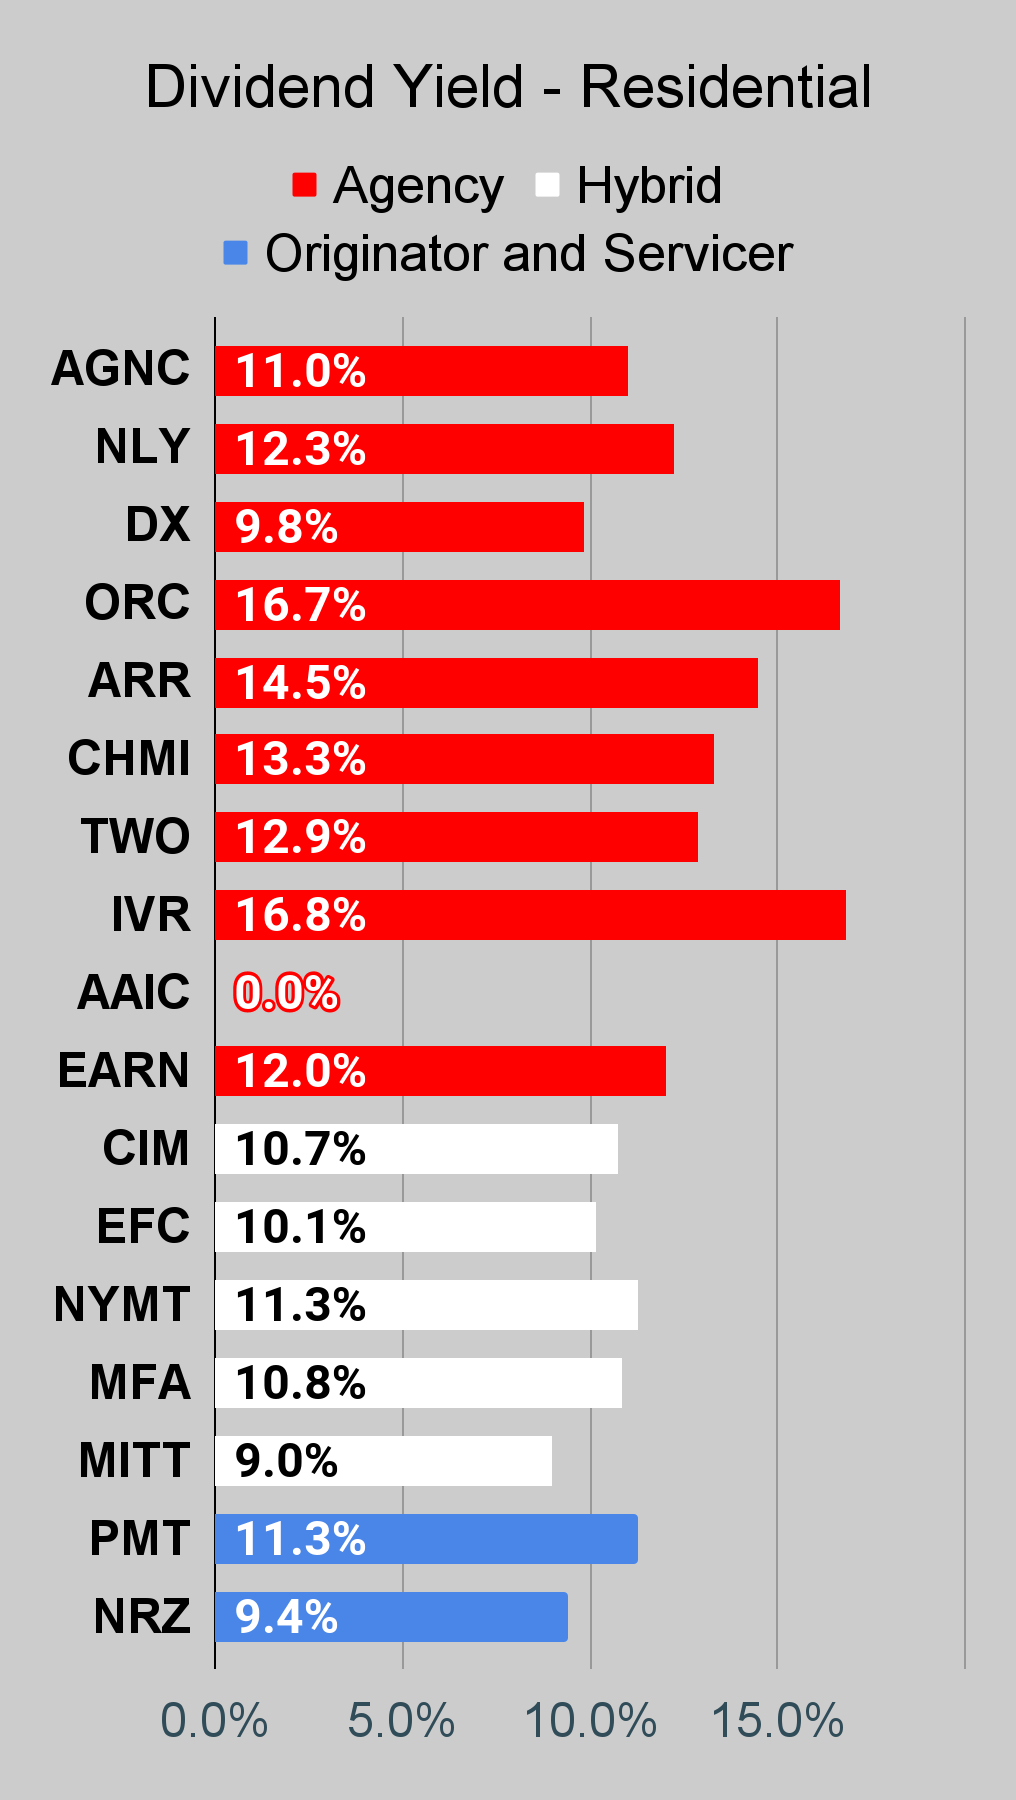 The REIT Forum |
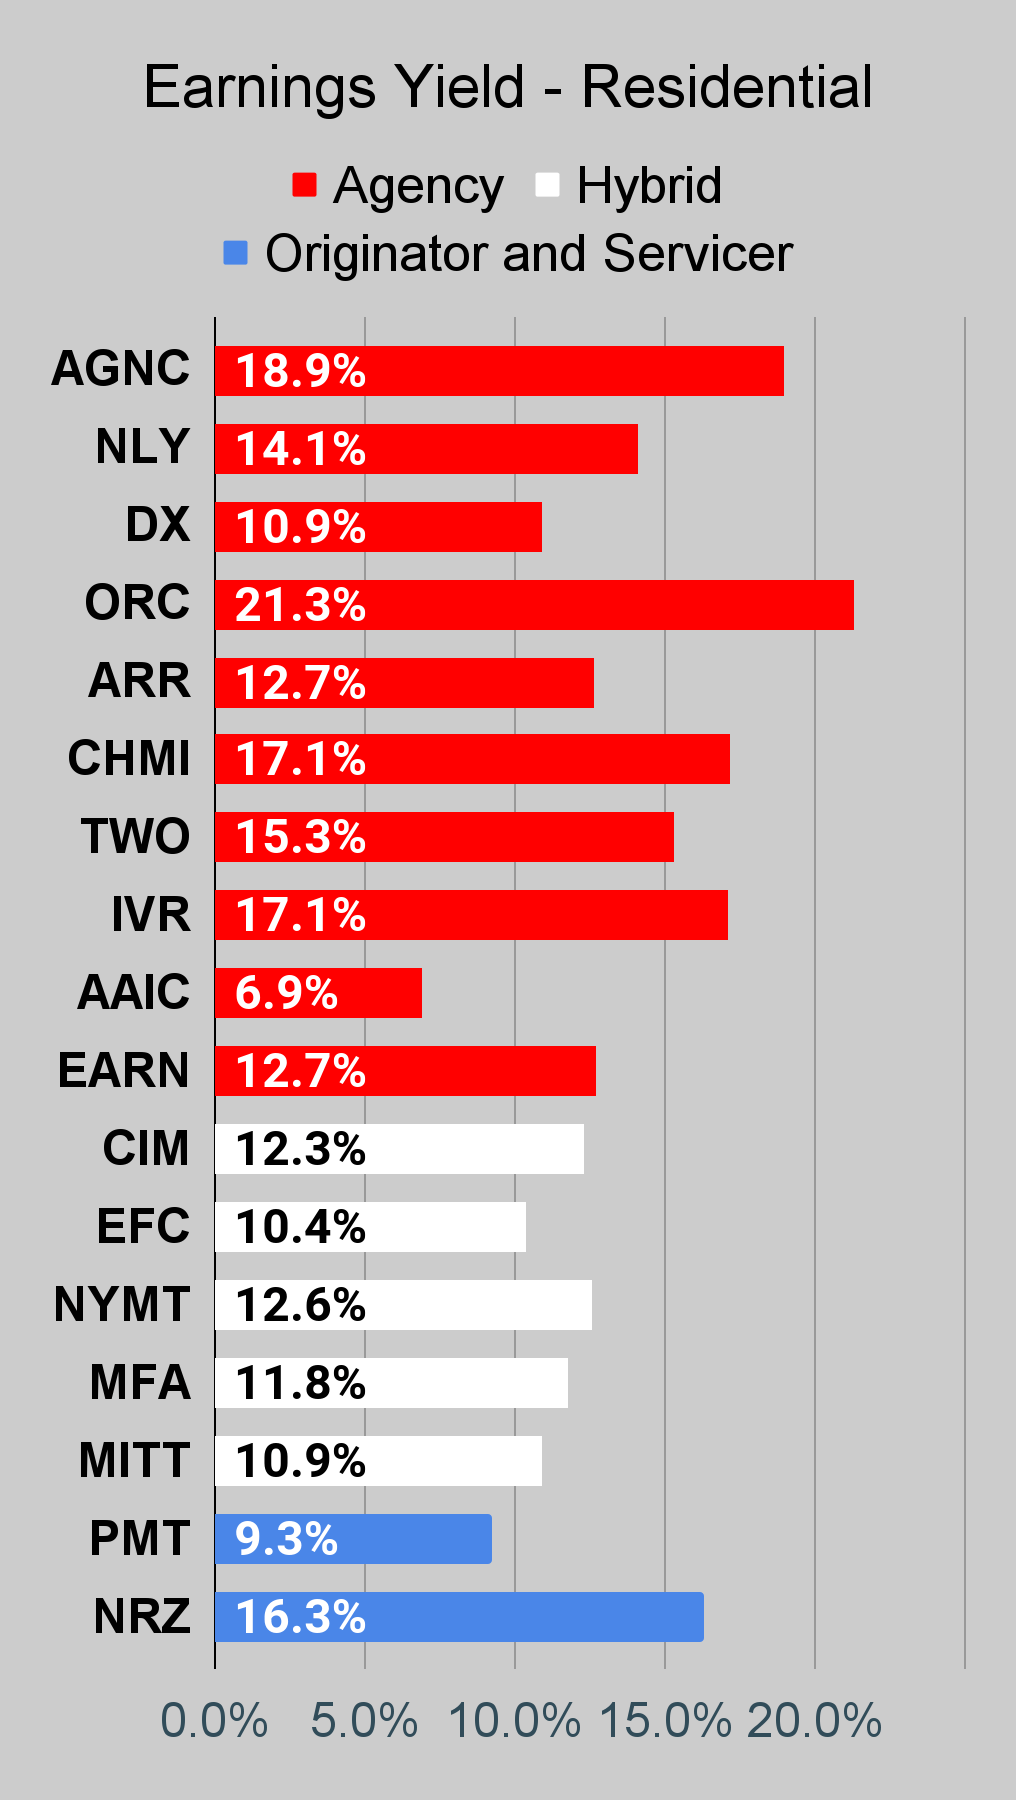 The REIT Forum |
Source: The REIT Forum
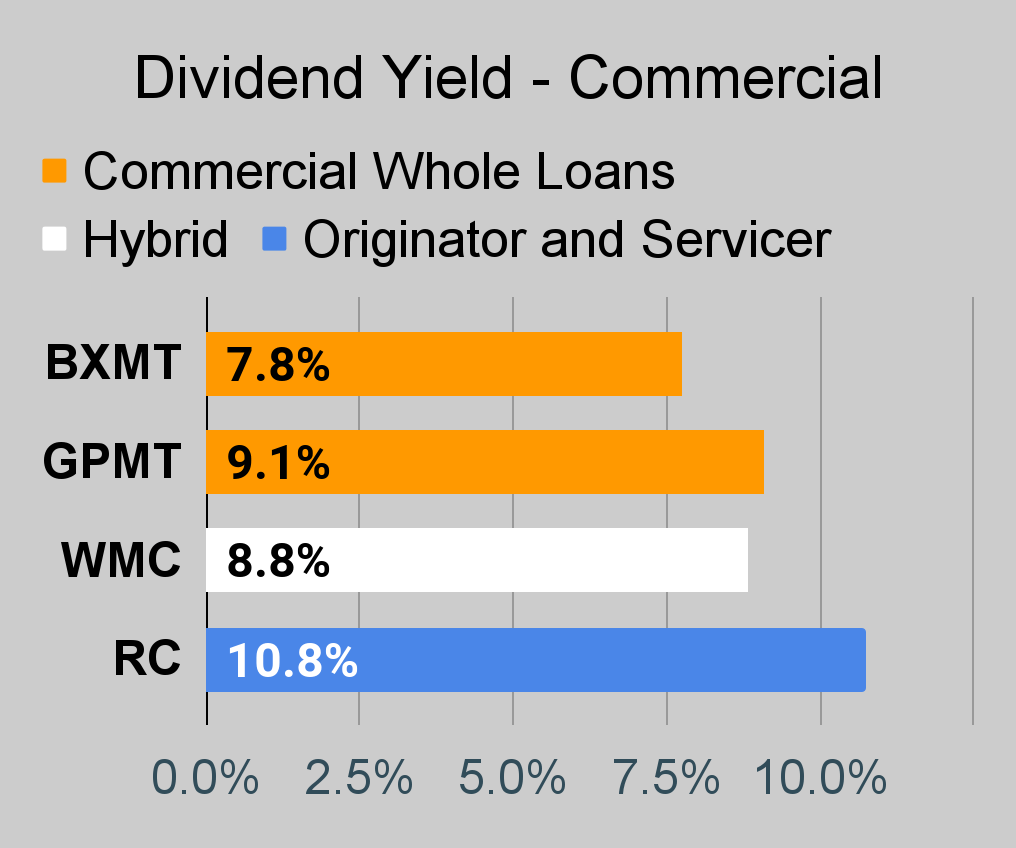
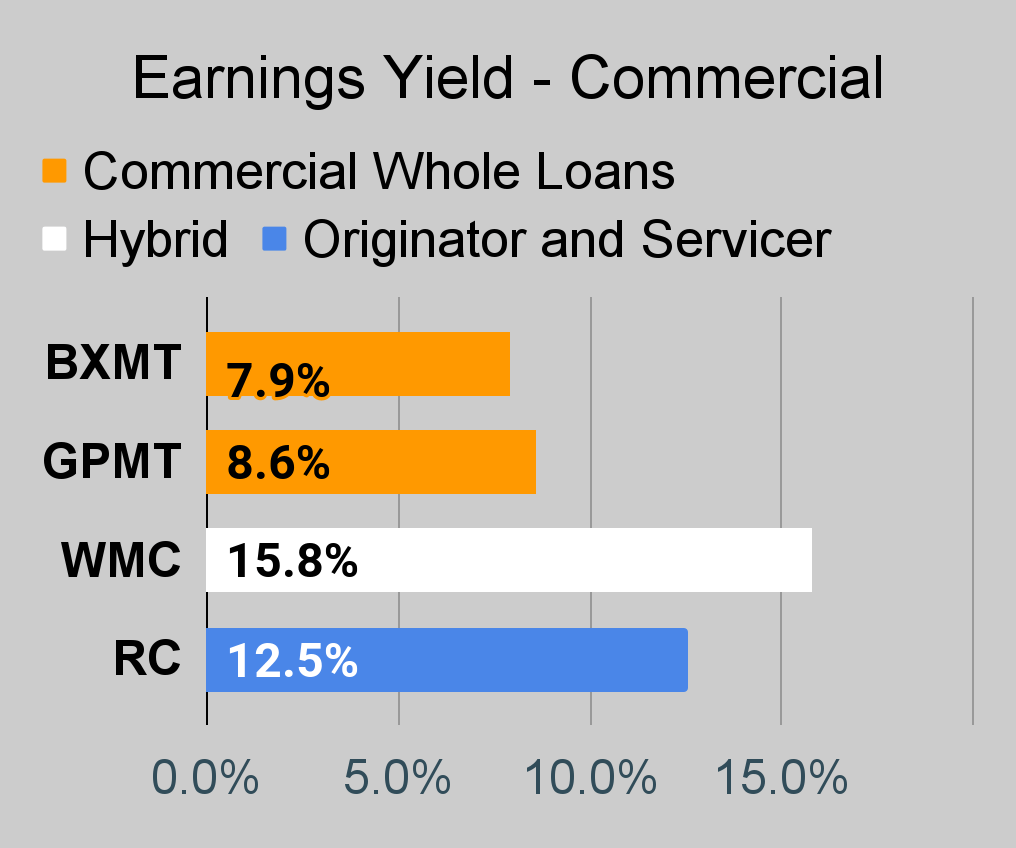
Commercial Mortgage REIT Charts
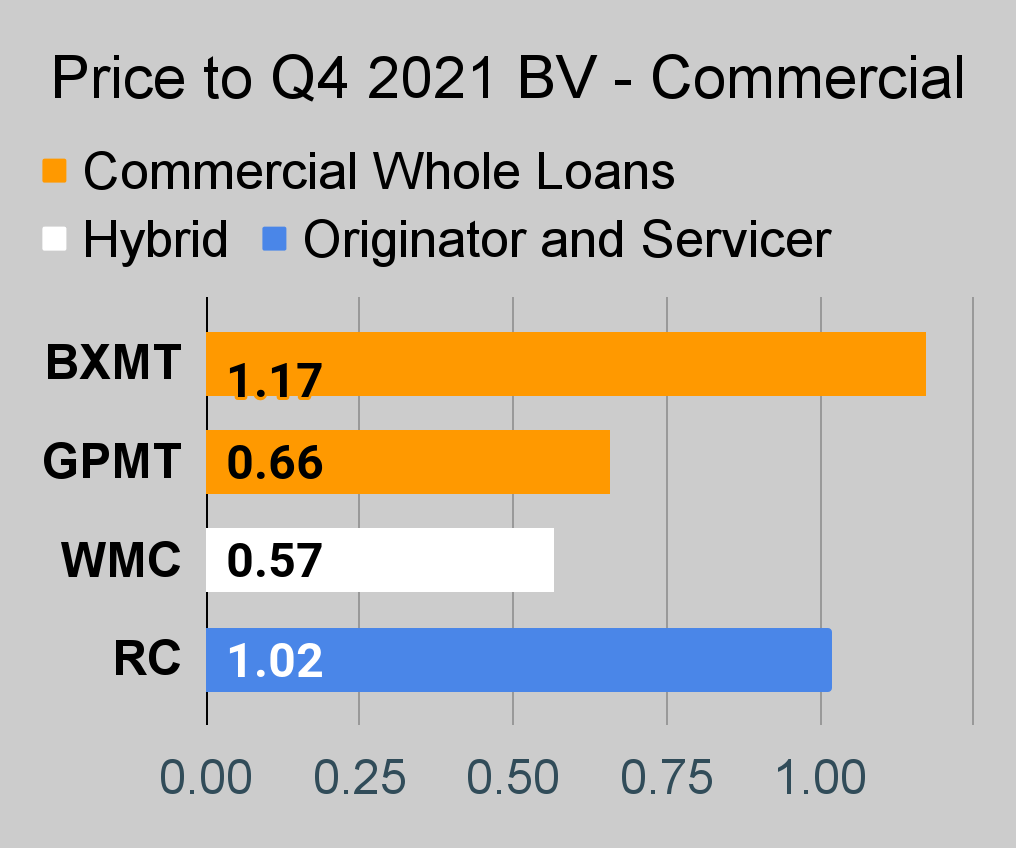 The REIT Forum |
 The REIT Forum |
 The REIT Forum |
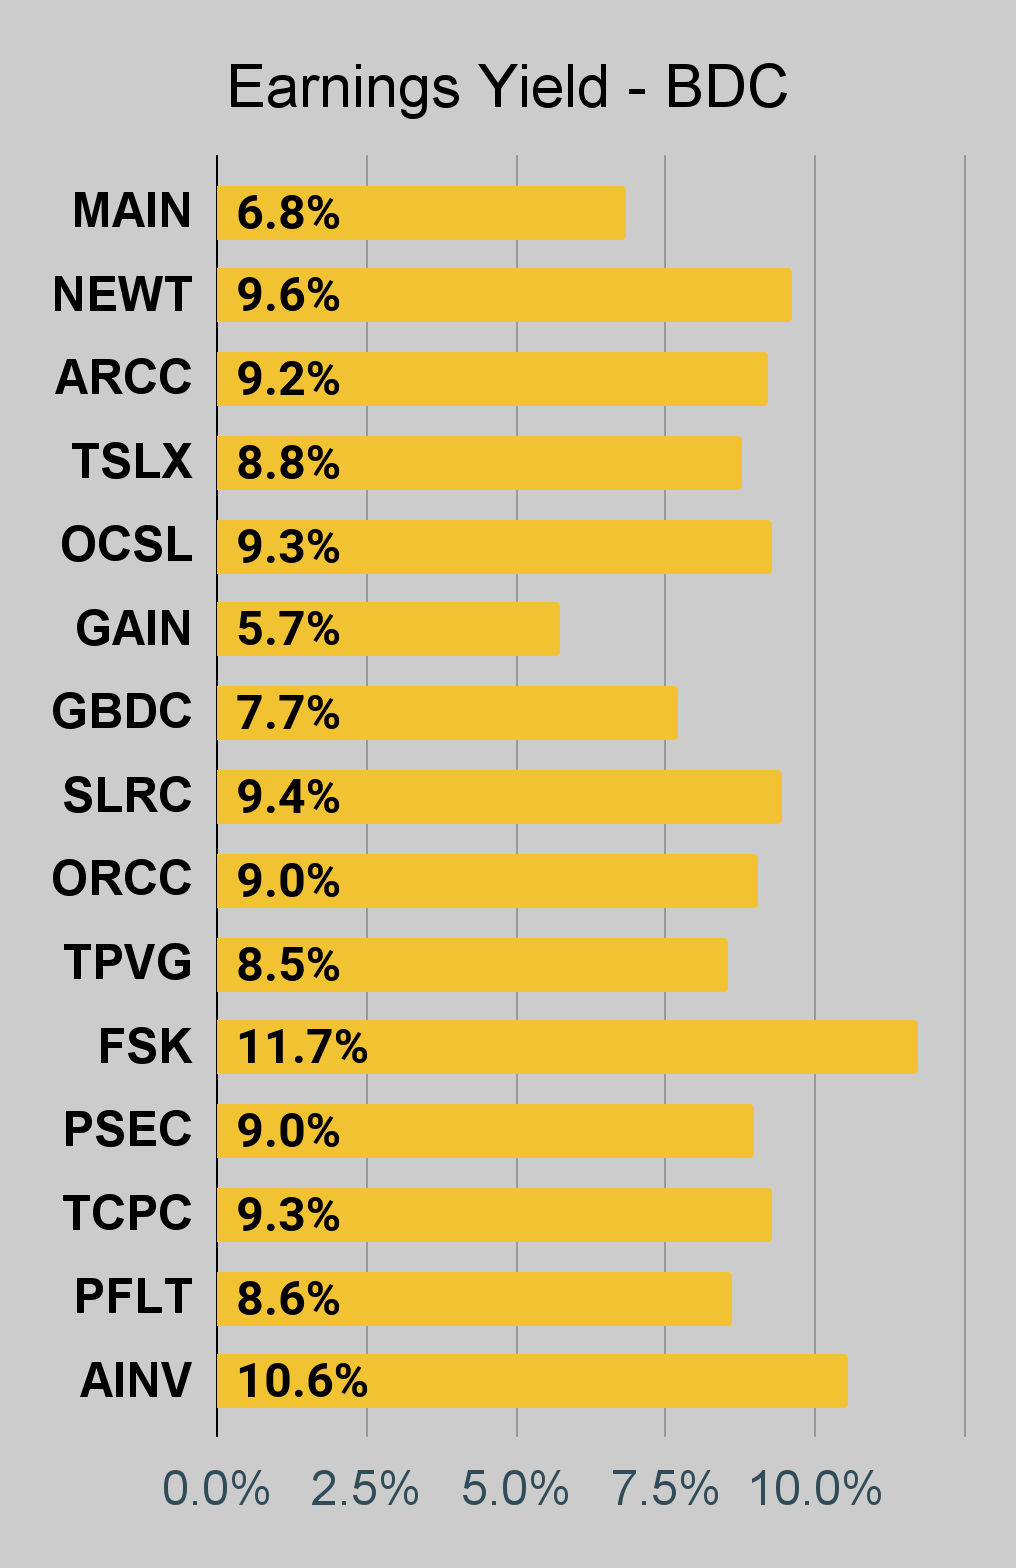
BDC Charts
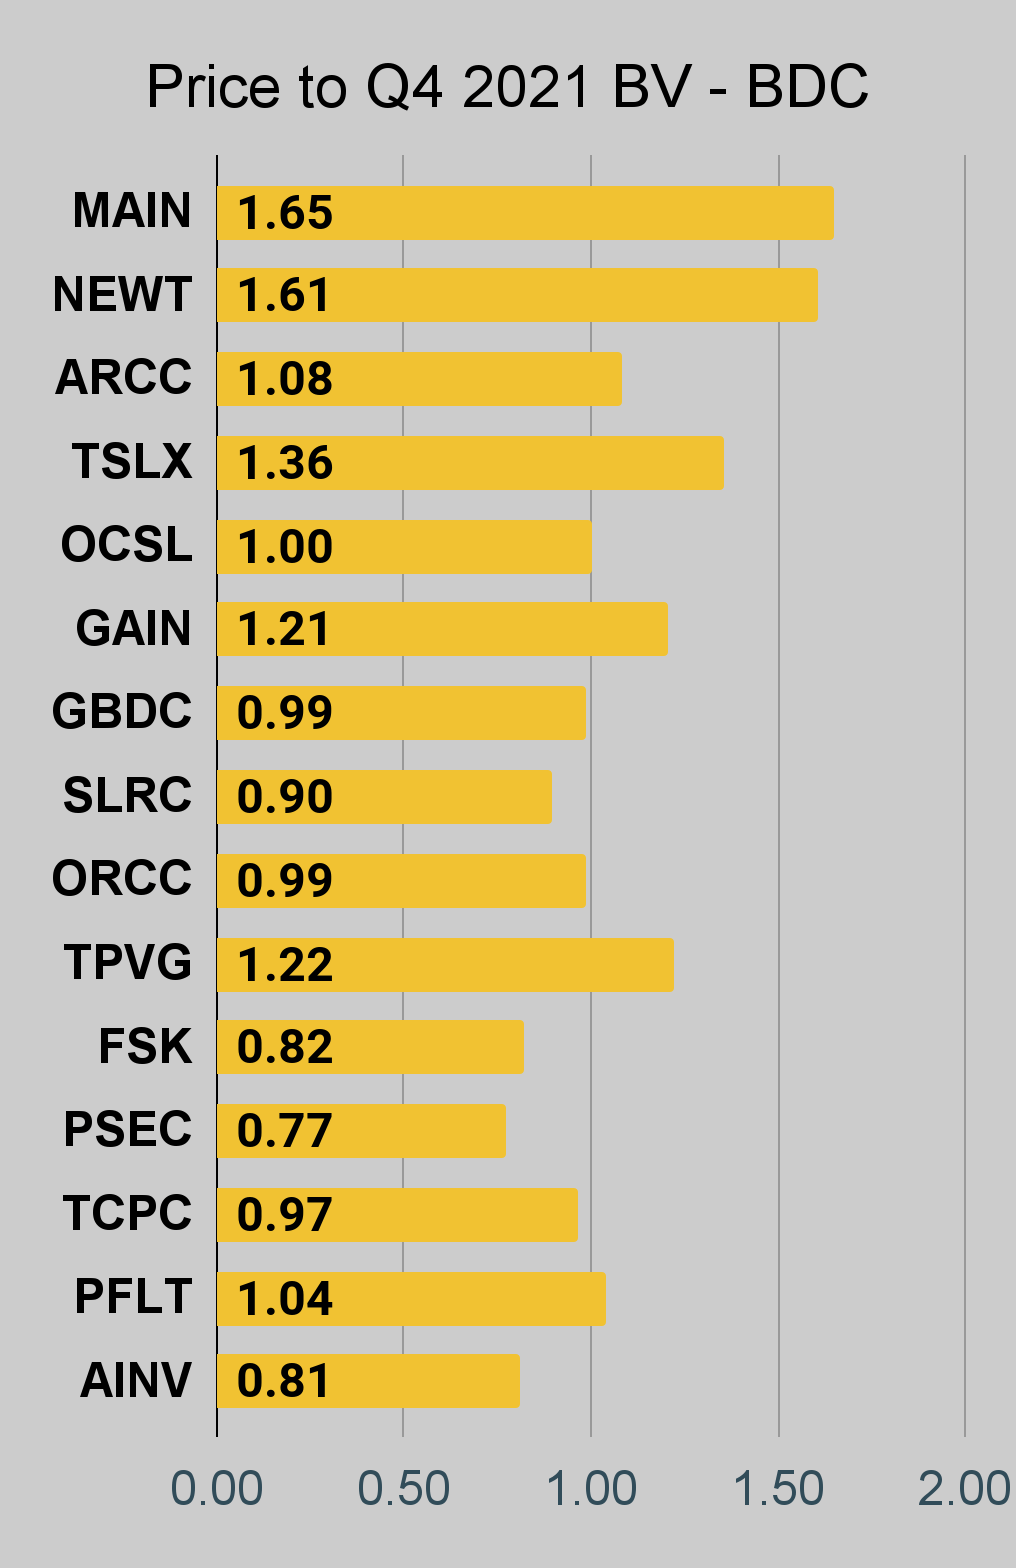 The REIT Forum |
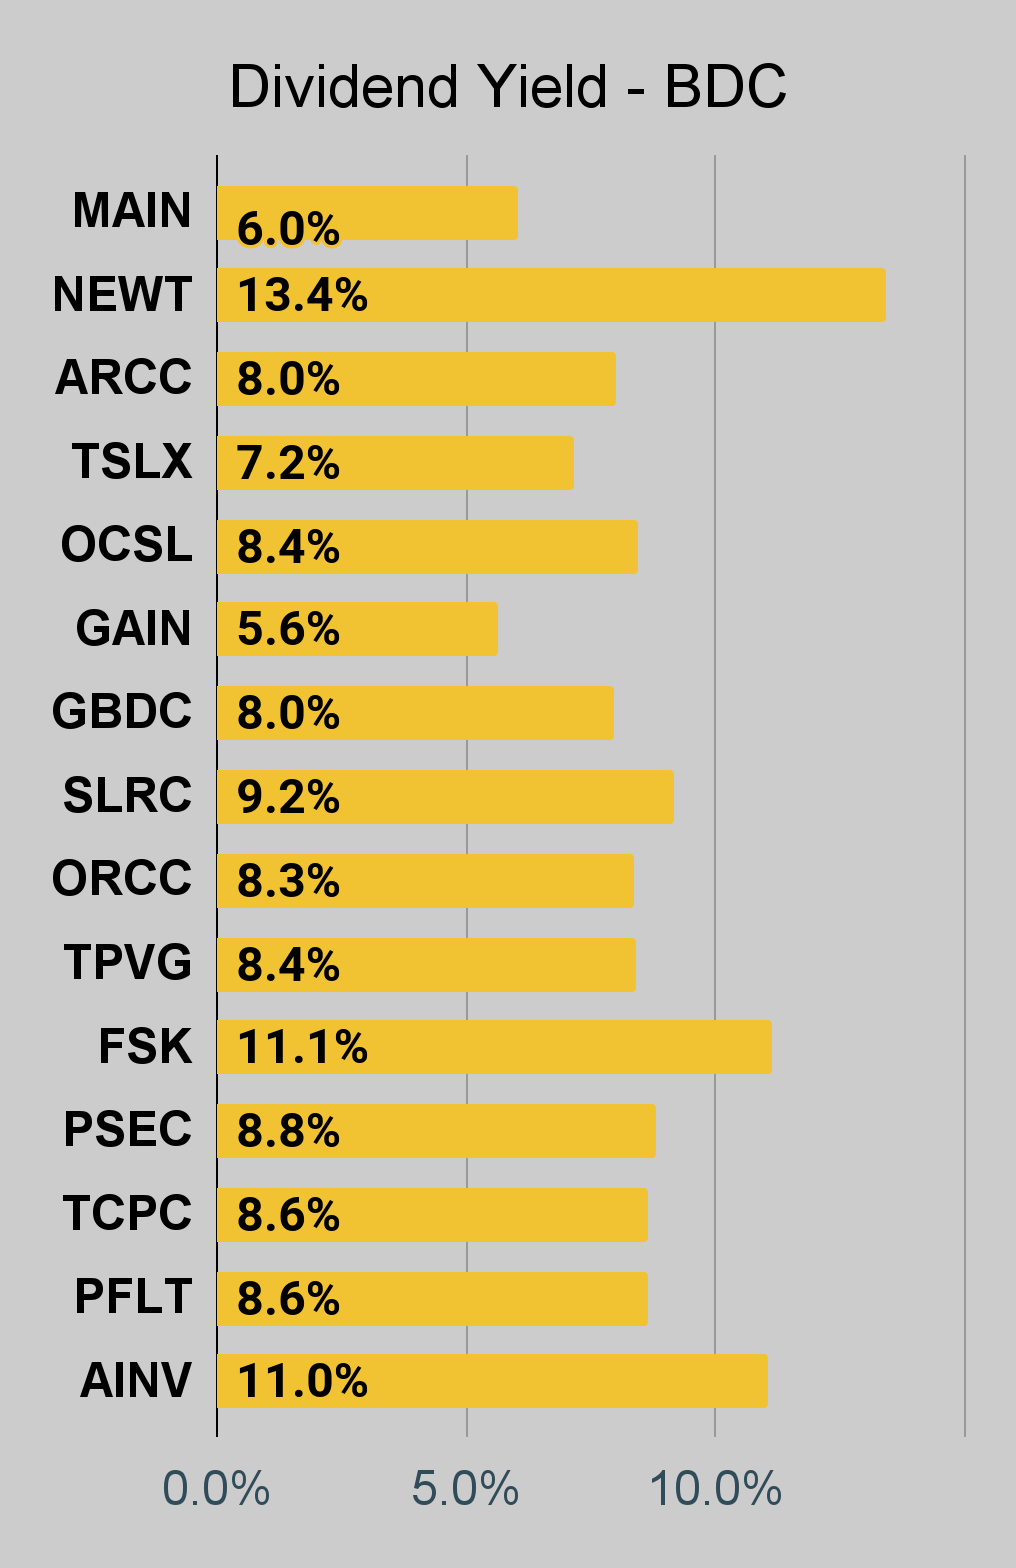 The REIT Forum |
 The REIT Forum |
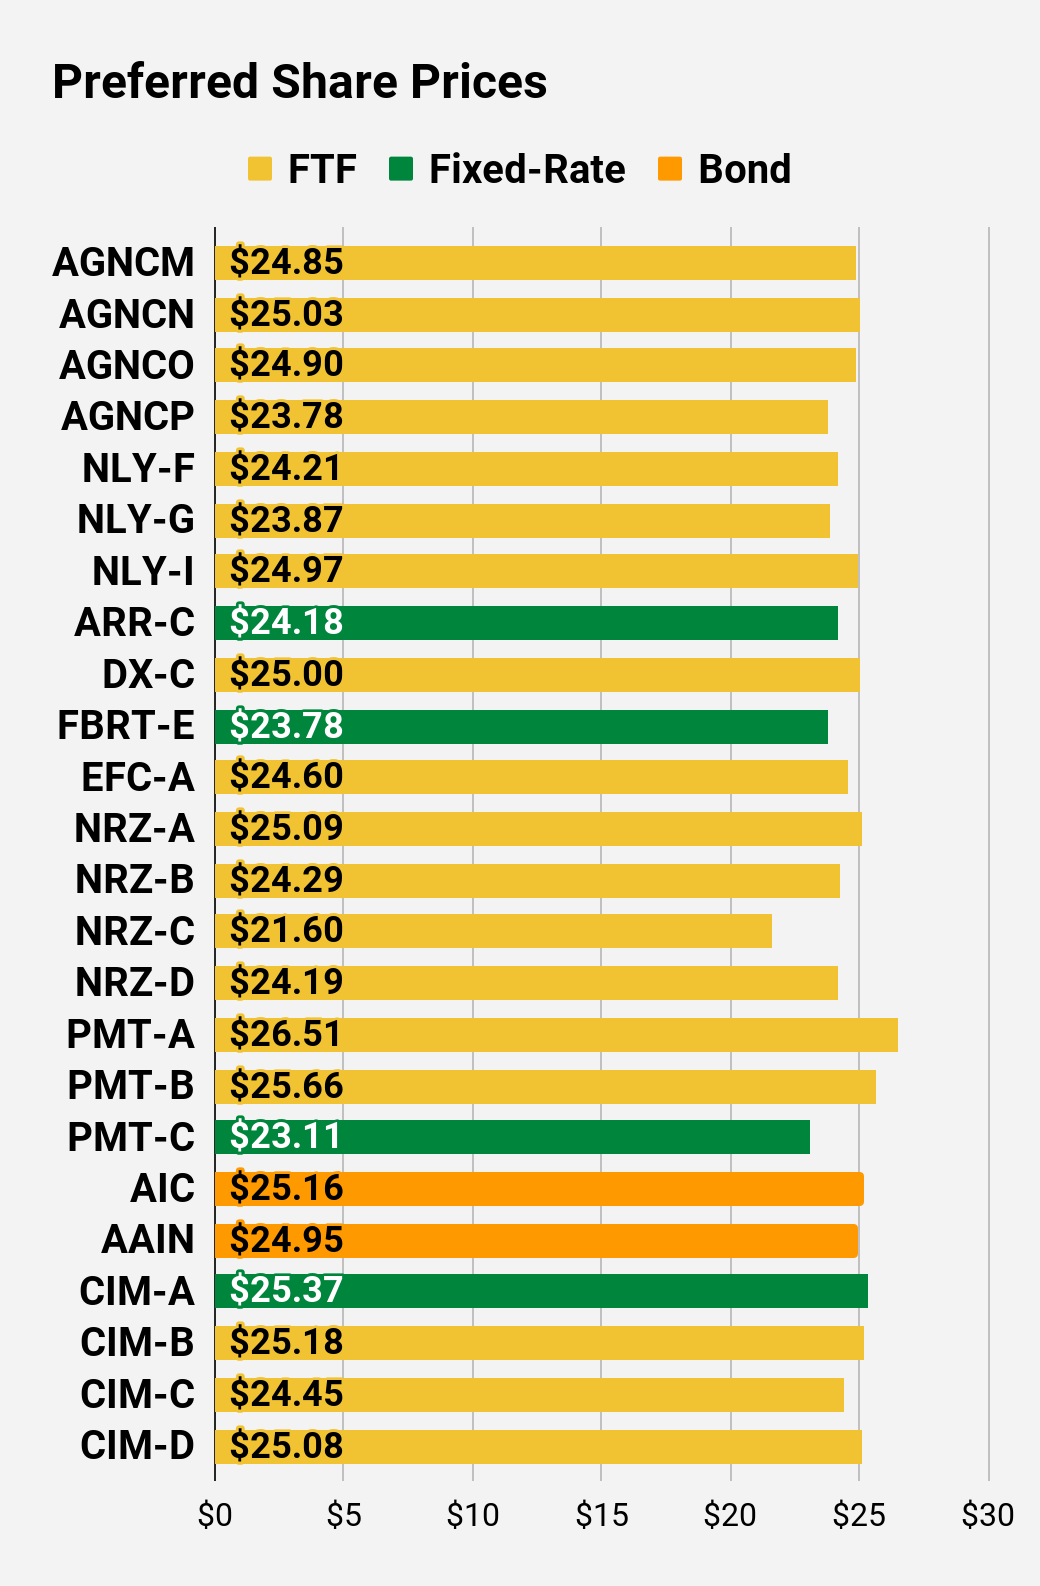
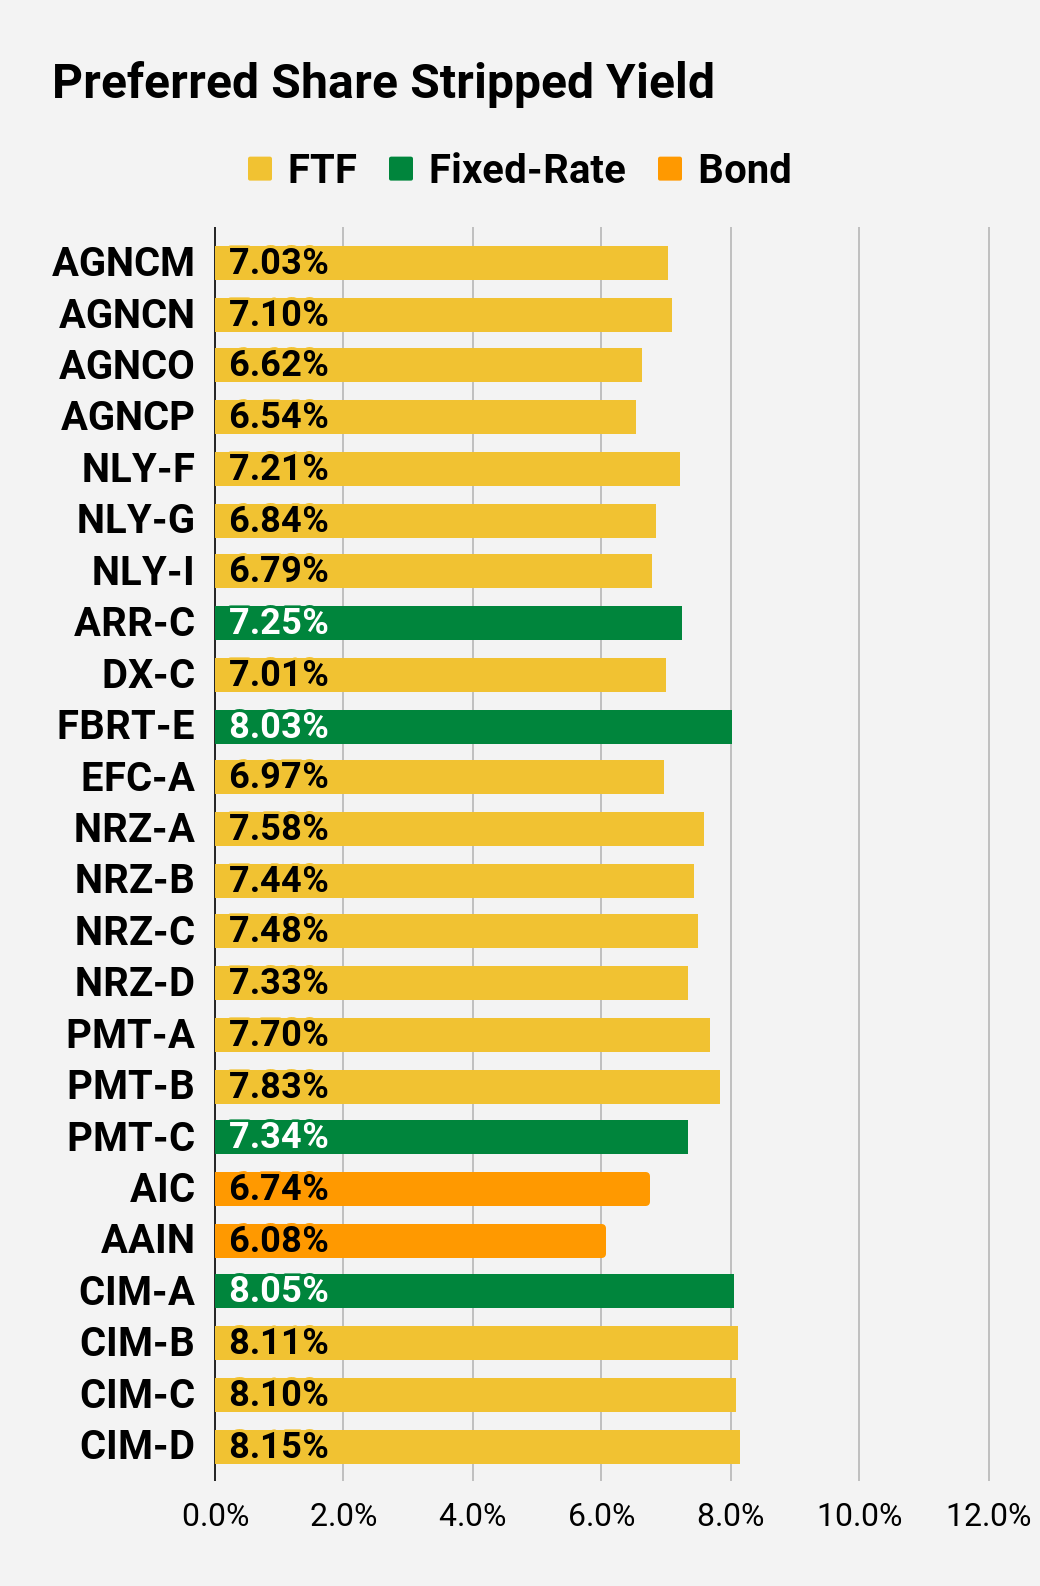
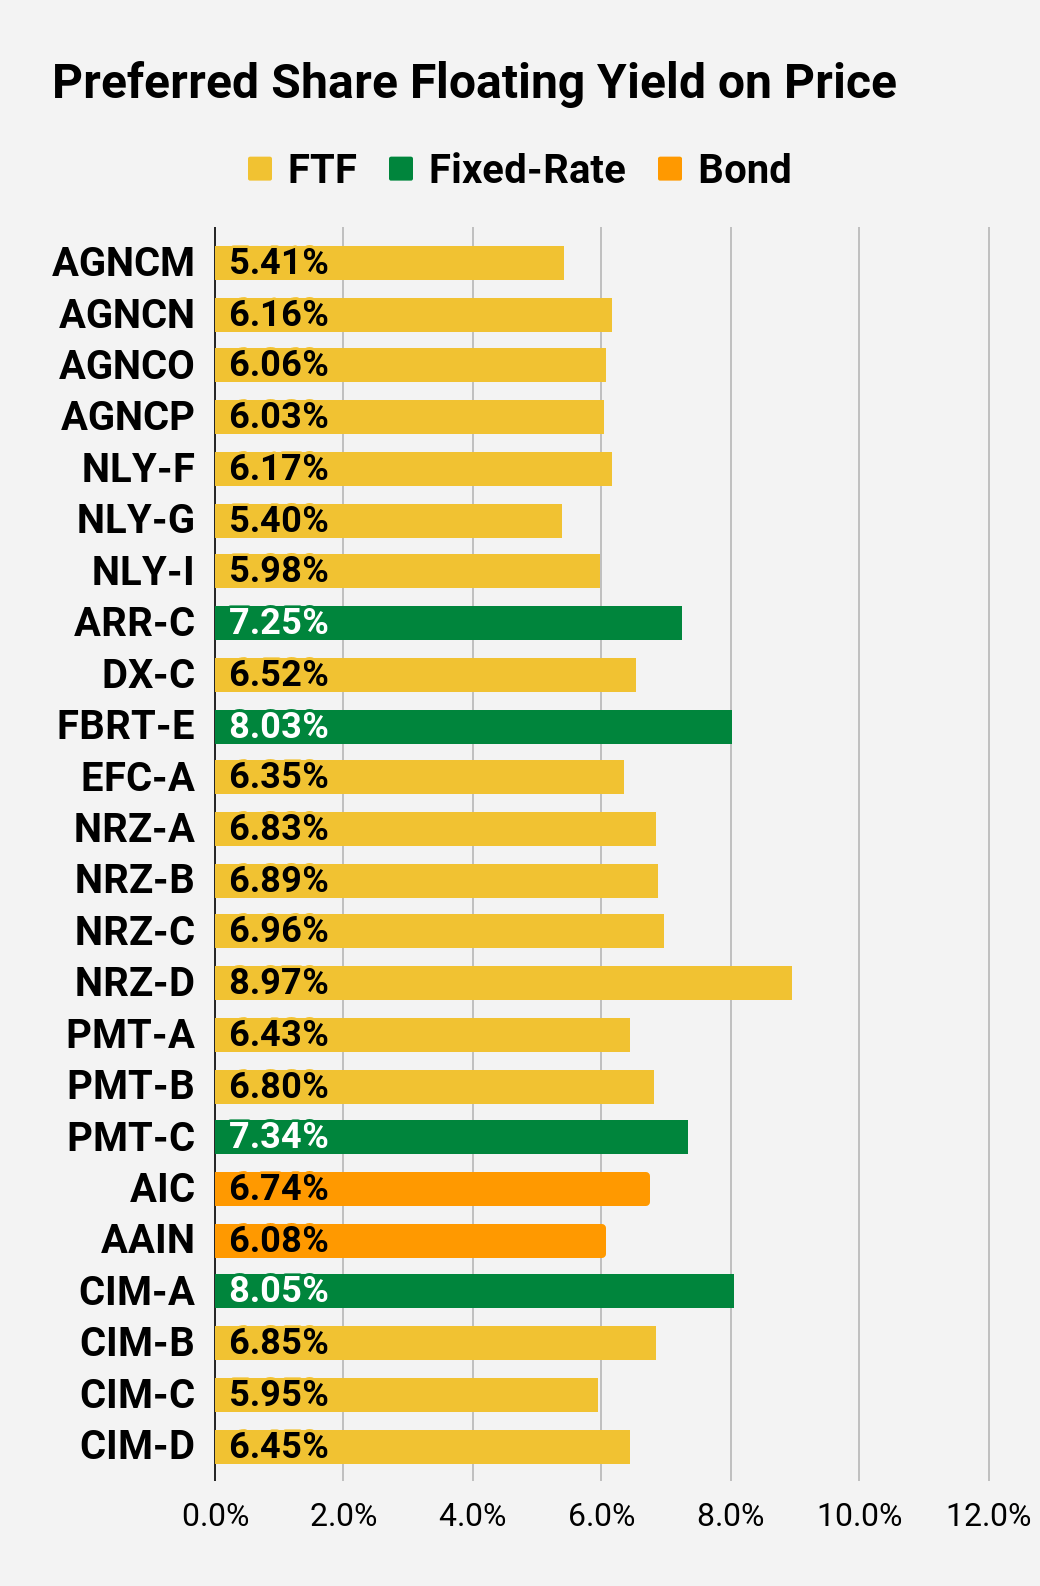
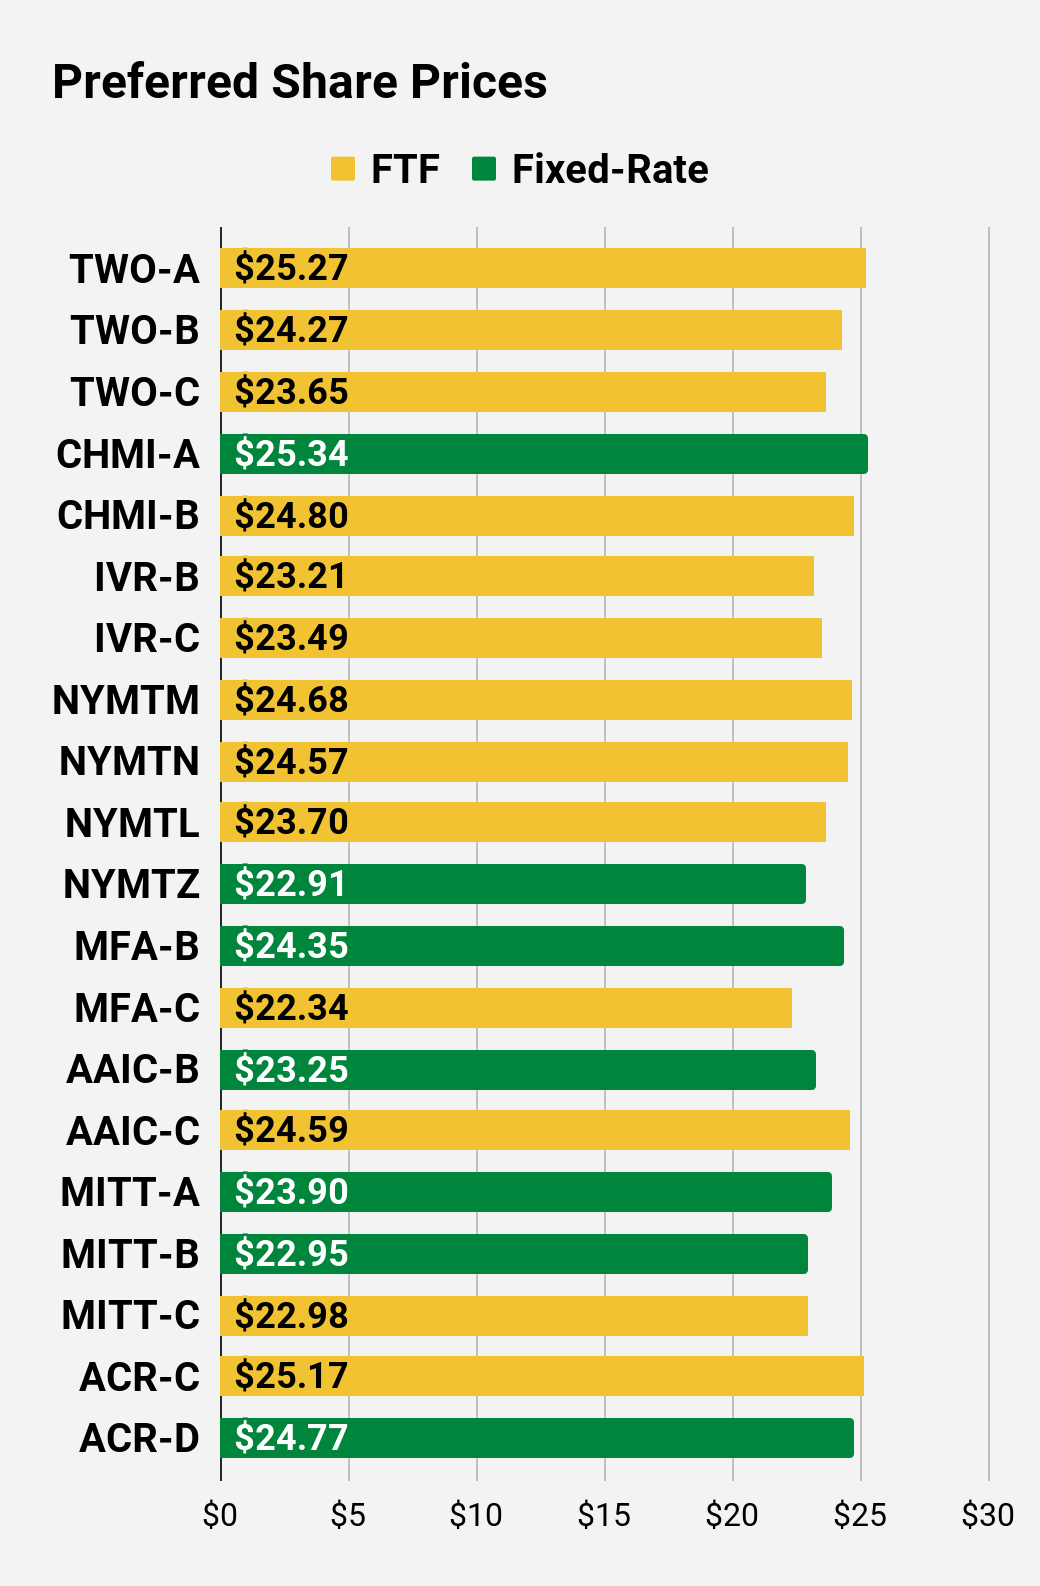
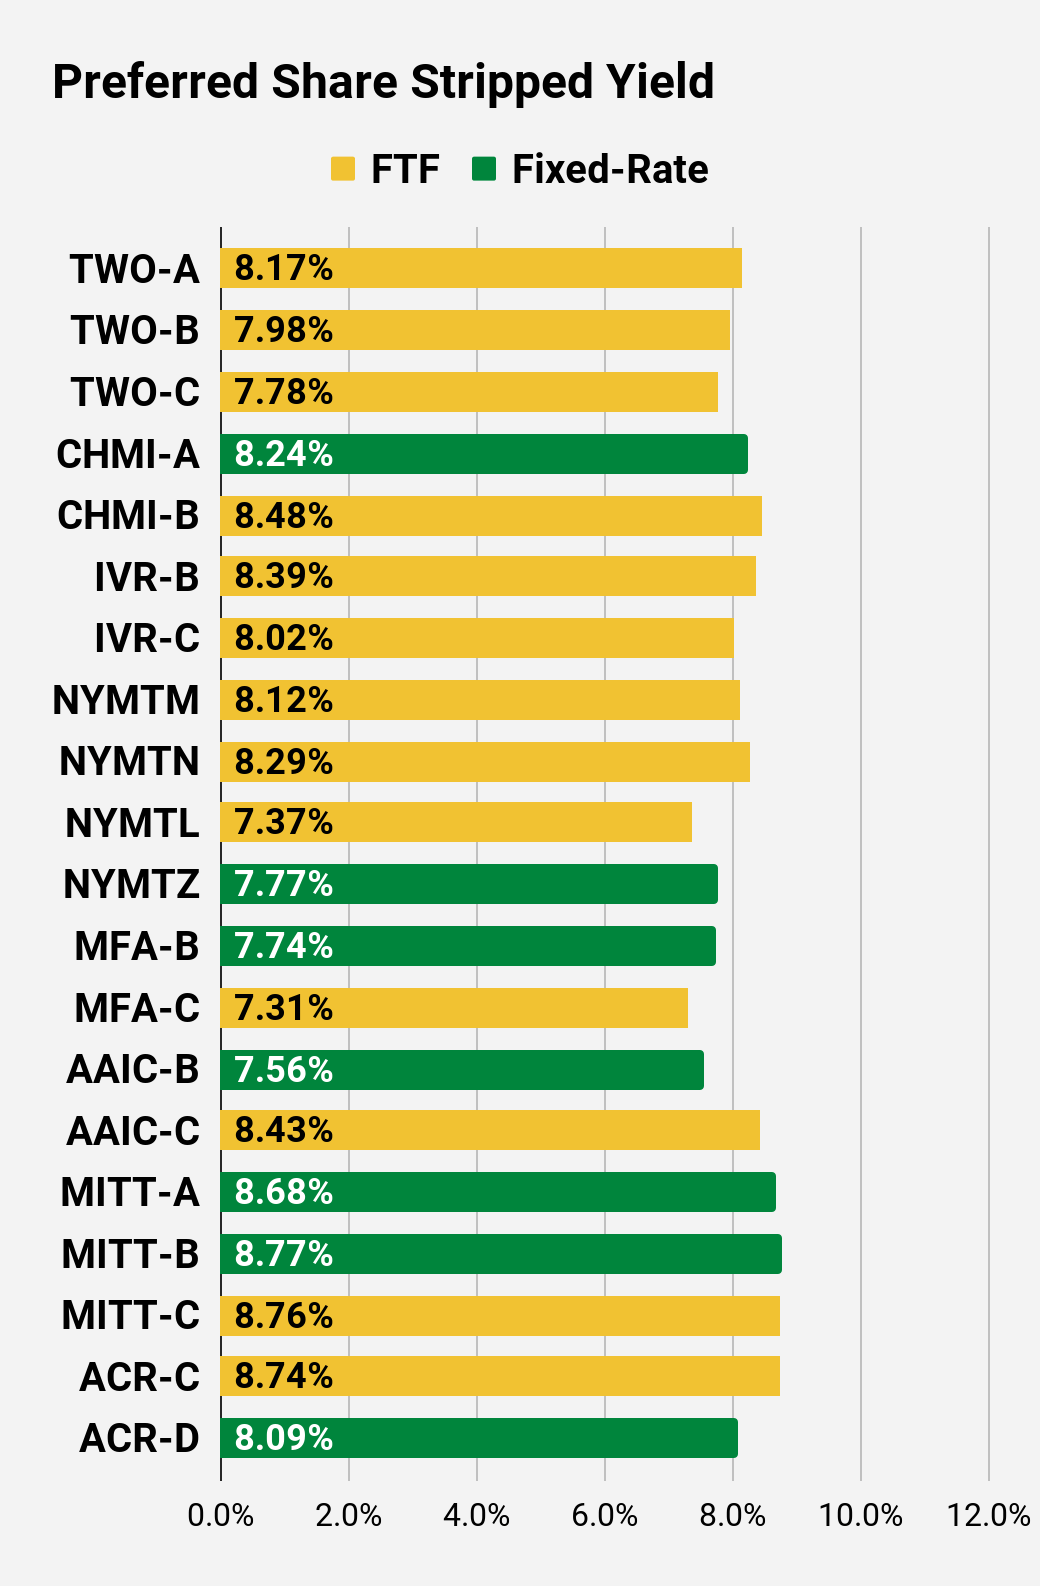
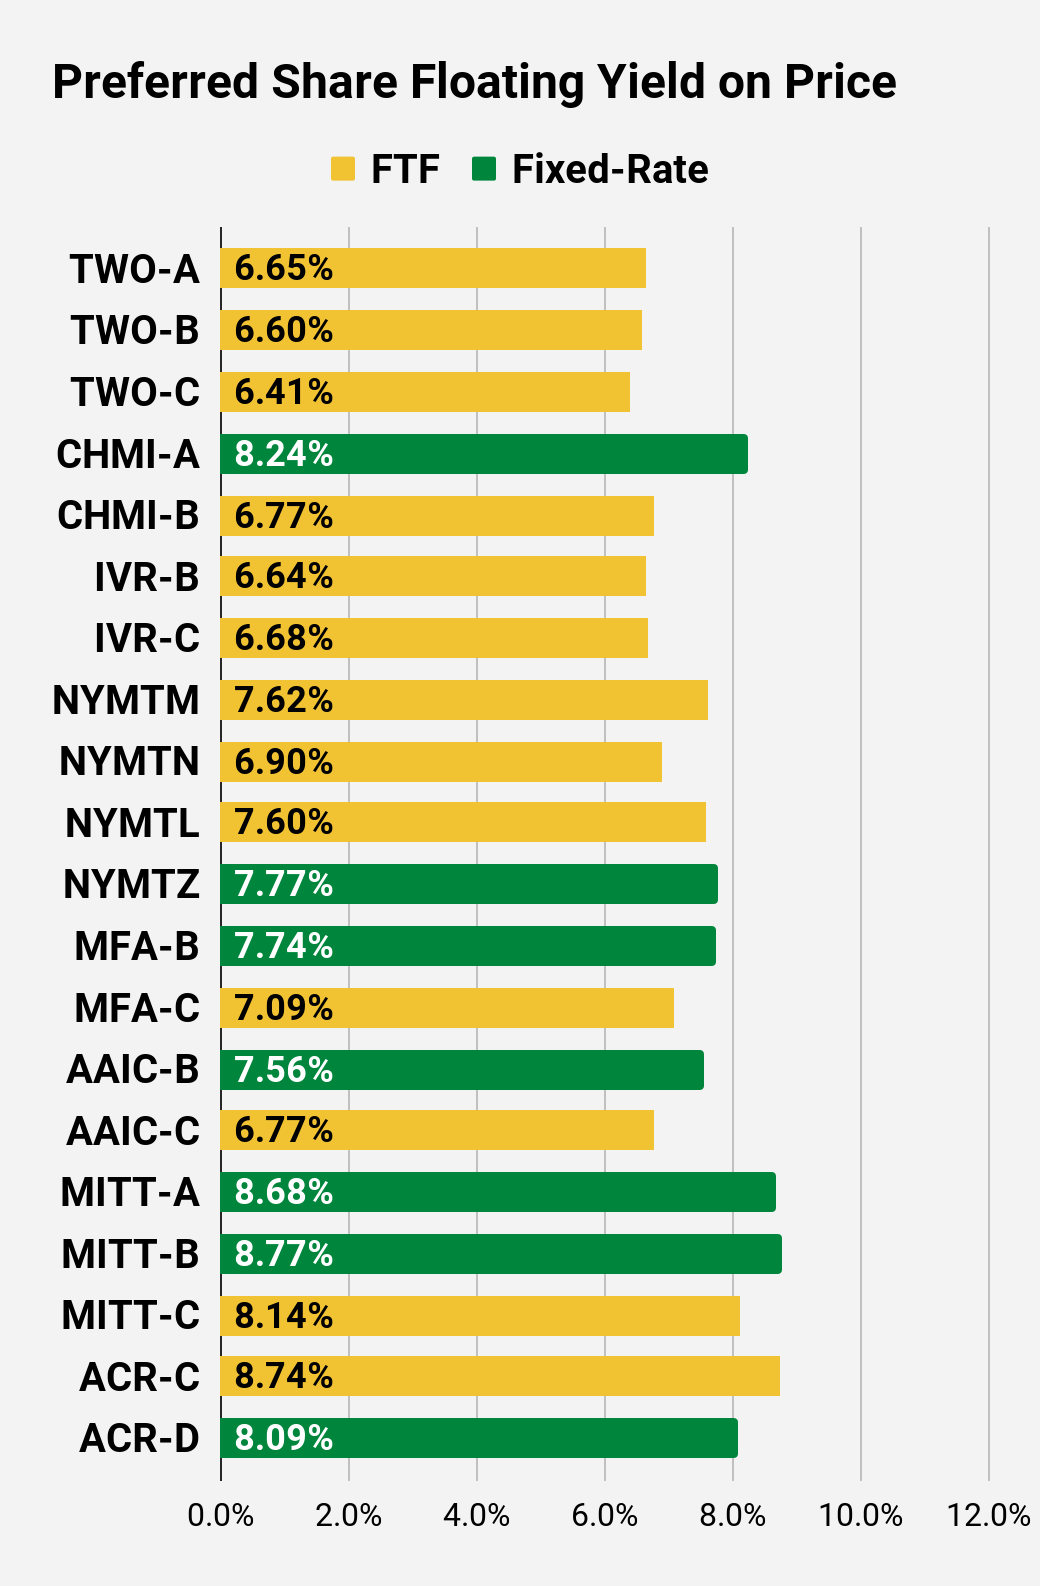
Preferred Share Charts
 The REIT Forum |
 The REIT Forum |
 The REIT Forum |
 The REIT Forum |
 The REIT Forum |
 The REIT Forum |
Preferred Share Data
Beyond the charts, we’re also providing our readers with access to several other metrics for the preferred shares.
After testing out a series on preferred shares, we decided to try merging it into the series on common shares. After all, we are still talking about positions in mortgage REITs. We don’t have any desire to cover preferred shares without cumulative dividends, so any preferred shares you see in our column will have cumulative dividends. You can verify that by using Quantum Online. We’ve included the links in the table below.
To better organize the table, we needed to abbreviate column names as follows:
- Price = Recent Share Price – Shown in Charts
- BoF = Bond or FTF (Fixed-to-Floating)
- S-Yield = Stripped Yield – Shown in Charts
- Coupon = Initial Fixed-Rate Coupon
- FYoP = Floating Yield on Price – Shown in Charts
- NCD = Next Call Date (the soonest shares could be called)
- Note: For all FTF issues, the floating rate would start on NCD.
- WCC = Worst Cash to Call (lowest net cash return possible from a call)
- QO Link = Link to Quantum Online Page
Second Batch:
Strategy
Our goal is to maximize total returns. We achieve those most effectively by including “trading” strategies. We regularly trade positions in the mortgage REIT common shares and BDCs because:
- Prices are inefficient.
- Long-term, share prices generally revolve around book value.
- Short-term, price-to-book ratios can deviate materially.
- Book value isn’t the only step in analysis, but it is the cornerstone.
We also allocate to preferred shares and equity REITs. We encourage buy-and-hold investors to consider using more preferred shares and equity REITs.
Performance
We compare our performance against 4 ETFs that investors might use for exposure to our sectors:
The REIT Forum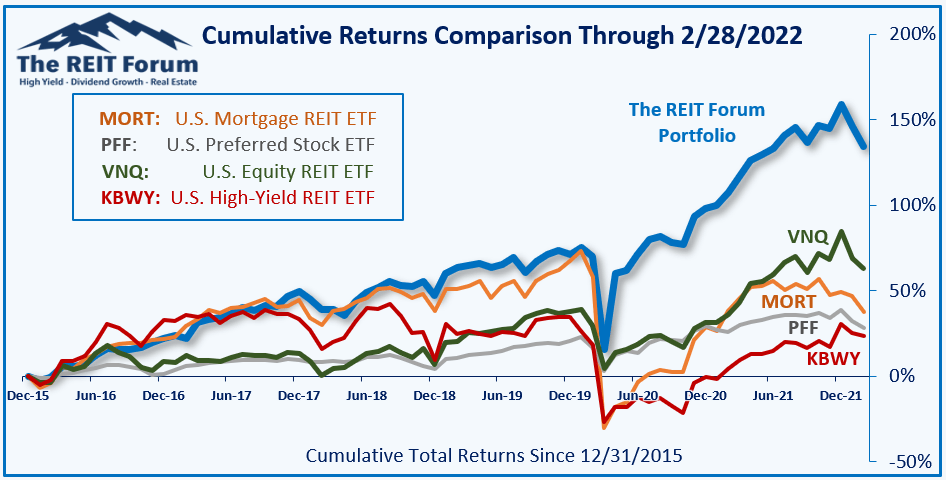
The 4 ETFs we use for comparison are:
|
Ticker |
Exposure |
|
One of the largest mortgage REIT ETFs |
|
|
One of the largest preferred share ETFs |
|
|
Largest equity REIT ETF |
|
|
The high-yield equity REIT ETF. Yes, it has been dreadful. |
When investors think it isn’t possible to earn solid returns in preferred shares or mortgage REITs, we politely disagree. The sector has plenty of opportunities, but investors still need to be wary of the risks. We can’t simply reach for yield and hope for the best. When it comes to common shares, we need to be even more vigilant to protect our principal by regularly watching prices and updating estimates for book value and price targets.
Ratings:
- Bullish on preferred shares NRZ-C, NRZ-D, and MFA-C
Be the first to comment