


The dividend yield on these stable shares should help Seeking Alpha readers find peaceful income.
Pogonici/iStock via Getty Images
Get ready for charts, images, and tables because they are better than words. The ratings and outlooks we highlight here come after Scott Kennedy’s weekly updates in the REIT Forum. Your continued feedback is greatly appreciated, so please leave a comment with suggestions.
The last few weeks have been so wild that I’ve been a bit behind on publishing content for all our followers on the public side. To speed it up, I’m going to include a few more shares than usual. This article comes from a recent Preferred Share Update on The REIT Forum.
Be advised that share prices are constantly changing, so it’s good to check the latest prices before placing a trade or following a rating. I strive to include share prices directly in my commentary, so you’ll know what the price was when I made the statement.
This is particularly important as there can be a delay between writing and publishing as sometimes things simply come up. It is also relevant to check ex-dividend dates.
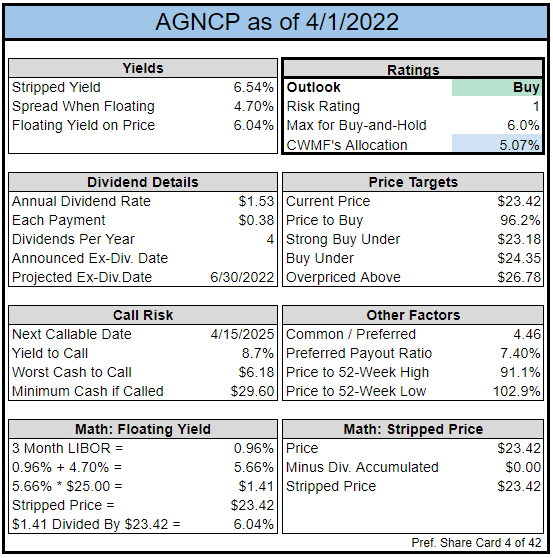
NLY-G vs AGNCP vs All Other Risk Rating 1 Preferred Shares
Previously, I highlighted two shares in the risk rating 1 category:
AGNCP (AGNCP) and NLY-G (NLY.PG)
I said AGNCP was the most attractive for fundamentals while NLY-G was the best for technical factors and could be played for a quick bounce. The bounce for NLY-G occurred as predicted. As of Friday afternoon, among the risk rating 1 preferred shares, AGNCP is the most attractive based on fundamentals AND based on technical factors. Anyone allocating to the AGNC or NLY preferred shares would be wise to pick AGNCP at $23.47.
Note: These comments were prepared prior to the ex-dividend date. Since AGNCP’s quarterly dividend is about $.38, the price of $23.47 is comparable to $23.11 today.
The REIT Forum
AGNCP is one of our largest high-yield positions with an allocation over 5%.
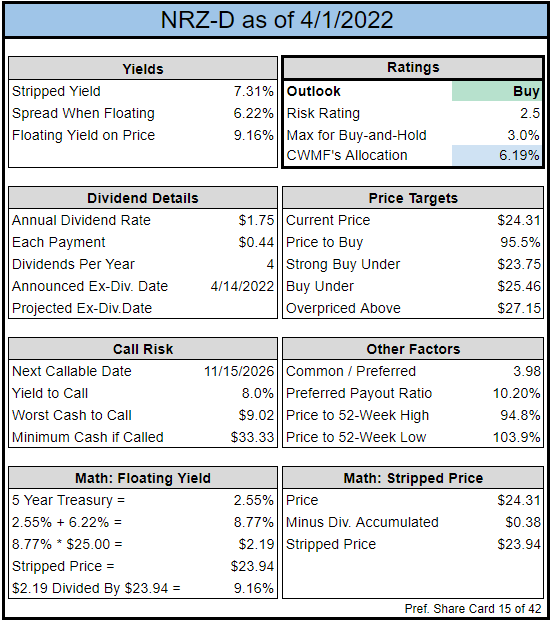
NRZ Preferred Shares
Our view is the same today as it was in the update from Wednesday (3/23/2022). No major swings in relative prices to change our top picks here. NRZ-D (NRZ.PD) at $24.22 remains attractive as it has regularly been.
Using the following prices:
We have NRZ-C as a clear winner. As always, prices will change over time. The reason prices are stated so explicitly in this article is to account for the fact that prices change. If NRZ-C was $22.53 instead of $21.53, it would get a materially weaker endorsement. Picking the best share at any given point depends on the share prices.
Note: We discussed NRZ-C and NRZ-D more in yesterday’s public preferred share article. The NRZ preferred shares are expected to go ex-dividend on 4/14/2022.
The REIT Forum
NRZ-D is another one of our largest high-yield positions at more than 6% of our portfolio.
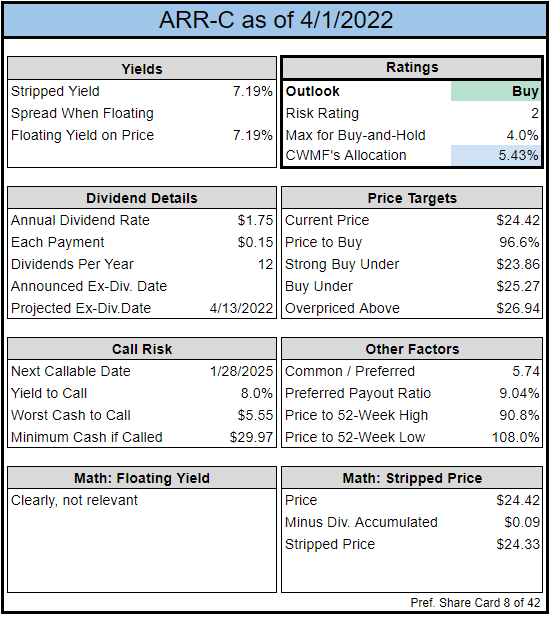
PMT-A vs PMT-B vs PMT-C vs ARR-C
Still favoring PMT-C (PMT.PC) here. PMT-B (PMT.PB) is OK and may actually offer a materially higher yield than PMT-C after PMT-B’s call protection ends. The problem is that the call risk remains elevated with PMT-B trading at $25.61. PMT-A (PMT.PA) at $26.38 remains laughably overpriced.
The reason some investors may pass on PMT-C is the fixed dividend rate. Compared to ARR-C (ARR.PC), PMT-C offers investors a bit more yield and far more upside to call value.
Note: None of these 4 shares has gone ex-dividend since our commentary was prepared. The closest is ARR-C, which pays monthly and should go ex-dividend roughly around the middle of April.
The REIT Forum
With an allocation greater than 5%, ARR-C also lands as a spot as one of our largest positions.
Conclusion
- AGNCP wins out over other shares with a risk rating of 1 (from AGNC and NLY).
- NRZ-C and NRZ-D beat NRZ-B and NRZ-A.
- PMT-C and ARR-C offer fixed-rate shares with pretty good yields and relatively low-risk ratings. PMT-B is okay, but not great (at current valuation). PMT-A is horribly overvalued.
Note: Before sending this article public I reviewed my commentary from earlier this week to verify that all parts are still relevant. Each of the relevant rankings remains accurate. I removed some sections because they already played out. The volatility has been wild with prices sometimes adjusting within a day or two. That’s very unusual for this sector, where we often see very stable prices for the preferred shares.
The rest of the charts in this article may be self-explanatory to some investors. However, if you’d like to know more about them, you’re encouraged to see our notes for the series.
Stock Table
We will close out the rest of the article with the tables and charts we provide for readers to help them track the sector for both common shares and preferred shares.
We’re including a quick table for the common shares that will be shown in our tables:
Let the images begin!
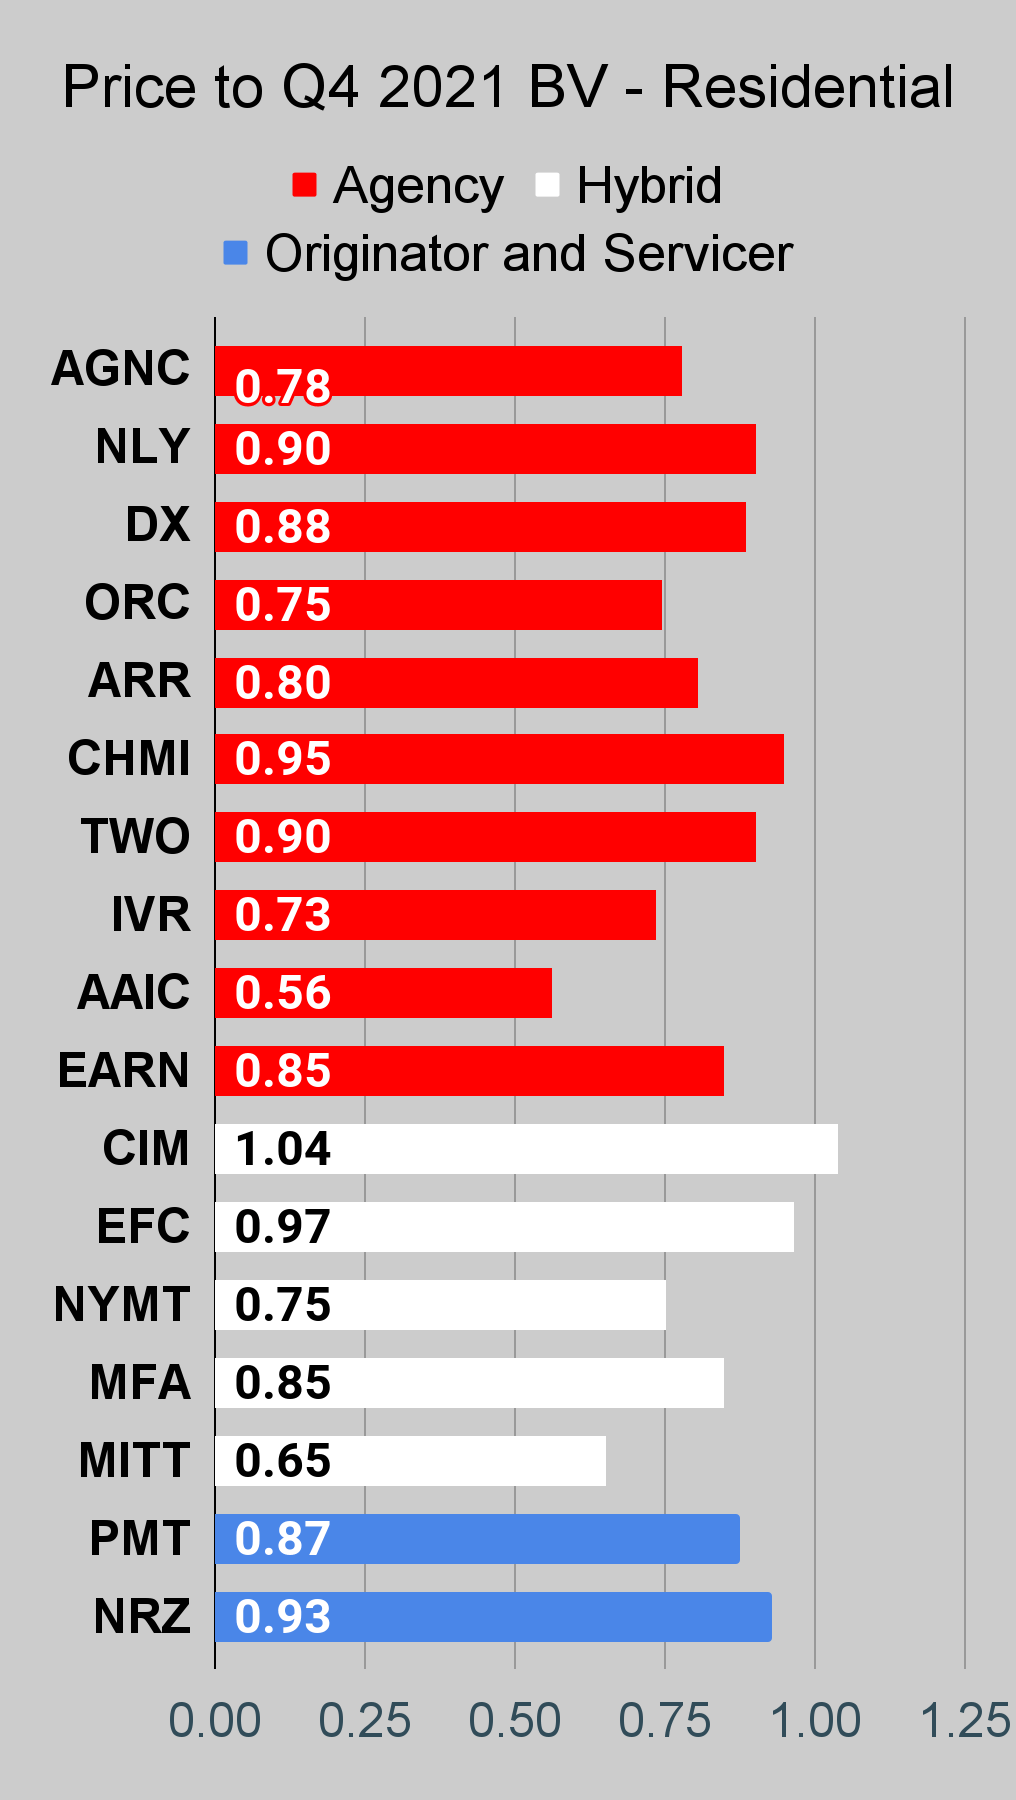
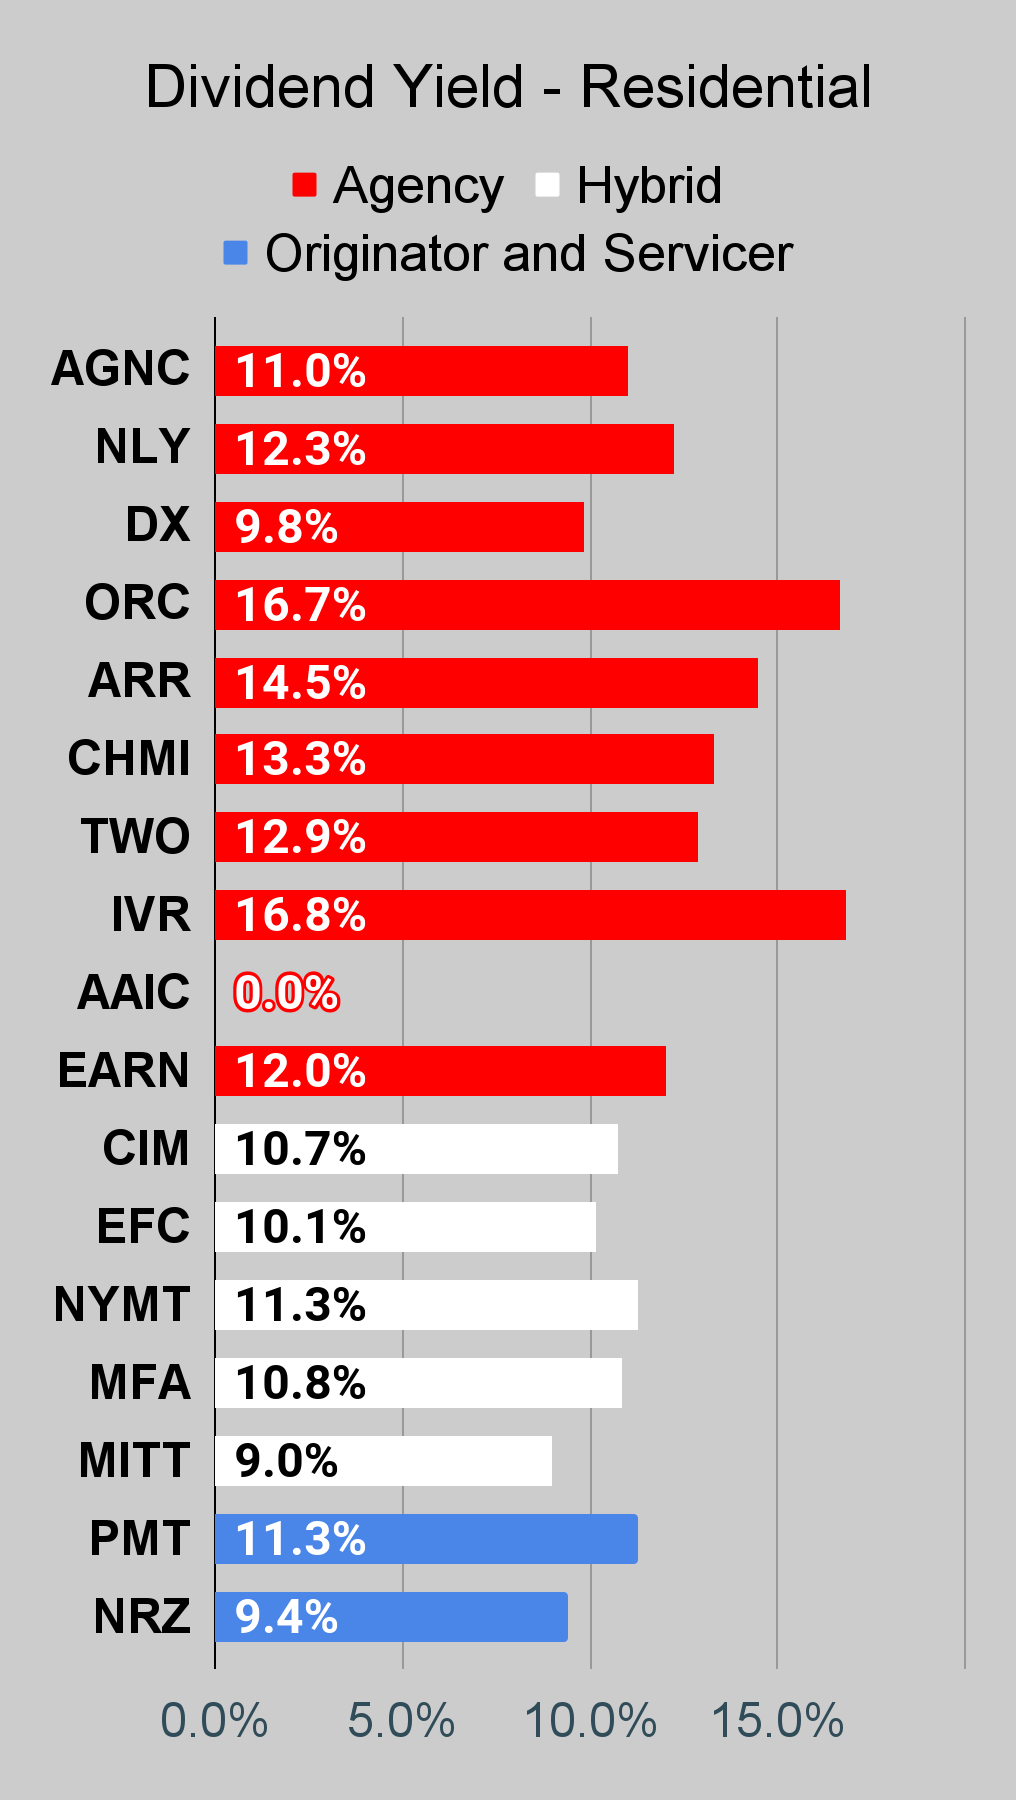
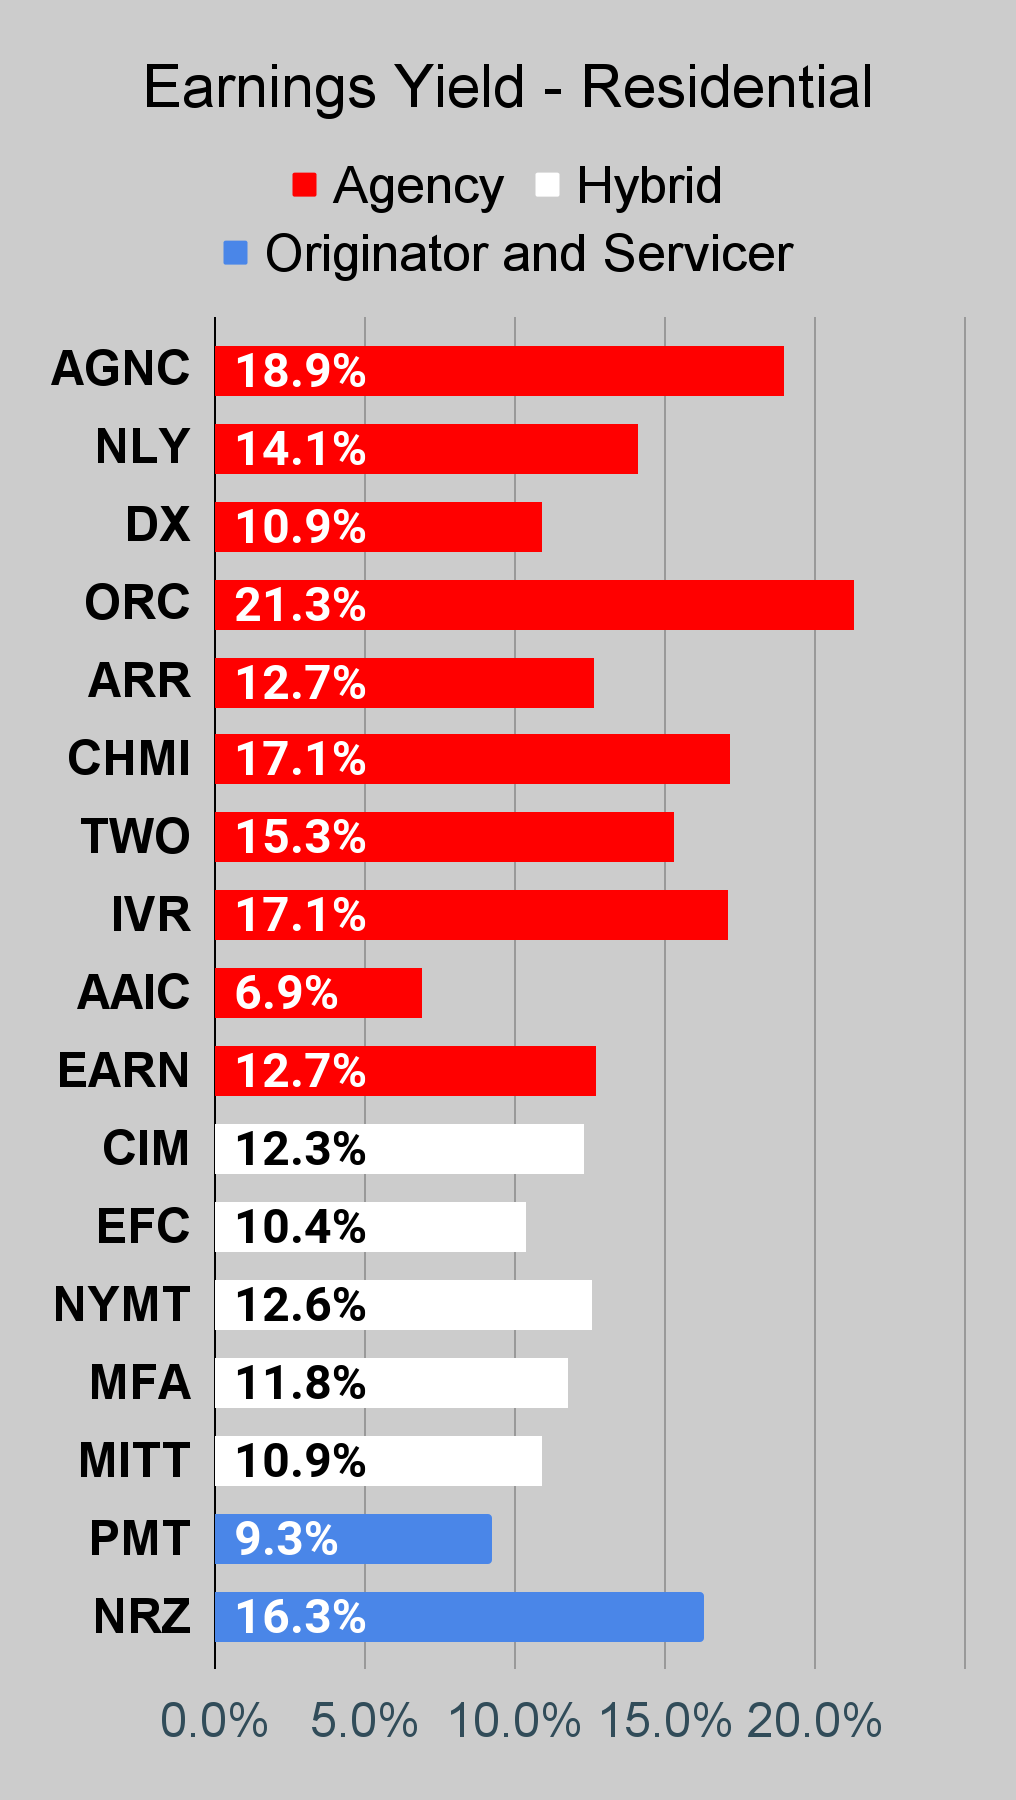
Residential Mortgage REIT Charts
Note: We are modeling some significant changes to BV since 12/31/2021 and some management teams have already publicly indicated a material change in BV per share. The chart for our public articles uses the book value per share from the latest earnings release. Current estimated book value per share is used in reaching our targets and trading decisions. It’s available in our service, but those estimates are not included in the charts below.
 The REIT Forum |
 The REIT Forum |
 The REIT Forum |
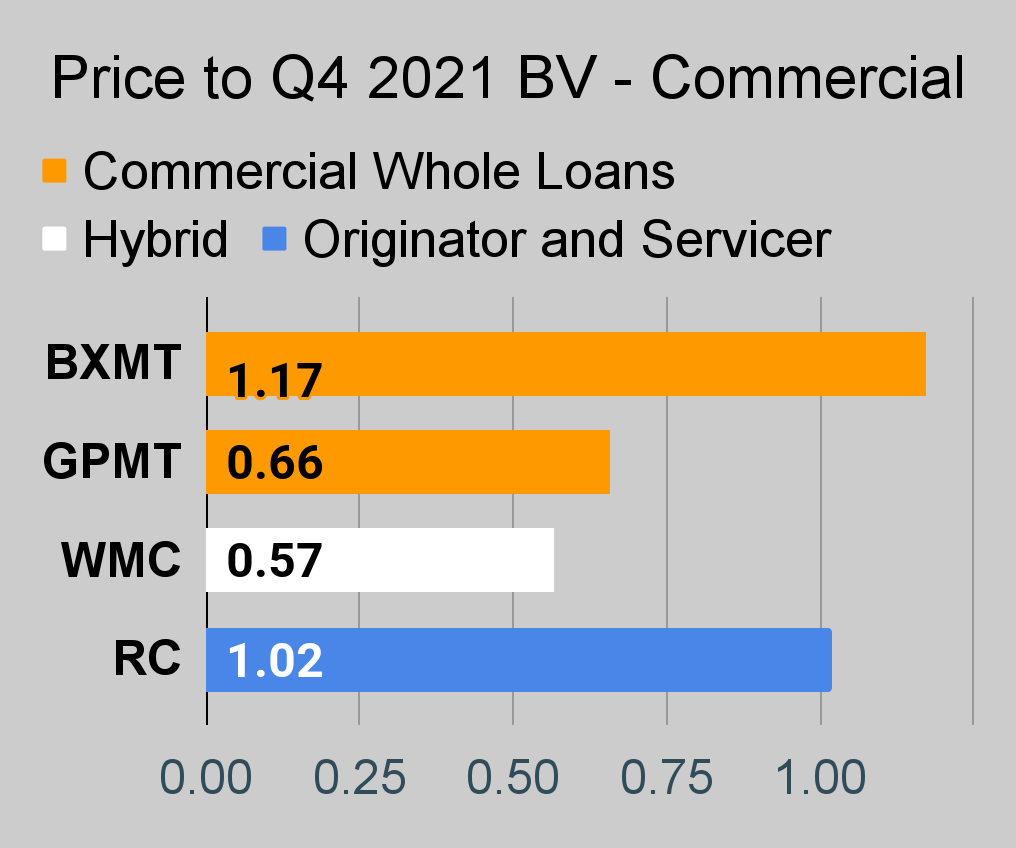
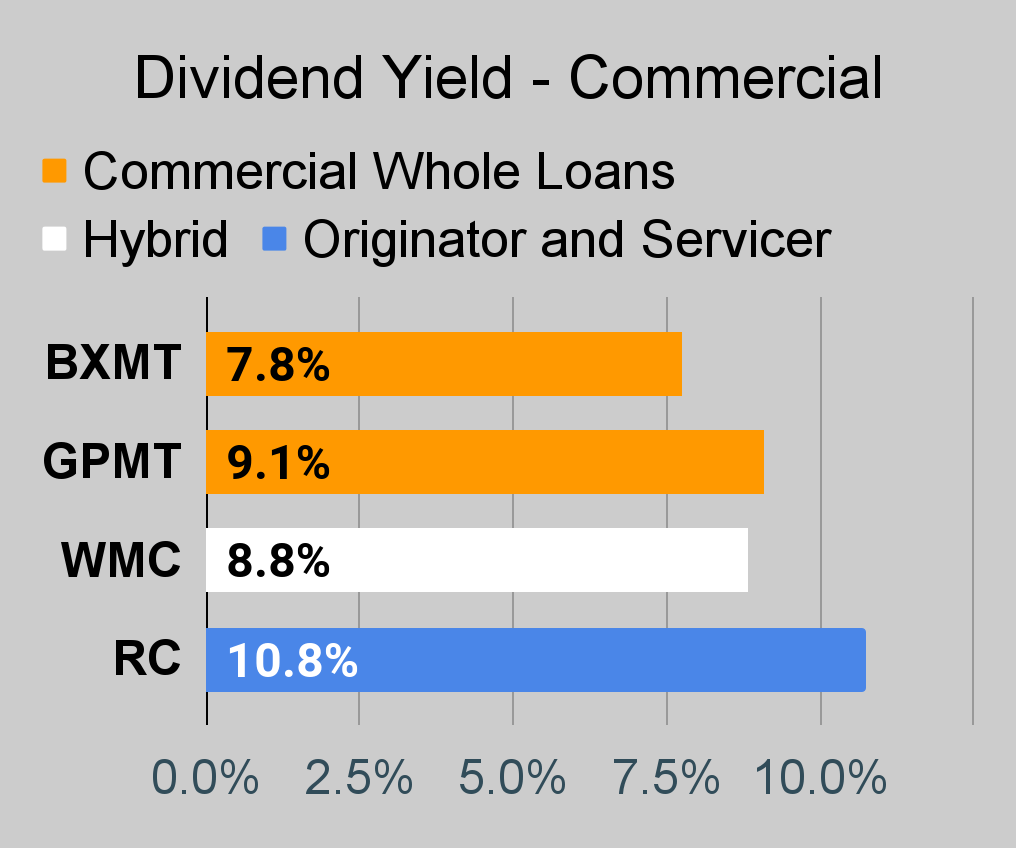
Commercial Mortgage REIT Charts
 The REIT Forum |
 The REIT Forum |
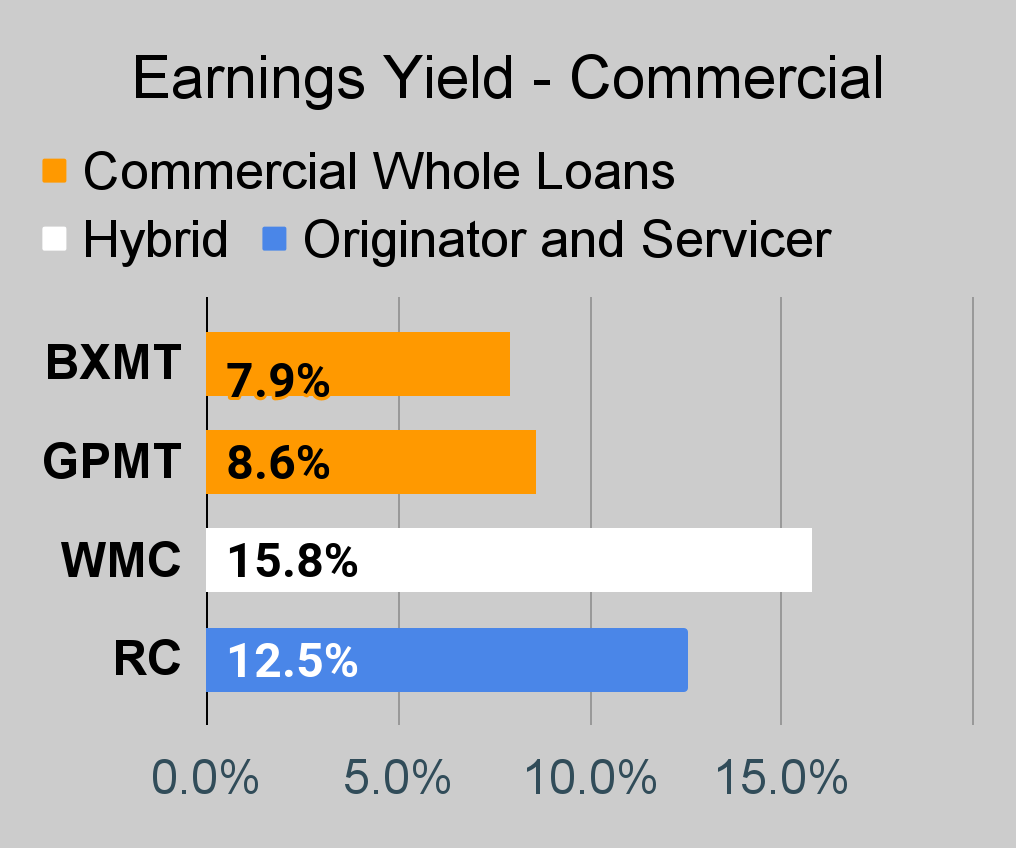 The REIT Forum |
BDC Charts
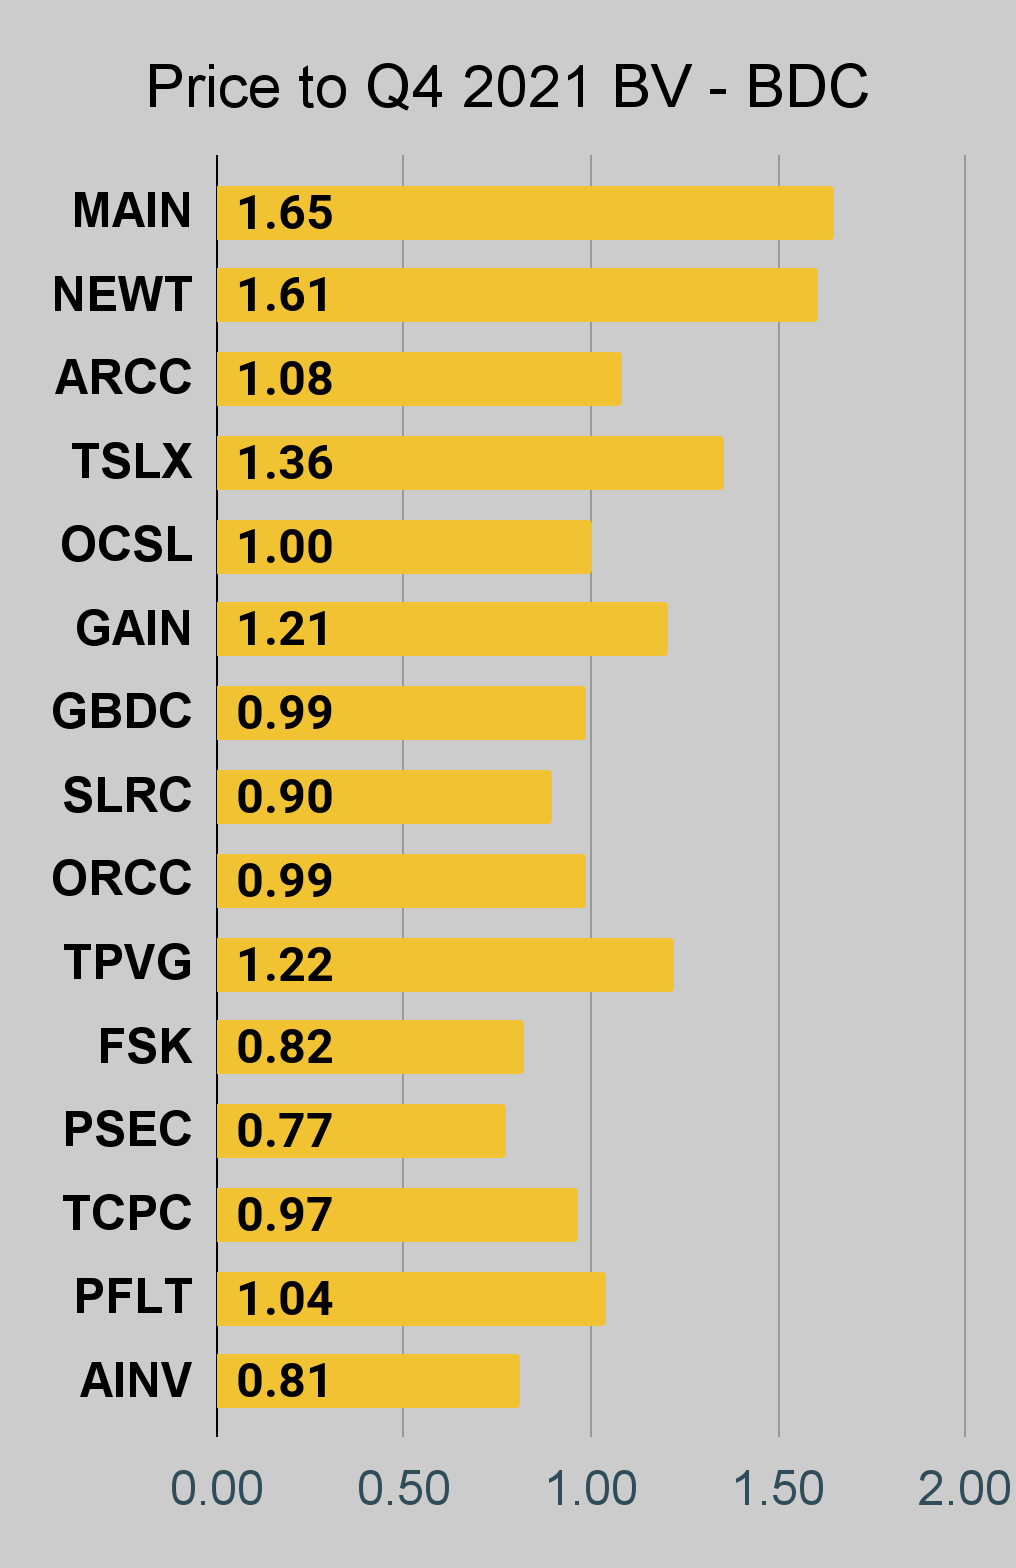 The REIT Forum |
 The REIT Forum |
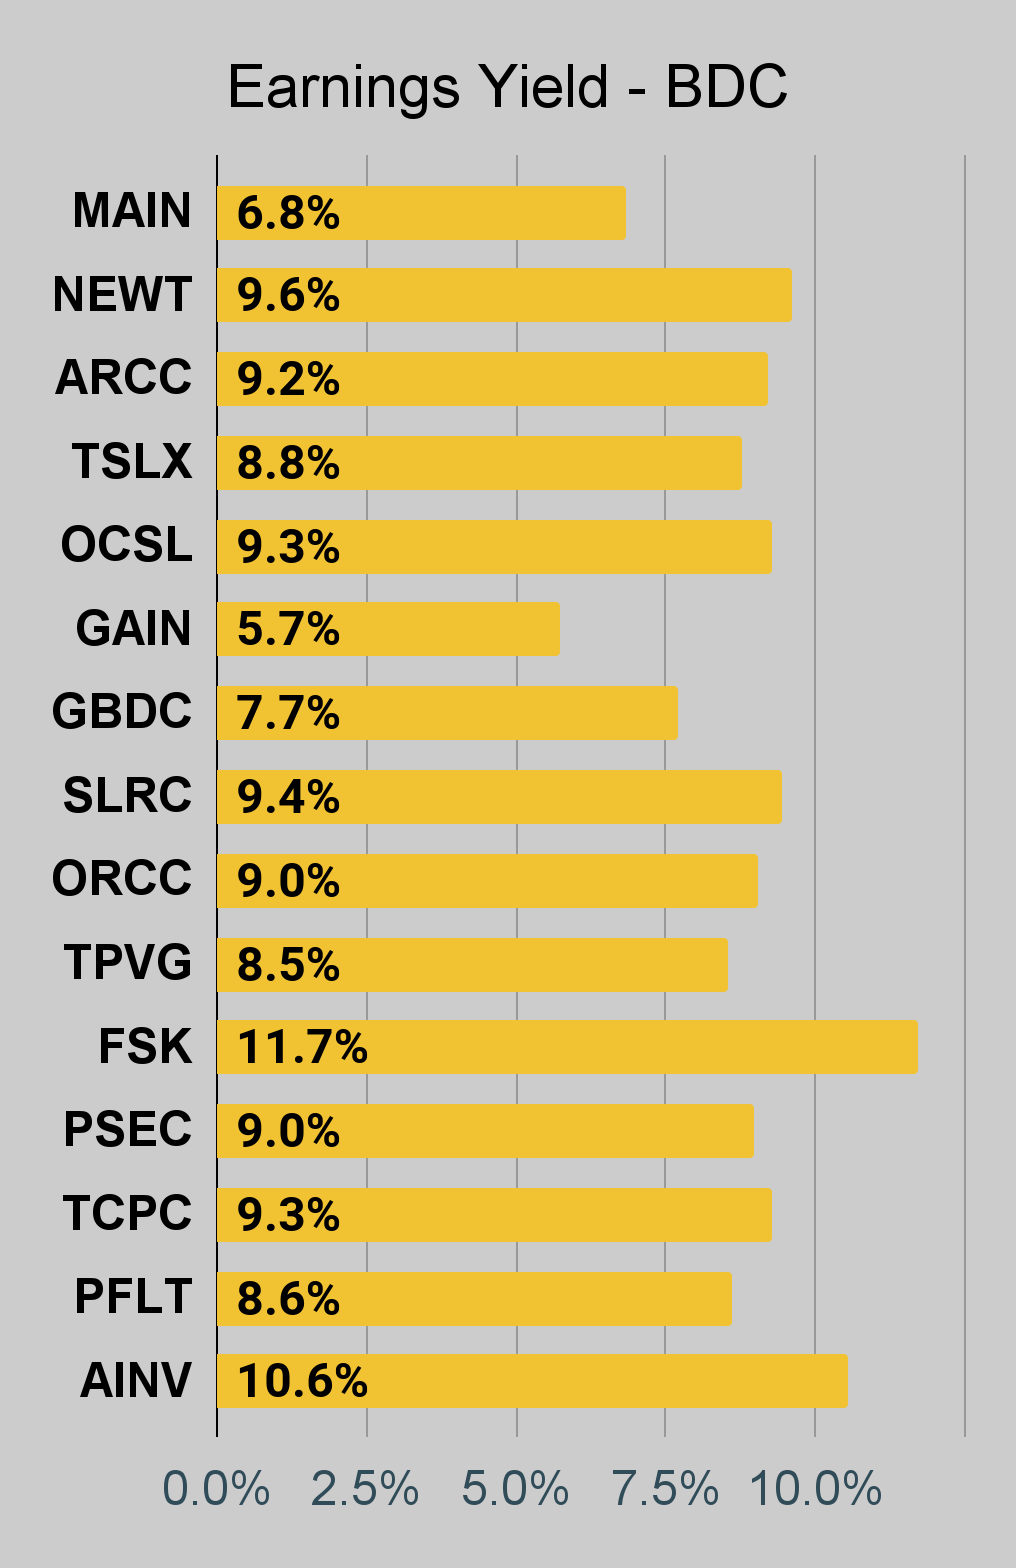 The REIT Forum |
Preferred Share Charts
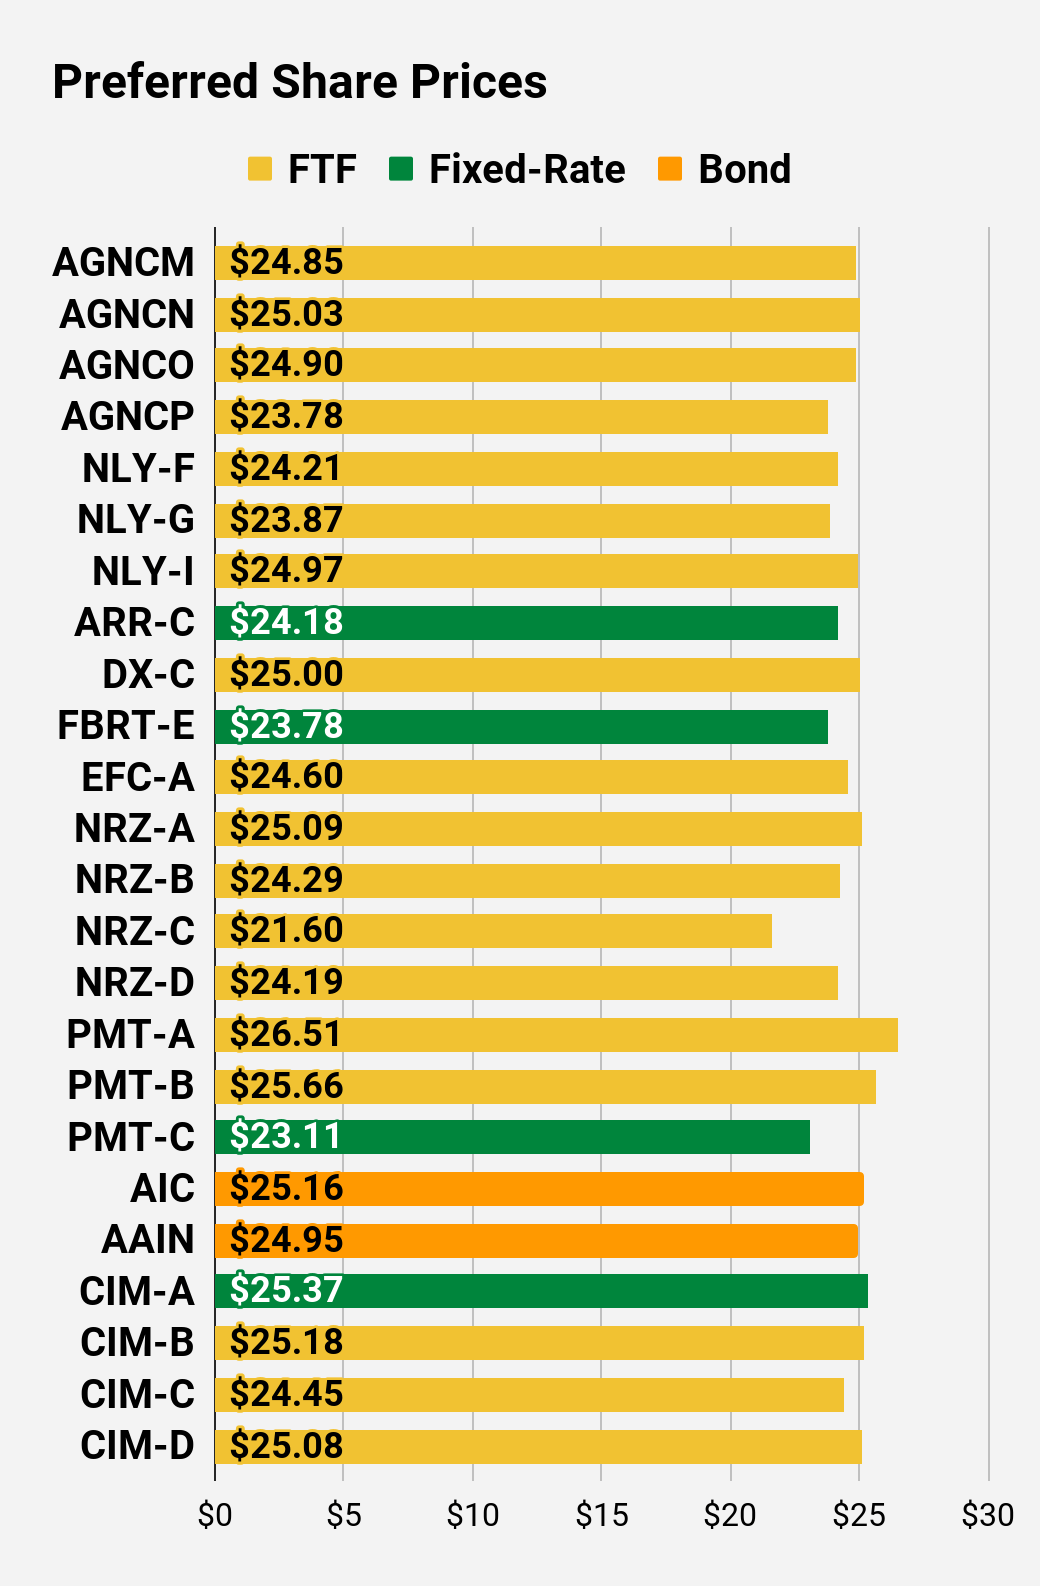 The REIT Forum |
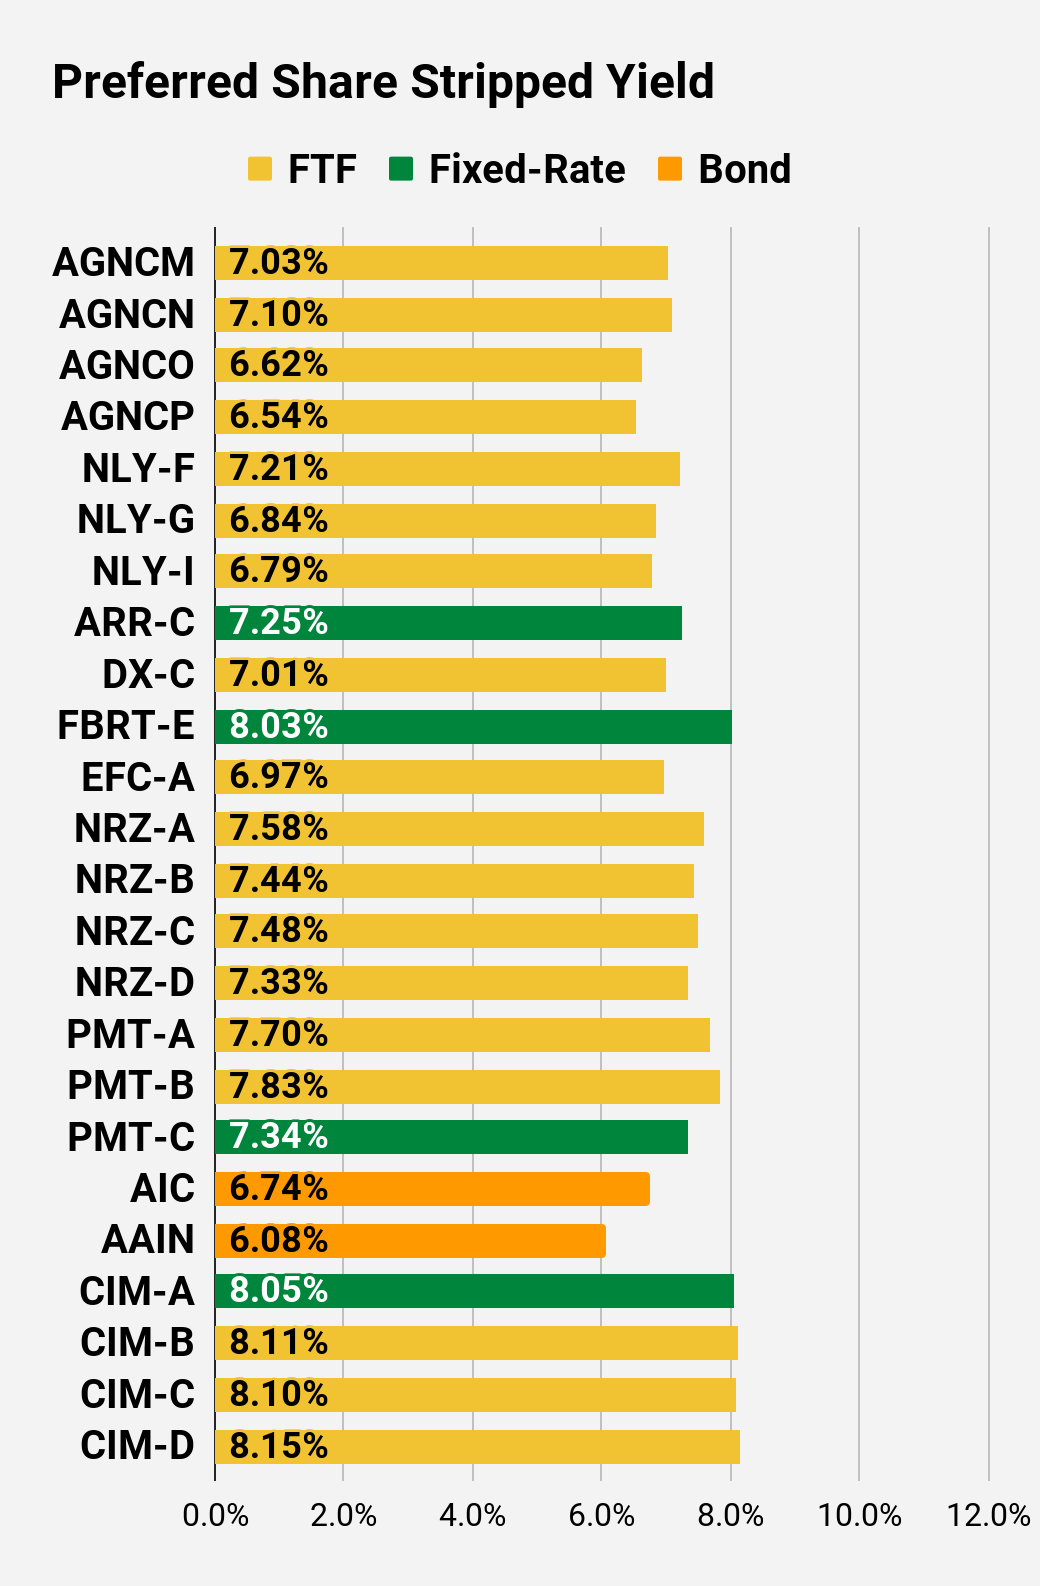 The REIT Forum |
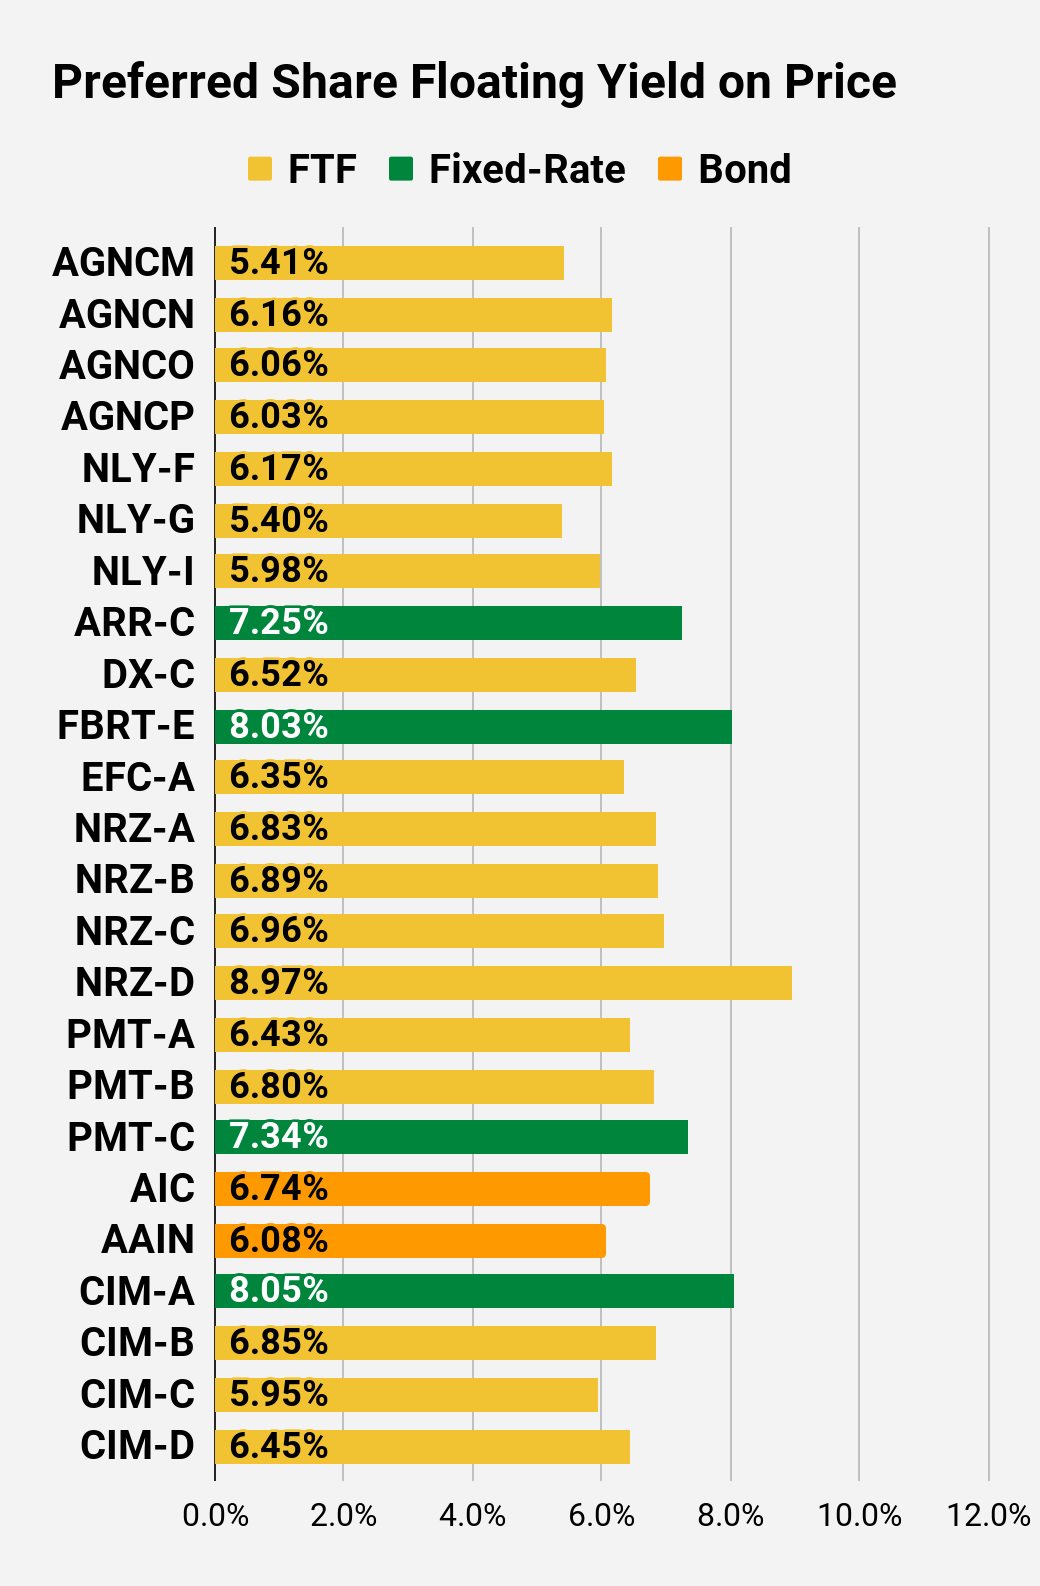 The REIT Forum |
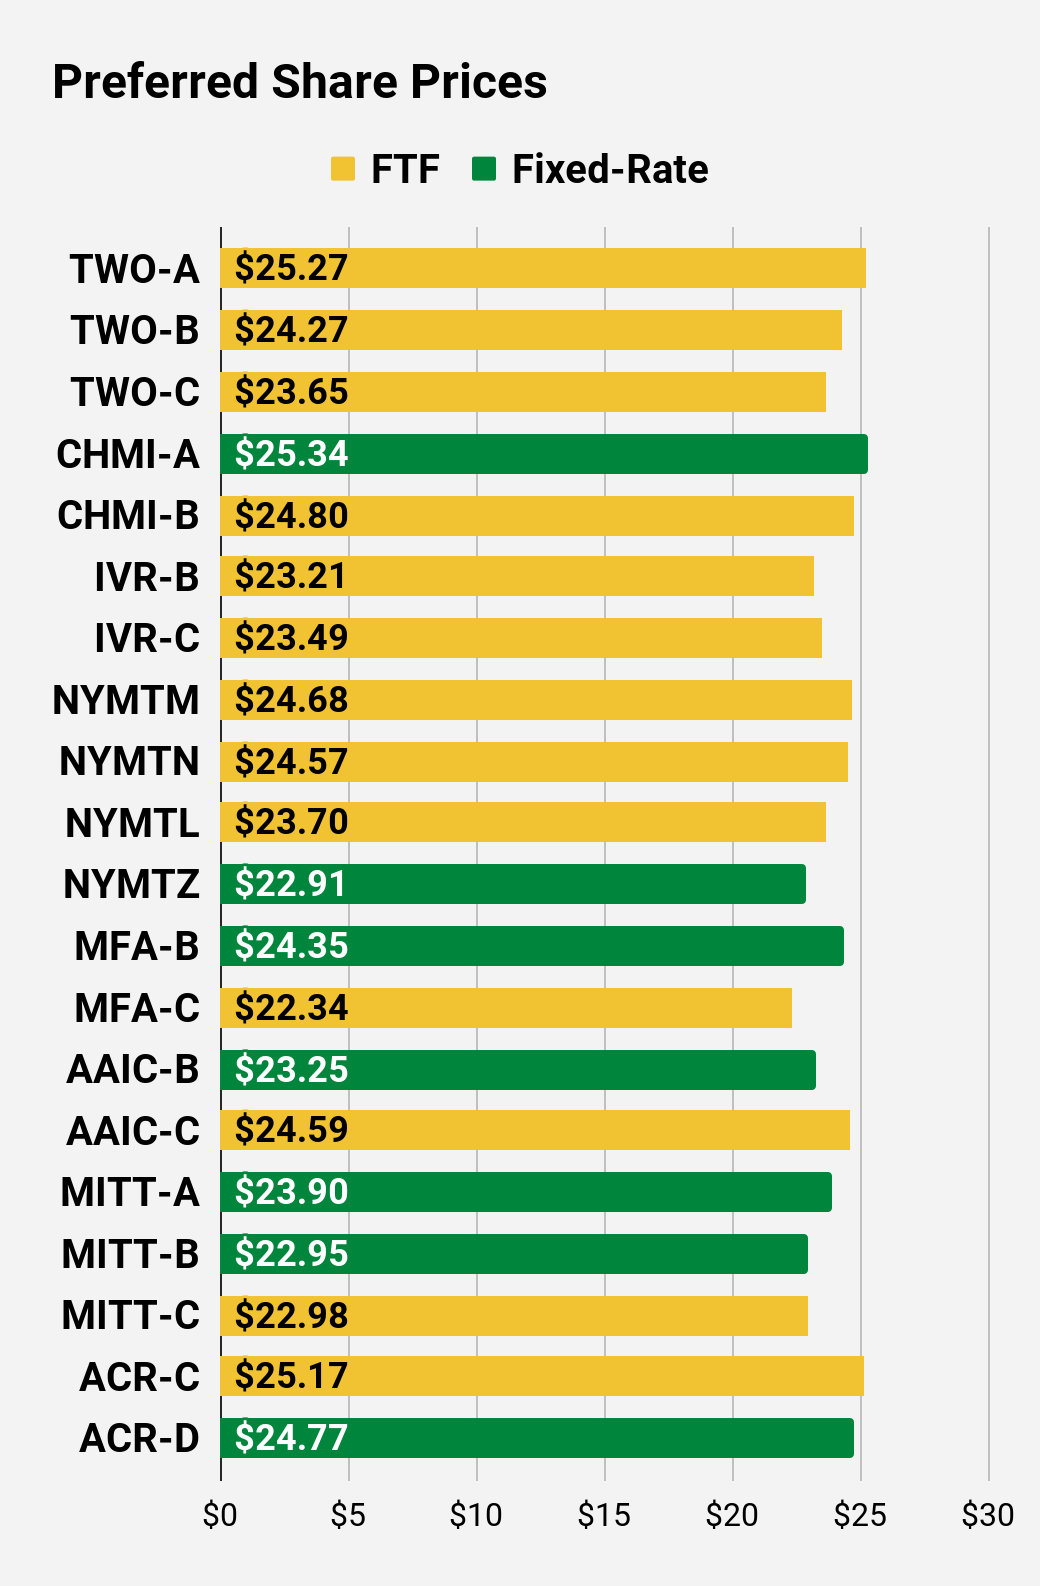 The REIT Forum |
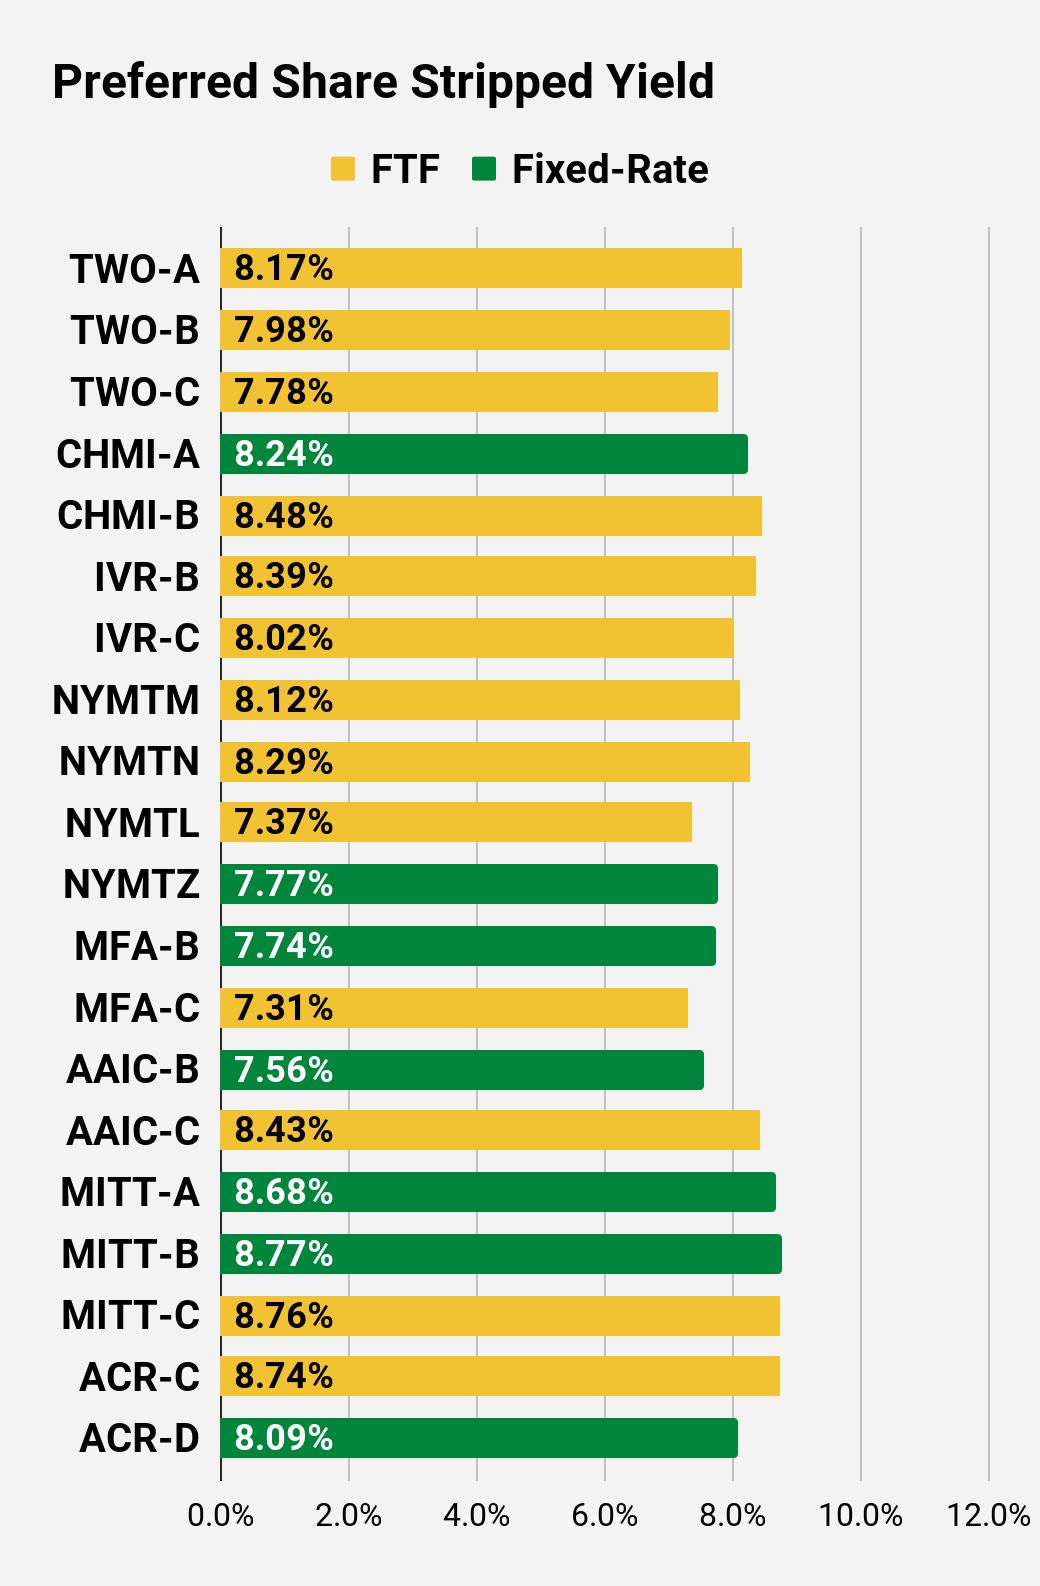 The REIT Forum |
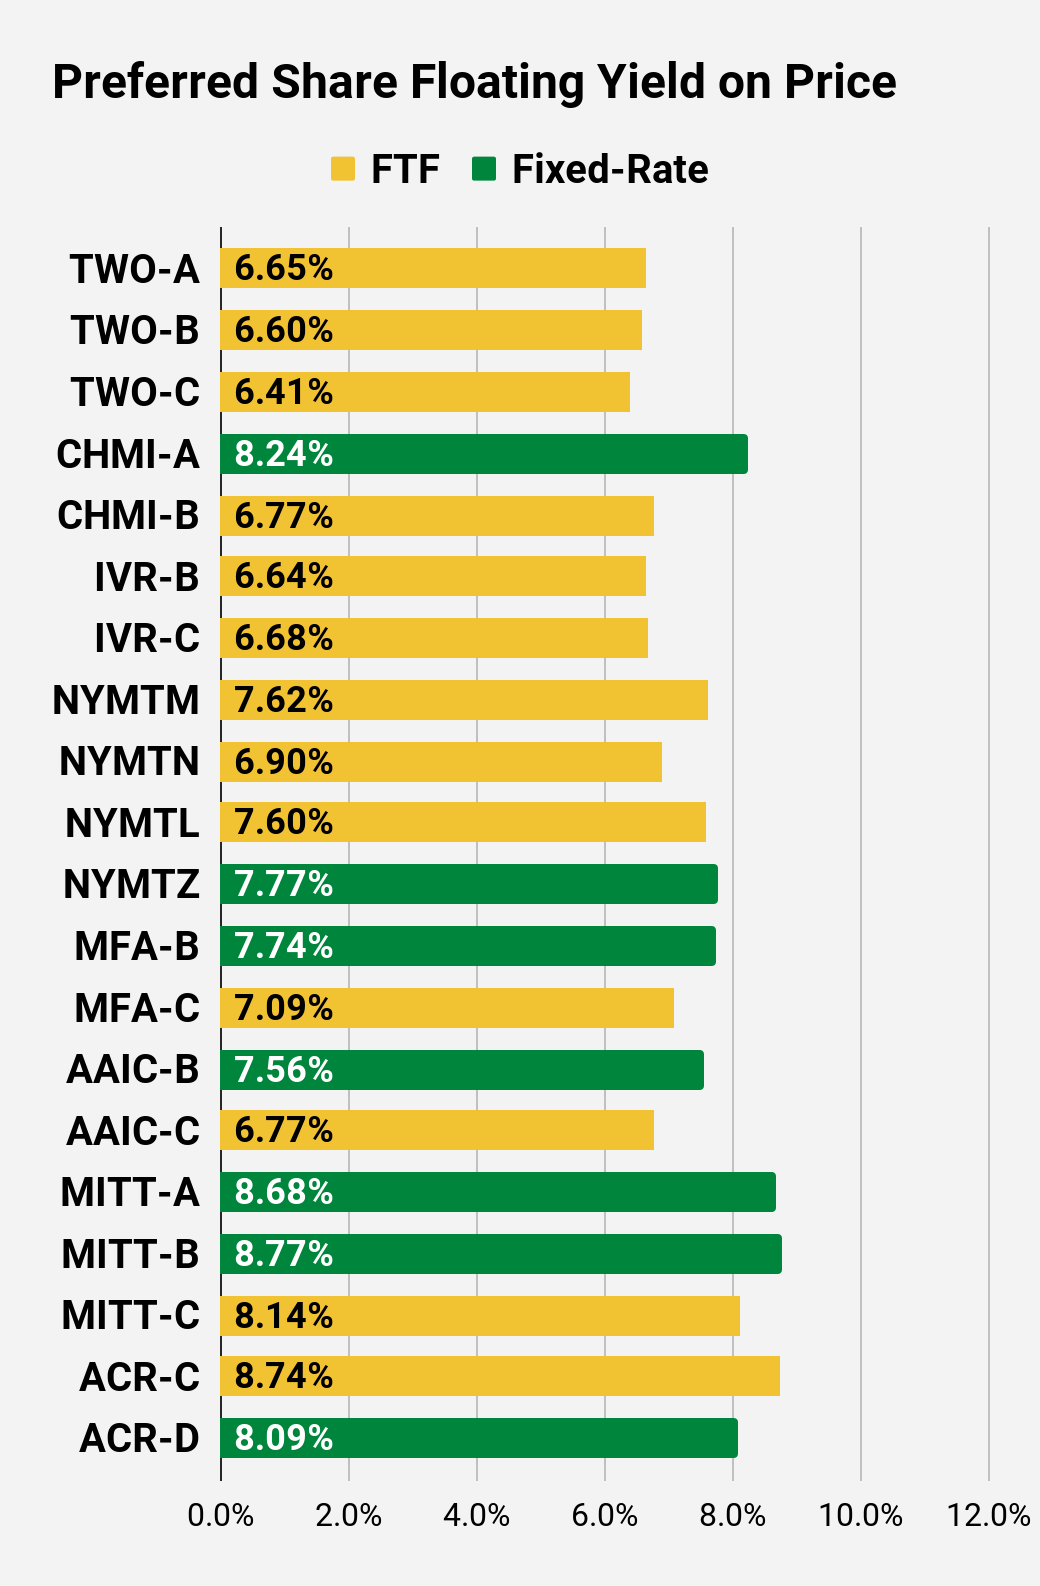 The REIT Forum |
Preferred Share Data
Beyond the charts, we’re also providing our readers with access to several other metrics for the preferred shares.
After testing out a series on preferred shares, we decided to try merging it into the series on common shares. After all, we’re still talking about positions in mortgage REITs. We don’t have any desire to cover preferred shares without cumulative dividends, so any preferred shares you see in our column will have cumulative dividends. You can verify that by using Quantum Online. We’ve included the links in the table below.
To better organize the table, we needed to abbreviate column names as follows:
- Price = Recent Share Price – Shown in Charts
- BoF = Bond or FTF (Fixed-to-Floating)
- S-Yield = Stripped Yield – Shown in Charts
- Coupon = Initial Fixed-Rate Coupon
- FYoP = Floating Yield on Price – Shown in Charts
- NCD = Next Call Date (the soonest shares could be called)
- Note: For all FTF issues, the floating rate would start on NCD.
- WCC = Worst Cash to Call (lowest net cash return possible from a call)
- QO Link = Link to Quantum Online Page
Second Batch:
Strategy
Our goal is to maximize total returns. We achieve those most effectively by including “trading” strategies. We regularly trade positions in the mortgage REIT common shares and BDCs because:
- Prices are inefficient.
- Long-term, share prices generally revolve around book value.
- Short-term, price-to-book ratios can deviate materially.
- Book value isn’t the only step in analysis, but it is the cornerstone.
We also allocate to preferred shares and equity REITs. We encourage buy-and-hold investors to consider using more preferred shares and equity REITs.
Performance
We compare our performance against four ETFs that investors might use for exposure to our sectors:

The REIT Forum
The four ETFs we use for comparison are:
|
Ticker |
Exposure |
|
One of the largest mortgage REIT ETFs |
|
|
One of the largest preferred share ETFs |
|
|
Largest equity REIT ETF |
|
|
The high-yield equity REIT ETF. Yes, it has been dreadful. |
When investors think it isn’t possible to earn solid returns in preferred shares or mortgage REITs, we politely disagree. The sector has plenty of opportunities, but investors still need to be wary of the risks. We can’t simply reach for yield and hope for the best. When it comes to common shares, we need to be even more vigilant to protect our principal by regularly watching prices and updating estimates for book value and price targets.
Ratings:
- AGNCP wins out over other shares with a risk rating of 1 (from AGNC and NLY).
- NRZ-C and NRZ-D beat NRZ-B and NRZ-A.
- PMT-C and ARR-C offer fixed-rate shares with pretty good yields and relatively low-risk ratings. PMT-B is okay, but not great (at current valuation). PMT-A is a bad deal.
Be the first to comment