

fotografstockholm/E+ via Getty Images
Inflation is the #1 issue facing America and indeed most of the world.
Charlie Bilello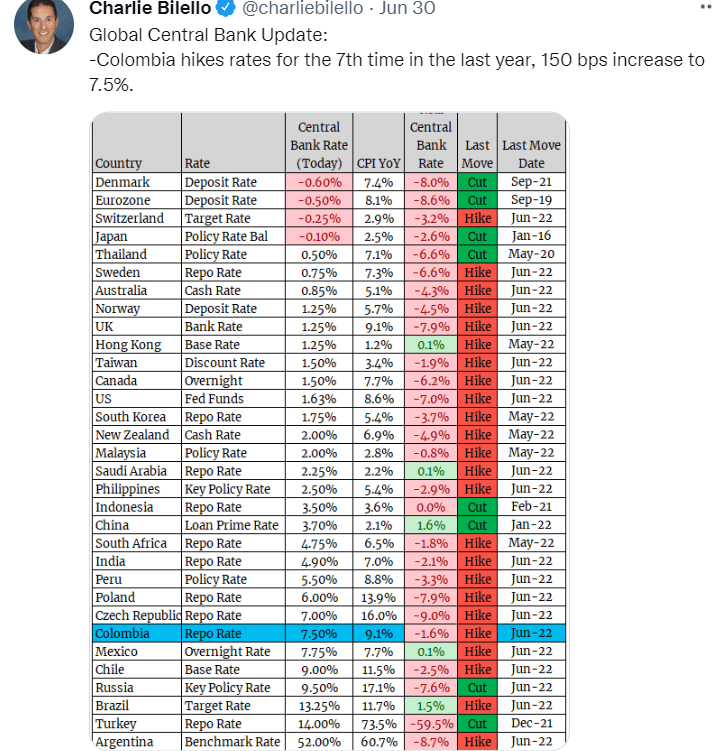
In the U.S., inflation is 8.6% on its way to 8.7%, according to the Cleveland Fed.
In the UK, it’s 9.1%, in Spain 10.2%, and in the EU 8.4% (last week’s report).
And in Germany, wholesale inflation just hit a record of 33.6%, driven mostly by an almost 150% increase in natural gas prices.
In the U.S., food prices are up 12%, driven by things like beef, which is up 33% YOY.
But do you know the one place where inflation is negative? The stock market.
Ycharts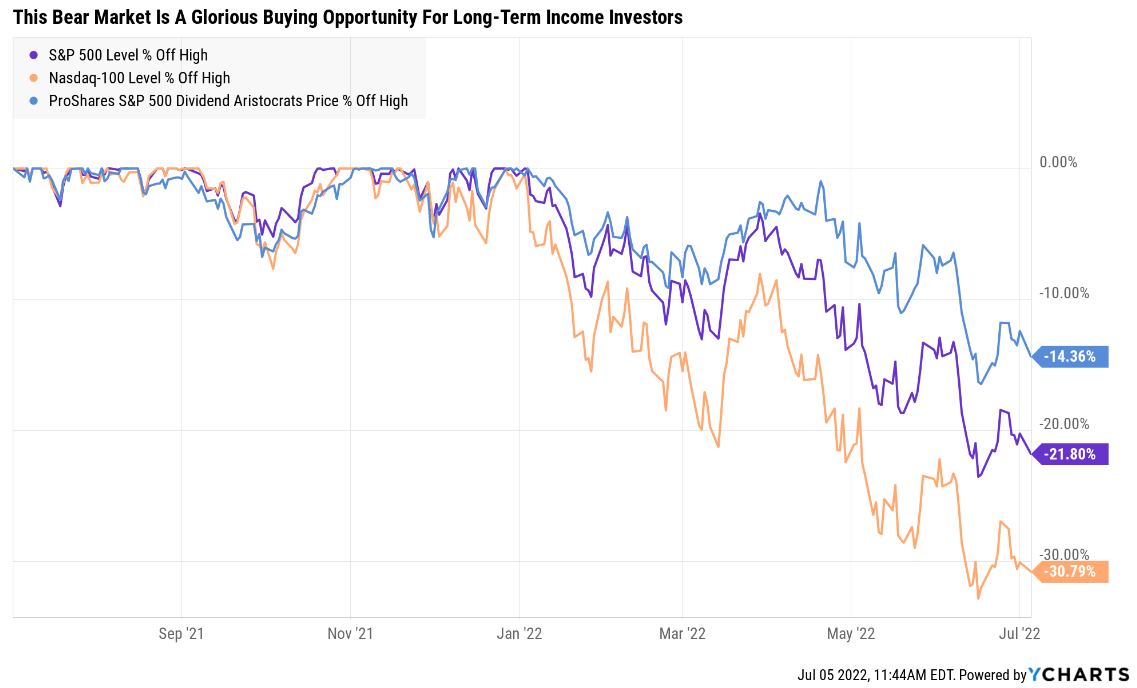
The 2022 bear market continues, with the 4th bear market rally recently failing due to rising recession fears in 2023.
Commodity prices are crashing, including oil falling 9.5% today alone as I write this.
That’s good news for inflation potentially peaking soon, and the bond market is already pricing in the Fed pivoting to a more dovish stance within 12 months.
CME Group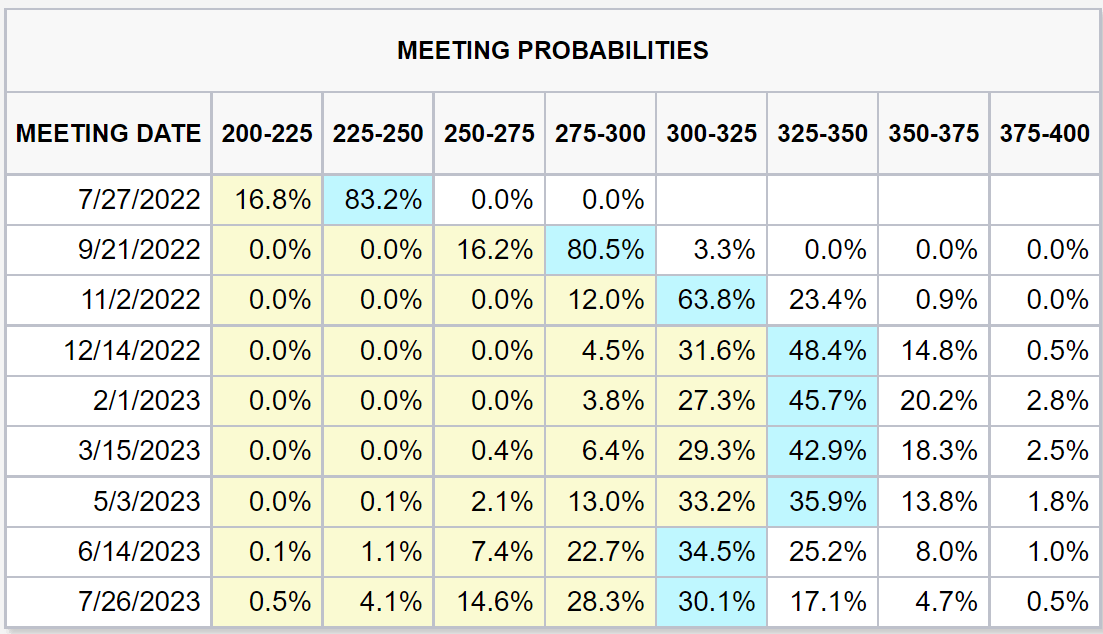
Just weeks ago, the bond market was pricing in the Fed hiking to 4% or even 4.25% by July 2023. Now recession fears have the bond market thinking the Fed will have to pivot 1% sooner and start cutting rates by June 2023.
But do you know the glorious upside to a bear market like this? The baby gets thrown out with the bathwater.
The world’s most dependable dividend blue-chips go on sale, and that includes the dividend aristocrats, companies with 25+ year dividend growth streaks.
That means companies that have been hiking dividends every single year since 1997 or earlier.
- through three major bear markets
- including the 2nd biggest crash in US market history
- through three recessions (not counting this one)
- including the two worst recessions since the Great Depression
- inflation as high as 8.6% (and counting)
- interest rates as high as 6%
- treasury yields as high as 6.5%
- over two dozen corrections and pullbacks
In other words, companies that are the bluest of blue-chips, and the most trustworthy names in steadily growing income in all economic conditions.
So today I want to highlight the three best July 4th aristocrat bargains, to help you take advantage of this bear market, so that you can hopefully retire in safety and splendor.
How To Find The Best Aristocrat Bargains In All Market Conditions
Dividend Aristocrats sorted by yield (Dividend Kings Zen Research Terminal)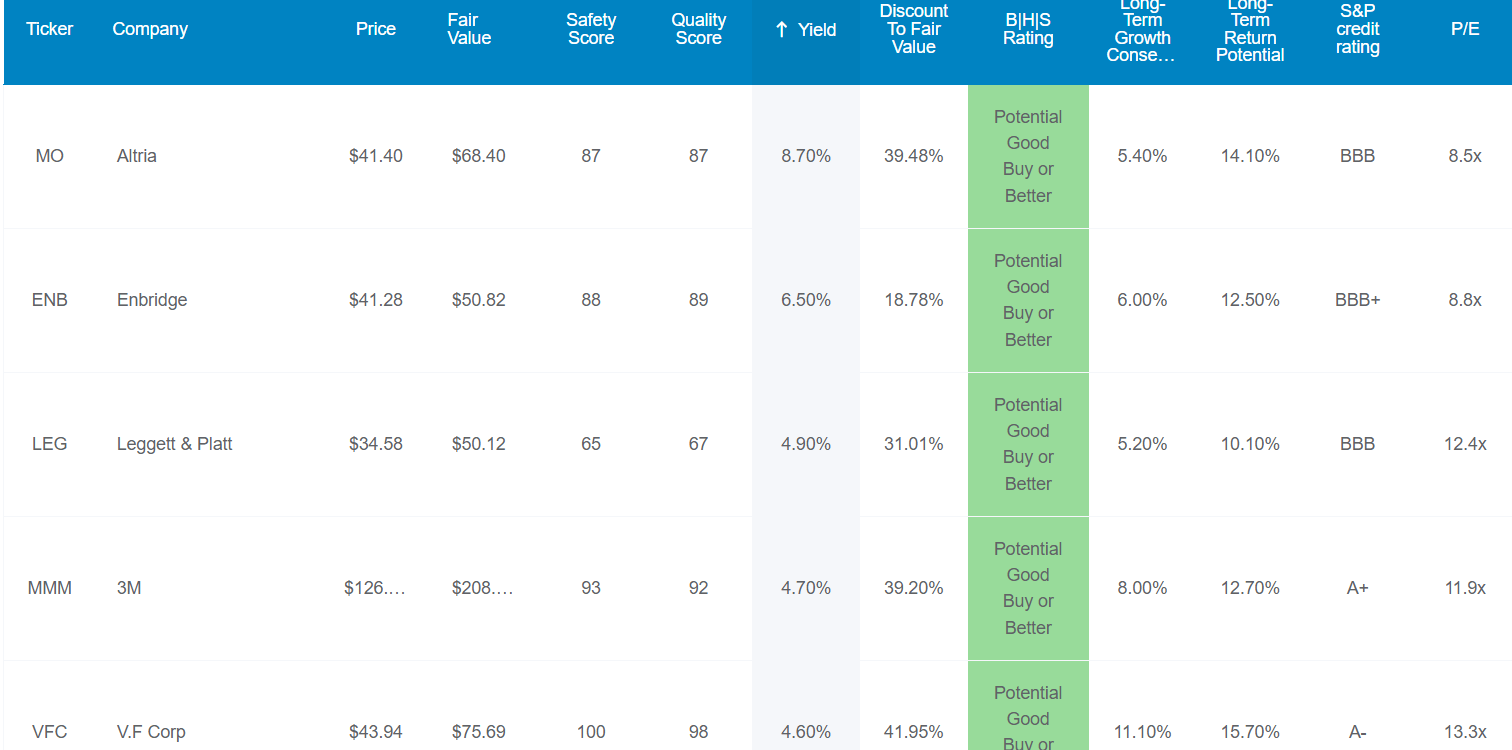
Everyone’s goals are different, and there isn’t actually a perfect aristocrat bargain for everyone.
But there are three things that historically drive 100% of total returns.
So those are the three sorting criteria I’m using in the Dividend Kings Zen Research Terminal.
- dividend champions list (all companies, including small ones and global ones, with 25+ year dividend growth streaks)
- potentially good buys or better (sufficient margin of safety to compensate for each company’s risk profile)
- 10+% long-term consensus total return potential (matching the market over time)
Then I simply sort the 33 dividend aristocrats that make the cut by the best yield, growth, and valuation and that’s how in 60 seconds I can highlight these incredible July 4th aristocrat bargains.
Altria Group, Inc. (MO): The High-Yield King Of Dividend Kings
- Altria: This 8% Yielding Dividend Aristocrat Could Potentially Double In 3 Years
- a full deep-dive analysis of MO’s growth outlook, risk profile, investment thesis, valuation, and total return potential
Reasons To Potentially Buy MO Today
- 87% quality low-risk 13/13 Ultra SWAN Dividend King
- 110th highest quality company on the Master List (78th percentile)
- 87% dividend safety score
- 53-year dividend growth streak
- 8.7% very safe yield (9.1% consensus yield after August hike)
- 0.5% average recession dividend cut risk
- 1.7% severe recession dividend cut risk
- 40% conservatively undervalued (potential Ultra Value buy)
- Fair Value: $68.37 (9.3X cash flow)
- 8.3X forward earnings vs 14X to 16X historical
- BBB stable outlook credit rating = 7.5% 30-year bankruptcy risk
- 61st industry percentile risk management consensus = above-average
- 4% to 6% CAGR margin-of-error growth consensus range
- 5.0% CAGR median growth consensus (down from 5.4% pre-Juul news)
- 5-year consensus total return potential: 14% to 18% CAGR
- base-case 5-year consensus return potential: 12% CAGR (25% more than the S&P consensus)
- consensus 12-month total return forecast: 33%
- Fundamentally Justified 12-Month Returns: 17% CAGR
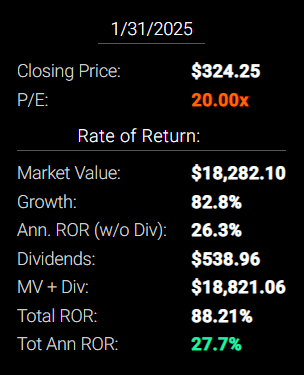
Altria 2024 Consensus Total Return Potential
(Source: FAST Graphs, FactSet Research)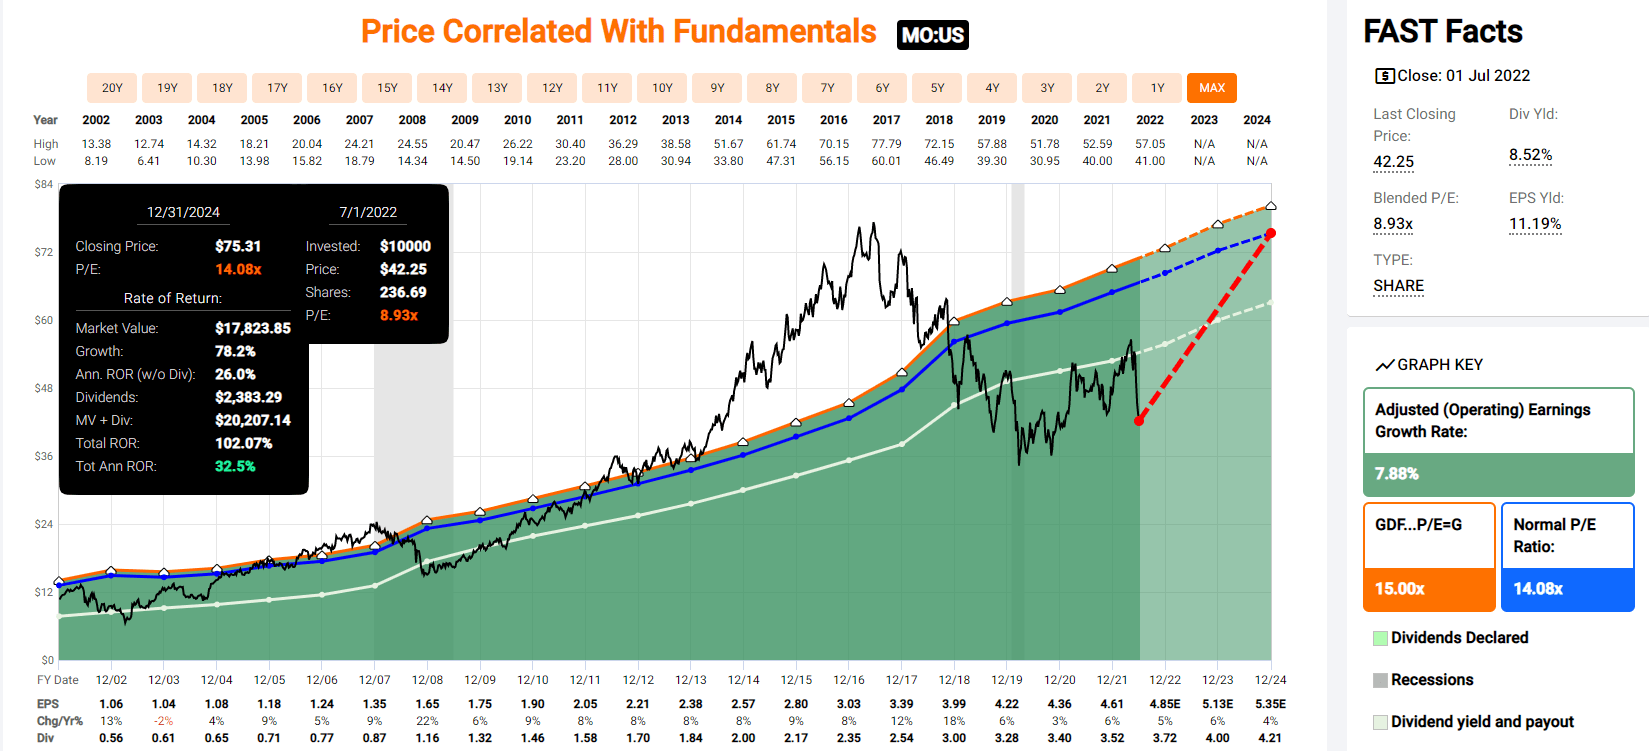
(Source: FAST Graphs, FactSet Research)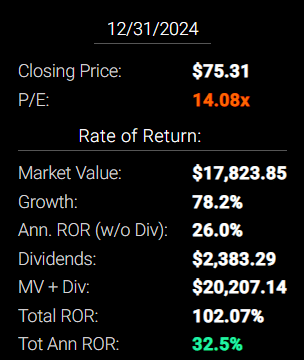
If MO grows as expected and returns to historical fair value by 2024, then investors would enjoy 102% total returns or 33% annually.
- Buffett and Greenblatt like returns from a dividend king bargain hiding in plain sight
Altria 2027 Consensus Total Return Potential
(Source: FAST Graphs, FactSet Research)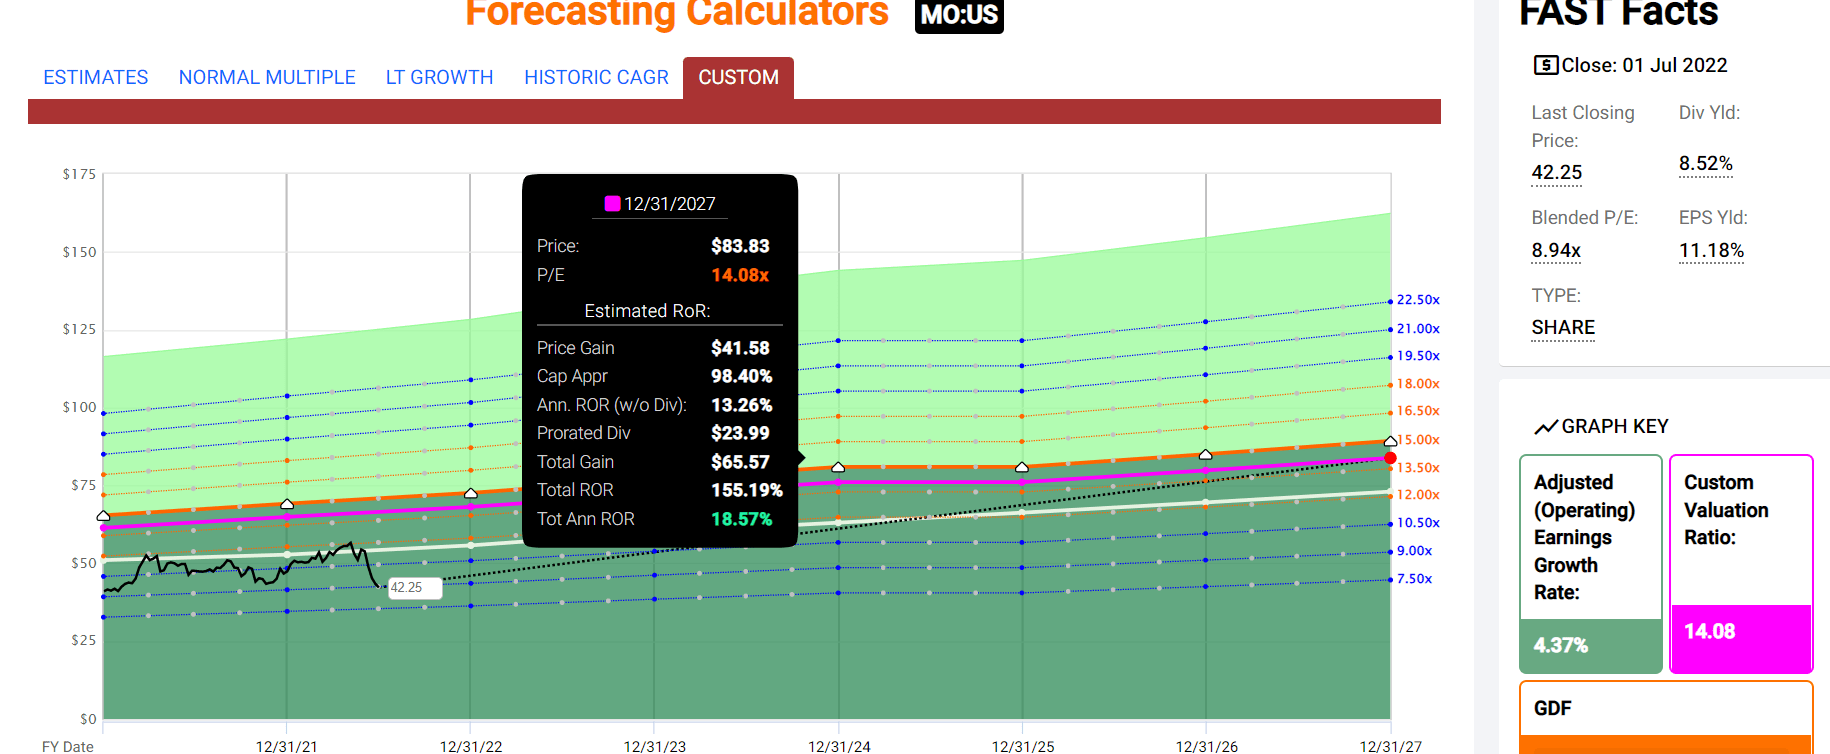
(Source: FAST Graphs, FactSet Research)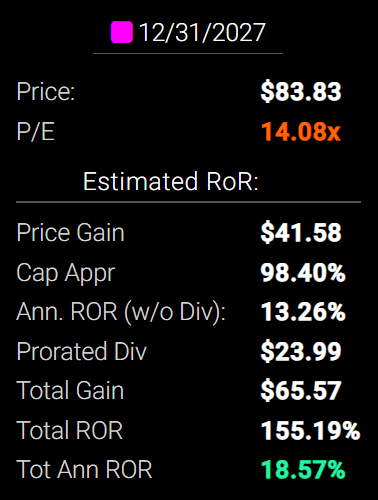
If MO grows at the modest rate of 4.4% through 2027 as analysts currently expect, then a return to historical fair value generates 155% total returns or 19% annually.
But it’s not just medium-term return potential that’s so impressive for MO.
| Investment Strategy | Yield | LT Consensus Growth | LT Consensus Total Return Potential | Long-Term Risk-Adjusted Expected Return | Long-Term Inflation And Risk-Adjusted Expected Returns | Years To Double Your Inflation & Risk-Adjusted Wealth |
10-Year Inflation And Risk-Adjusted Expected Return |
| Altria | 8.7% | 5.0% | 13.7% | 9.6% | 7.1% | 10.1 | 1.99 |
| Dividend Aristocrats | 2.4% | 8.5% | 10.9% | 7.6% | 5.2% | 14.0 | 1.65 |
| S&P 500 | 1.8% | 8.5% | 10.3% | 7.2% | 4.7% | 15.2 | 1.59 |
| Nasdaq | 1.0% | 12.7% | 13.7% | 9.6% | 7.1% | 10.1 | 1.99 |
(Source: Morningstar, FactSet, Ycharts)
Not only do analysts expect MO to deliver almost 14% long-term returns, potentially running circles around the aristocrats and S&P, they think MO can match the Nasdaq’s long-term returns but with 9X the very safe yield.
Inflation-Adjusted Consensus Total Return Potential: $1,000 Initial Investment
| Time Frame (Years) | 7.6% CAGR Inflation-Adjusted S&P Consensus | 8.4% Inflation-Adjusted Aristocrats Consensus | 11.2% CAGR Inflation-Adjusted MO Consensus | Difference Between Inflation-Adjusted MO Consensus Vs S&P Consensus |
| 5 | $1,445.67 | $1,493.29 | $1,702.59 | $256.92 |
| 10 | $2,089.97 | $2,229.92 | $2,898.81 | $808.84 |
| 15 | $3,021.42 | $3,329.92 | $4,935.48 | $1,914.06 |
| 20 | $4,367.98 | $4,972.54 | $8,403.08 | $4,035.10 |
| 25 | $6,314.67 | $7,425.45 | $14,307.00 | $7,992.32 |
| 30 | $9,128.95 | $11,088.36 | $24,358.92 | $15,229.97 |
(Source: DK Research Terminal, FactSet)
Over the next 30 years, analysts think MO can potentially deliver 24X returns or nearly 3X more than the S&P 500 and about 2X more than the dividend aristocrats.
| Time Frame (Years) | Ratio Aristocrats/S&P Consensus | Ratio Inflation-Adjusted MO Consensus vs S&P consensus |
| 5 | 1.03 | 1.18 |
| 10 | 1.07 | 1.39 |
| 15 | 1.10 | 1.63 |
| 20 | 1.14 | 1.92 |
| 25 | 1.18 | 2.27 |
| 30 | 1.21 | 2.67 |
(Source: DK Research Terminal, FactSet)
MO Investment Decision Score
DK
Dividend Kings Automated Investment Decision Tool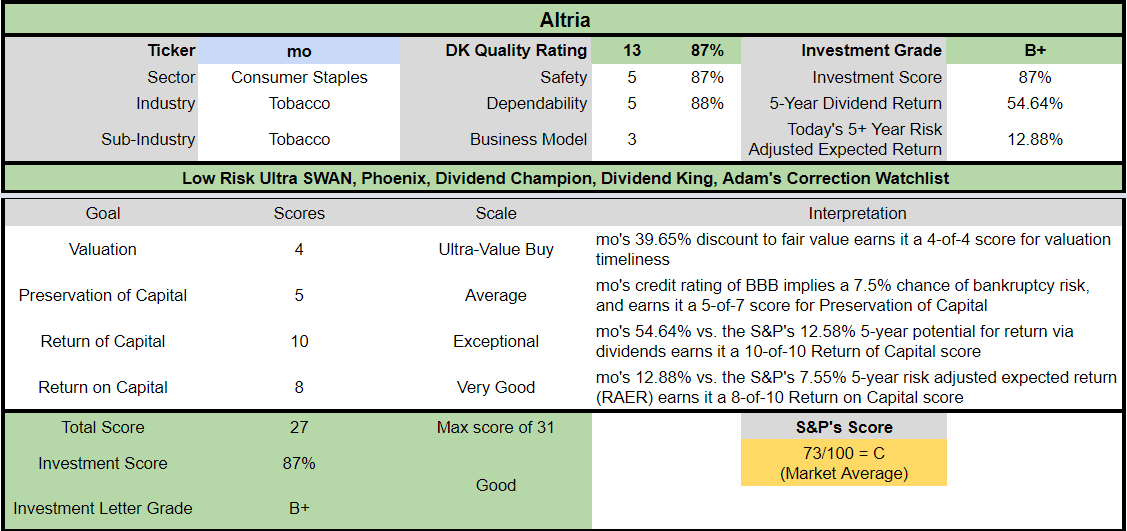
For anyone comfortable with its risk profile, MO is one of the most reasonable and prudent high-yield aristocrats you can buy today.
- 40% discount vs 5% market discount = 35% better valuation
- 8.7% yield vs 1.7% yield (and a much safer yield at that) and about 5X higher
- potentially 35% higher long-term return potential than S&P 500 overtime
- about 2X better risk-adjusted expected return over the next five years
- 55% of your investment repaid in consensus dividends within five years, about 4.5X the S&P 500
Lowe’s Companies, Inc. (LOW): The Growth King Of Dividend Kings
- Lowe’s: One Of The World’s Greatest Dividend Aristocrats Is On Sale
- a full deep-dive analysis of LOW’s growth outlook, risk profile, investment thesis, valuation, and total return potential
Reasons To Potentially Buy LOW Today
- 100% quality low-risk 13/13 Ultra SWAN dividend champion
- 2nd highest quality company on the Master List (100th percentile)
- 100% dividend safety score
- 60-year dividend growth streak
- 2.4% very safe yield
- 0.5% average recession dividend cut risk
- 1.0% severe recession dividend cut risk
- 36% conservatively undervalued (potential Ultra Value buy)
- Fair Value: $279.60 (20X earnings)
- 12.6X forward earnings vs 19 to 21X historical
- 10.2X cash-adjusted earnings = anti-bubble blue-chip
- BBB+ stable outlook credit rating = 5% 30-year bankruptcy risk
- 87th industry percentile risk management consensus = very good
- 13% to 24% CAGR margin-of-error growth consensus range
- 22.8% CAGR median growth consensus
- 5-year consensus total return potential: 20% to 24% CAGR
- base-case 5-year consensus return potential: 24% CAGR (4X more than the S&P consensus)
- consensus 12-month total return forecast: 56%
- Fundamentally Justified 12-Month Returns: 59% CAGR
LOW 2024 Consensus Total Return Potential
(Source: FAST Graphs, FactSet Research) (Source: FAST Graphs, FactSet Research)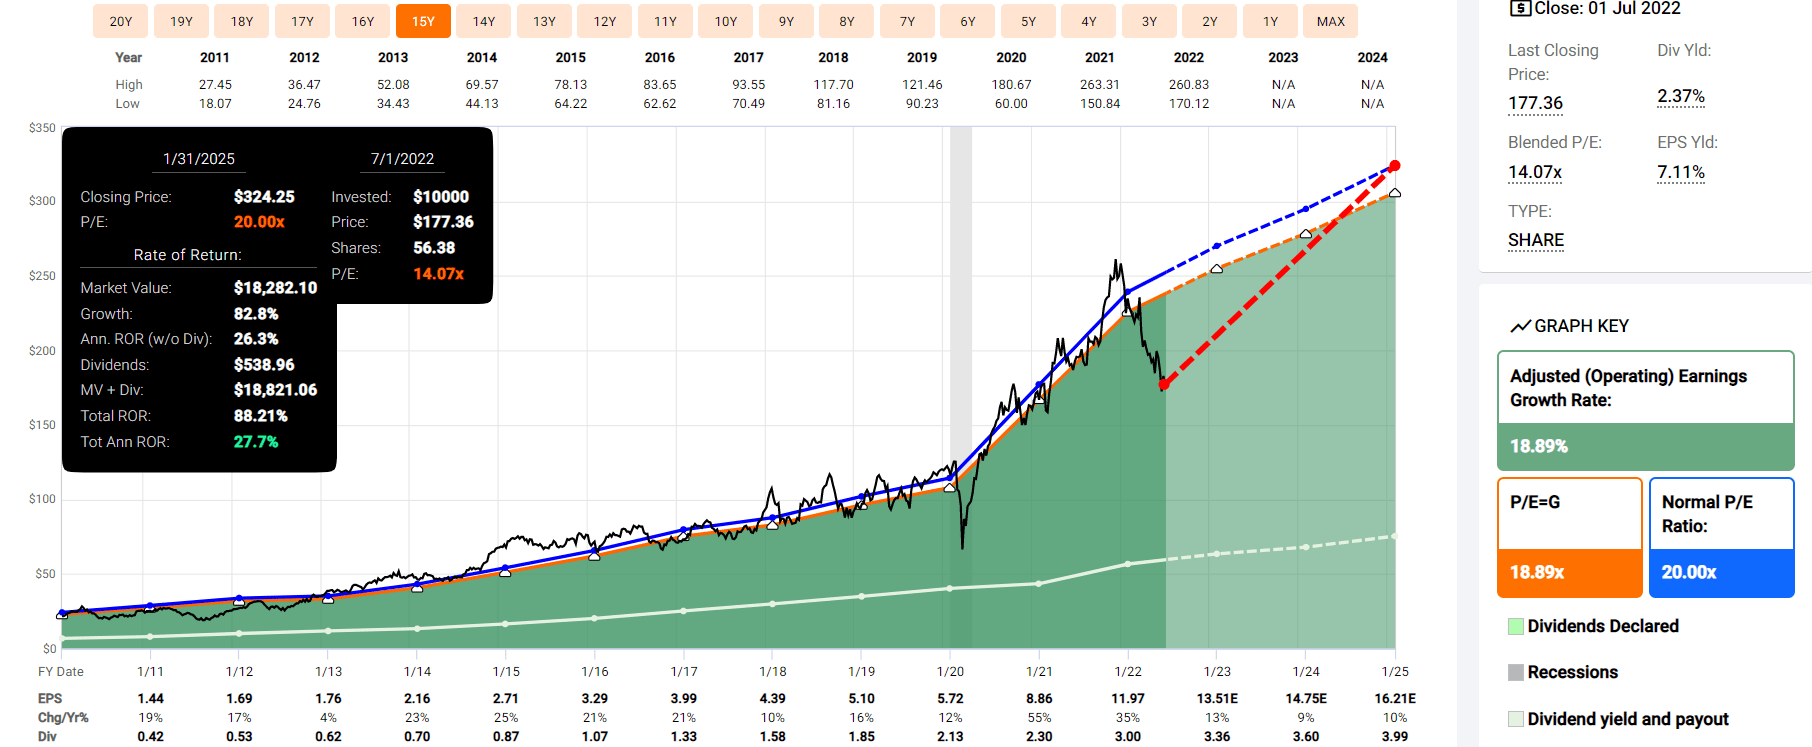
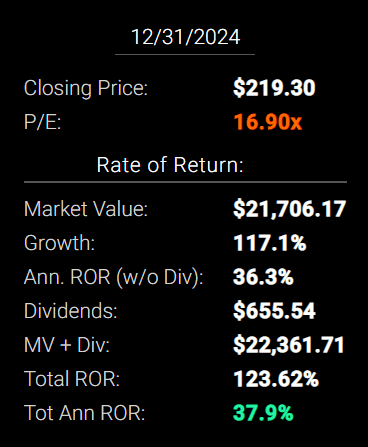
If LOW grows as expected and returns to historical fair value by 2025 then investors would enjoy 88% total returns or 28% annually.
- Buffett and Peter Lynch-like returns from a dividend king bargain hiding in plain sight
LOW 2027 Consensus Total Return Potential
(Source: FAST Graphs, FactSet Research) (Source: FAST Graphs, FactSet Research)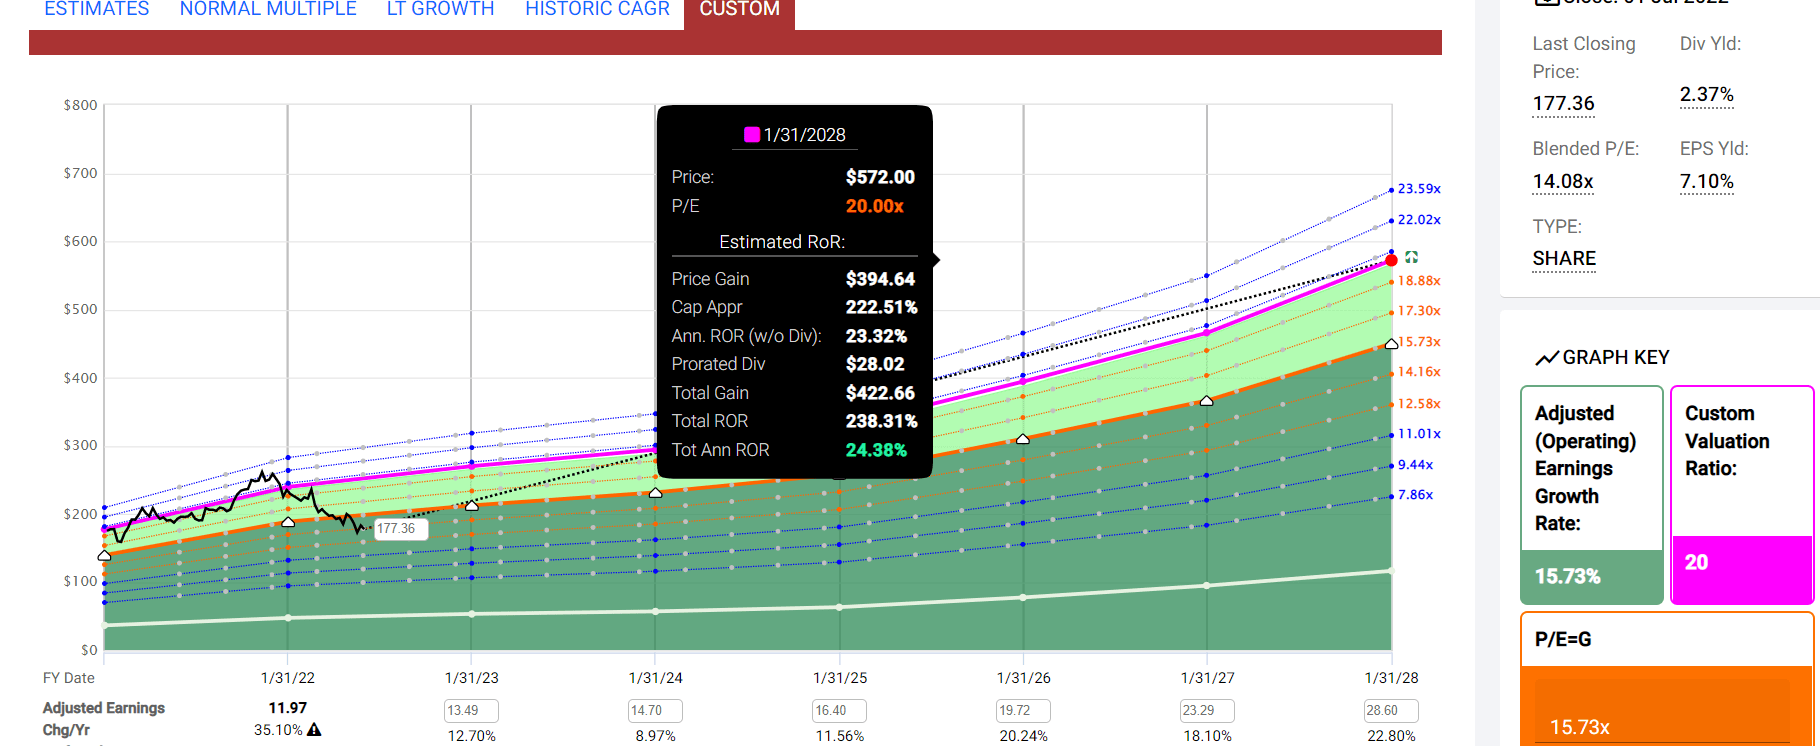
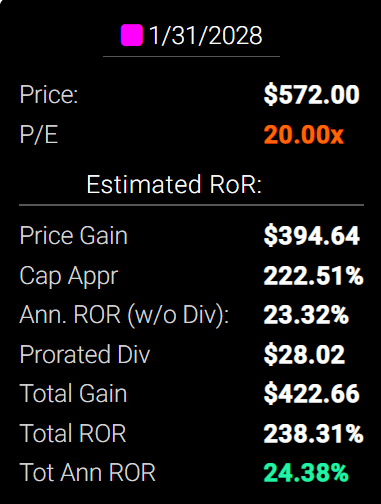
If LOW grows at the expected rate of 15.7% through 2027 as analysts currently expect, then a return to historical fair value generates 238% total returns or 24% annually.
- about 4X more than the S&P 500
- Buffett-like returns from a deep value dividend king bargain hiding in plain sight
And take a look at what analysts expect over the long-term.
| Investment Strategy | Yield | LT Consensus Growth | LT Consensus Total Return Potential | Long-Term Risk-Adjusted Expected Return | Long-Term Inflation And Risk-Adjusted Expected Returns | Years To Double Your Inflation & Risk-Adjusted Wealth |
10-Year Inflation And Risk-Adjusted Expected Return |
| Lowe’s | 2.4% | 22.8% | 25.2% | 17.6% | 15.2% | 4.7 | 4.11 |
| Nasdaq | 1.0% | 12.7% | 13.7% | 9.6% | 7.1% | 10.1 | 1.99 |
| Dividend Aristocrats | 2.4% | 8.5% | 10.9% | 7.6% | 5.2% | 14.0 | 1.65 |
| S&P 500 | 1.8% | 8.5% | 10.3% | 7.2% | 4.7% | 15.2 | 1.59 |
(Source: Morningstar, FactSet, Ycharts)
Lowe’s offers not just superior long-term return potential than the market and aristocrats, but analysts think it could outperform nearly every popular investment strategy on Wall Street.
Inflation-Adjusted Consensus Total Return Potential: $1,000 Initial Investment
| Time Frame (Years) | 7.6% CAGR Inflation-Adjusted S&P Consensus | 8.4% Inflation-Adjusted Aristocrats Consensus | 22.7% CAGR Inflation-Adjusted LOW Consensus | Difference Between Inflation-Adjusted LOW Consensus Vs S&P Consensus |
| 5 | $1,445.67 | $1,493.29 | $2,784.54 | $1,338.87 |
| 10 | $2,089.97 | $2,229.92 | $7,753.67 | $5,663.70 |
| 15 | $3,021.42 | $3,329.92 | $21,590.42 | $18,569.00 |
| 20 | $4,367.98 | $4,972.54 | $60,119.41 | $55,751.43 |
| 25 | $6,314.67 | $7,425.45 | $167,404.97 | $161,090.30 |
| 30 | $9,128.95 | $11,088.36 | $466,146.07 | $457,017.12 |
(Source: DK Research Terminal, FactSet)
Even if LOW only grows as fast as analysts expect for a half a decade that could potentially more than triple your inflation-adjusted money.
| Time Frame (Years) | Ratio Aristocrats/S&P Consensus | Ratio Inflation-Adjusted LOW Consensus vs S&P consensus |
| 5 | 1.03 | 1.93 |
| 10 | 1.07 | 3.71 |
| 15 | 1.10 | 7.15 |
| 20 | 1.14 | 13.76 |
| 25 | 1.18 | 26.51 |
| 30 | 1.21 | 51.06 |
(Source: DK Research Terminal, FactSet)
That’s potentially 90% more than the S&P and the dividend aristocrats.
LOW Investment Decision Score
DK
Dividend Kings Automated Investment Decision Tool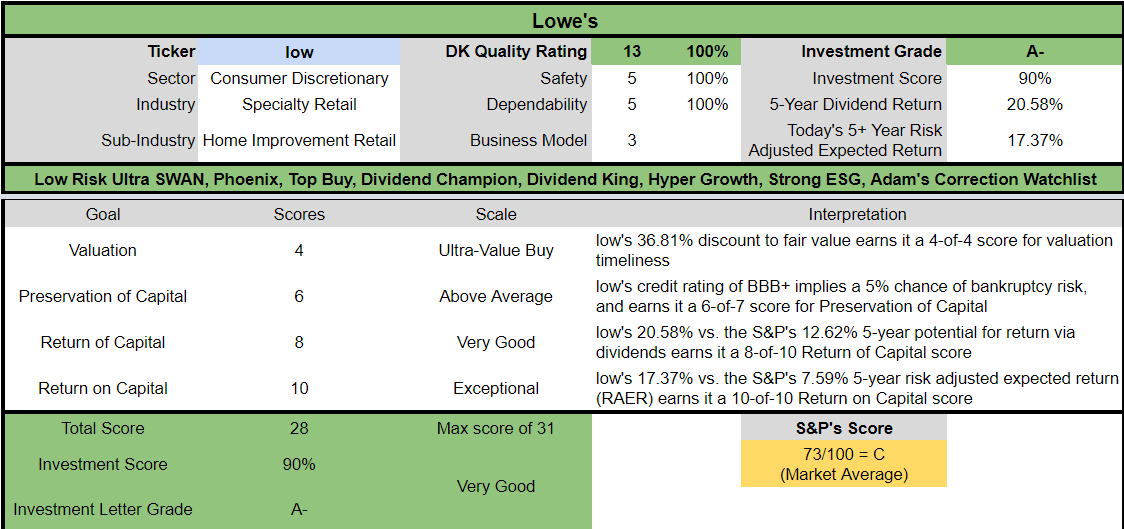
For anyone comfortable with its risk profile, LOW is one of the best hyper-growth dividend aristocrats you can buy today.
- 37% discount vs 5% market discount = 32% better valuation
- 2.4% yield vs 1.7% yield (and a much safer yield at that)
- potentially 150% higher long-term return potential than S&P 500 overtime
- about 3X better risk-adjusted expected return over the next five years
- 21% of your investment repaid in consensus dividends within five years, almost 2X more than the S&P 500
Polaris Inc. (PII): The Anti-Bubble Discount Champion
- Polaris: A 42% Undervalued Dividend Aristocrat Set For Strong, Long-Term Growth
- a full deep-dive analysis of PII’s growth outlook, risk profile, investment thesis, valuation, and total return potential
Reasons To Potentially Buy PII Today
- 89% quality medium-risk 13/13 Ultra SWAN dividend champion
- 75th highest quality company on the Master List (85th percentile)
- 92% dividend safety score
- 27-year dividend growth streak
- 2.4% very safe yield
- 0.5% average recession dividend cut risk
- 1.4% severe recession dividend cut risk
- 40% conservatively undervalued (potential Ultra Value buy)
- Fair Value: $177.70 (16.9X earnings)
- 10.1X forward earnings vs 16.5 to 18X historical
- 7.5X cash-adjusted earnings = anti-bubble blue-chip
- Effective A+ stable outlook credit rating = 0.6% 30-year bankruptcy risk
- 58th industry percentile risk management consensus = average
- 4% to 17% CAGR margin-of-error growth consensus range
- 15.0% CAGR median growth consensus
- 5-year consensus total return potential: 16% to 26% CAGR
- base-case 5-year consensus return potential: 25% CAGR (4X more than the S&P consensus)
- consensus 12-month total return forecast: 19%
- Fundamentally Justified 12-Month Returns: 69% CAGR
PII 2024 Consensus Total Return Potential
(Source: FAST Graphs, FactSet Research) (Source: FAST Graphs, FactSet Research)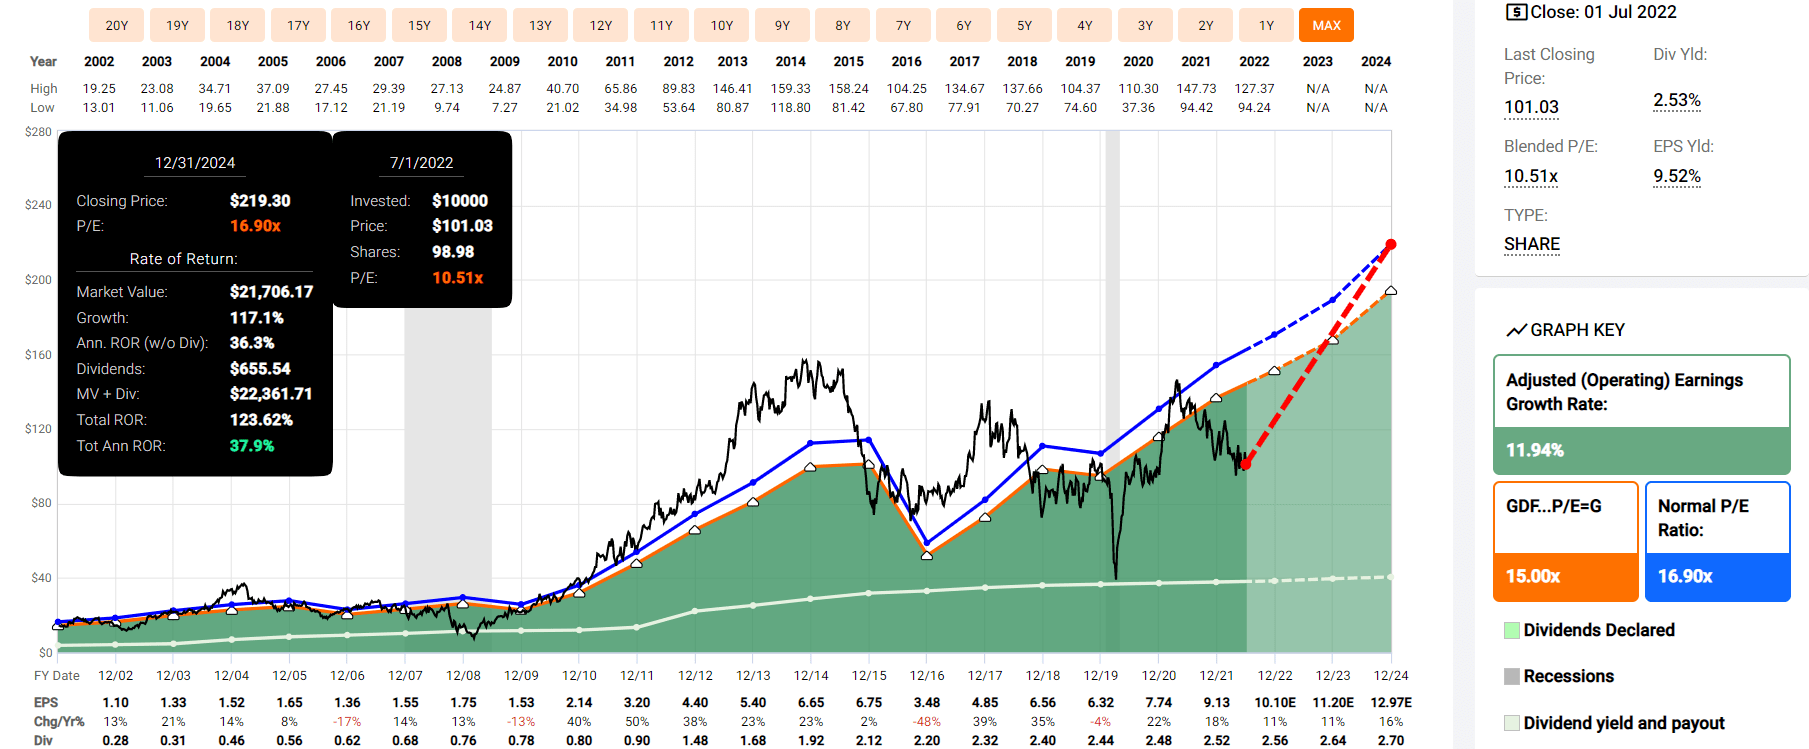
If PII grows as expected and returns to historical fair value by 2025 then investors would enjoy 124% total returns or 38% annually.
- Buffett and Greenblatt-like returns from a dividend king bargain hiding in plain sight
PII 2027 Consensus Total Return Potential
(Source: FAST Graphs, FactSet Research) (Source: FAST Graphs, FactSet Research)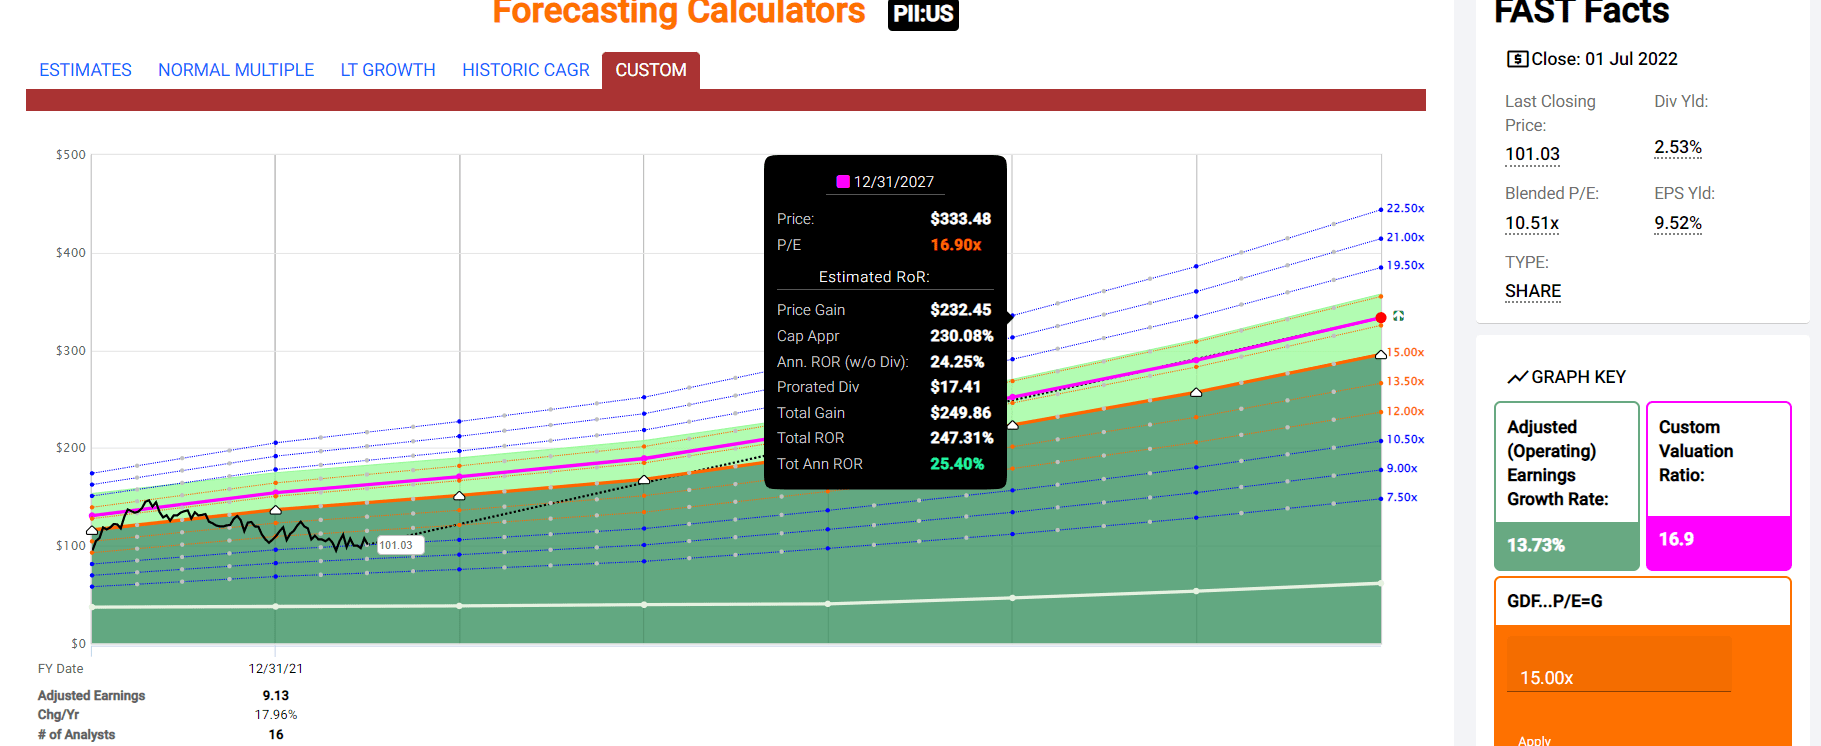
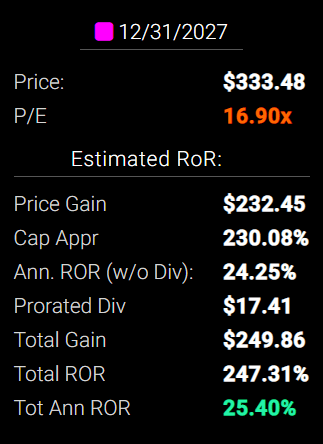
If PII grows at the expected rate of 13.7% through 2027 as analysts currently expect, then a return to historical fair value generates 247% total returns or 25% annually.
- about 4X more than the S&P 500
- Buffett-like returns from a deep value dividend king bargain hiding in plain sight
And take a look at what analysts expect over the long-term.
| Investment Strategy | Yield | LT Consensus Growth | LT Consensus Total Return Potential | Long-Term Risk-Adjusted Expected Return | Long-Term Inflation And Risk-Adjusted Expected Returns | Years To Double Your Inflation & Risk-Adjusted Wealth |
10-Year Inflation And Risk-Adjusted Expected Return |
| Polaris | 2.4% | 15.0% | 17.4% | 12.2% | 9.7% | 7.4 | 2.53 |
| Nasdaq | 1.0% | 12.7% | 13.7% | 9.6% | 7.1% | 10.1 | 1.99 |
| Dividend Aristocrats | 2.4% | 8.5% | 10.9% | 7.6% | 5.2% | 14.0 | 1.65 |
| S&P 500 | 1.8% | 8.5% | 10.3% | 7.2% | 4.7% | 15.2 | 1.59 |
(Source: Morningstar, FactSet, Ycharts)
PII’s offers not just superior long-term return potential than the market and aristocrats, but analysts think it could outperform nearly every popular investment strategy on Wall Street.
Inflation-Adjusted Consensus Total Return Potential: $1,000 Initial Investment
| Time Frame (Years) | 7.6% CAGR Inflation-Adjusted S&P Consensus | 8.4% Inflation-Adjusted Aristocrats Consensus | 14.9% CAGR Inflation-Adjusted PII Consensus | Difference Between Inflation-Adjusted PII Consensus Vs S&P Consensus |
| 5 | $1,445.67 | $1,493.29 | $2,005.24 | $559.57 |
| 10 | $2,089.97 | $2,229.92 | $4,021.00 | $1,931.03 |
| 15 | $3,021.42 | $3,329.92 | $8,063.08 | $5,041.67 |
| 20 | $4,367.98 | $4,972.54 | $16,168.44 | $11,800.46 |
| 25 | $6,314.67 | $7,425.45 | $32,421.65 | $26,106.98 |
| 30 | $9,128.95 | $11,088.36 | $65,013.30 | $55,884.34 |
(Source: DK Research Terminal, FactSet)
Even if PII only grows as fast as analysts expect for a decade that could potentially more than quadruple your inflation-adjusted money.
| Time Frame (Years) | Ratio Aristocrats/S&P Consensus | Ratio Inflation-Adjusted PII Consensus vs S&P consensus |
| 5 | 1.03 | 1.39 |
| 10 | 1.07 | 1.92 |
| 15 | 1.10 | 2.67 |
| 20 | 1.14 | 3.70 |
| 25 | 1.18 | 5.13 |
| 30 | 1.21 | 7.12 |
(Source: DK Research Terminal, FactSet)
That’s potentially double the S&P and 80% more than the dividend aristocrats.
PII Investment Decision Score
DK
Dividend Kings Automated Investment Decision Tool
For anyone comfortable with its risk profile, PII is one of the best hyper-growth dividend aristocrats you can buy today.
- 41% discount vs 5% market discount = 36% better valuation
- 2.4% yield vs 1.7% yield (and a much safer yield at that)
- potentially 75% higher long-term return potential than S&P 500 overtime
- about 3X better risk-adjusted expected return over the next five years
- 17% of your investment repaid in consensus dividends within five years, about 50% more than the S&P 500
Bottom Line: These Are The 3 Best July 4th Dividend Aristocrat Bargains
I know bear markets can be scary, but rather than obsess over something you can’t control, paper losses, why not focus on the positive. The world’s best companies go on sale, and that’s how you can earn long-term life-changing returns like this.
Historical Rolling Returns Since 1987
Portfolio Visualizer Premium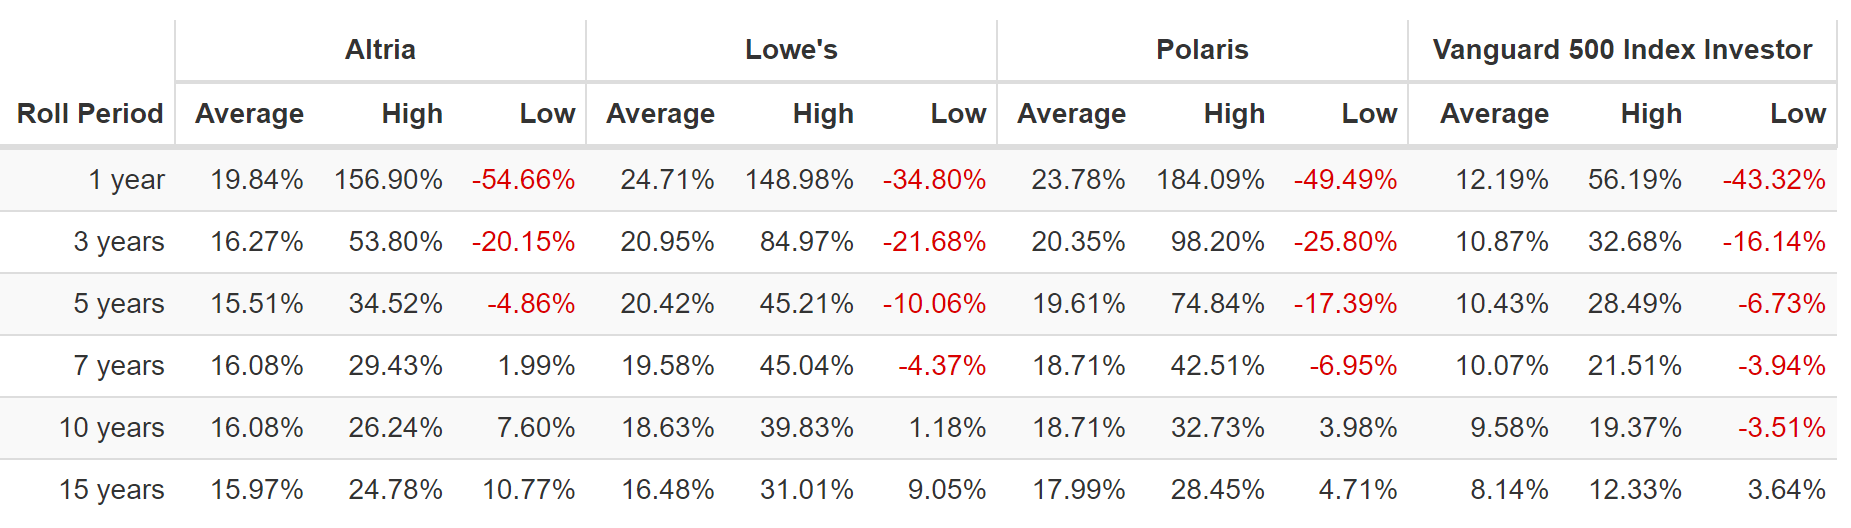
Would you like to earn 5X the market’s yield…safely? Who wouldn’t!? And Altria offers just that because its 40% historically undervalued.
- the last time MO was this undervalued it delivered 25% annual returns for the next 15 years
- 28X return in 15 years
Do you want to own the fastest-growing dividend king in the world? Lowe’s offers just that, at a 36% historical discount, just over 10X cash-adjusted earnings.
Or how about an anti-bubble Ultra SWAN dividend champion like Polaris, which is priced at just 7.5X cash-adjusted earnings.
- priced for -2% long-term growth according to the Graham/Dodd fair value formula
- analyst expect 15% long-term growth
- management guidance is 10+%
Each of these aristocrats is a proven income and wealth compounded par excellence. And thanks to this bear market each one is 36% to 40% undervalued, an Ultra Value screaming buy for anyone comfortable with their risk profiles and who owns them as part of a diversified and prudently risk-managed portfolio.
Be greedy when others are fearful and fearful when others are greedy.” – Warren Buffett
Everyone SAYS they want to be greedy when others are fearful. But guess what? The reason Buffett is Buffett and the rest of us are not, is because that’s easier said than done.
The concept of a margin of safety isn’t that all risk is eliminated. Not even AAA-rated JNJ and MSFT are risk-free.
- AAA-credit rating = 0.07% 30-year bankruptcy risk
- a 1 in 1,429 chance of losing all your money
A margin of safety compensates you for everything that can and WILL go wrong with a company in the future. No company has ever made investors a penny in profit because nothing ever went wrong, but despite something always going wrong.
Whether that be regulatory setbacks, recessions, wars, supply chain snafus, pandemics, energy shocks, or just plain ordinary industry competition, you never knowingly overpay for a company because when you do you are pricing in nothing bad ever happening again.
But when the market hates a company for long enough? Despite objectively good to excellent fundamentals? Well, then you get aristocrat deep value discount to extreme that buy and hold dividend investors can…and have earned Buffett-like returns.
Not from some speculative non-profitable tech start-up, not from a SPAC, not from the newest crypto craze, but from the world’s most dependable dividend growth names.
If you’re tired of praying for luck on Wall Street, then maybe it’s time to make your own.
Luck is what happens when preparation meets opportunity.” – Seneca the Younger
Don’t get me wrong, the reason that value investing isn’t as easy or popular as momentum investing is that it can take YEARS for bear markets to end.
If you’re unwilling to own a company for 10 years, don’t even think about owning it for 10 minutes.” – Warren Buffett
How long is long-term? A lot longer than you might think.
| Time Frame (Years) |
Total Returns Explained By Fundamentals/Valuations |
| 1 Day | 0.01% |
| 1 month | 0.25% |
| 3 month | 0.75% |
| 6 months | 1.5% |
| 1 | 3% |
| 2 | 6% |
| 3 | 23% |
| 4 | 31% |
| 5 | 39% |
| 6 | 47% |
| 7 | 55% (medium-term) |
| 8 | 62% |
| 9 | 70% |
| 10 | 78% |
| 11+ | 90% to 91% (long-term) |
| 30+ | 97% |
(Sources: JPMorgan, Fidelity)
Anything under 7 years is statistically short-term. Guess how long the longest blue-chip bear markets last? About seven years.
Guess how long “long-term is”? A decade or longer.
If you buy an undervalued blue-chip, even the world’s greatest companies, they can keep falling, and or stay depressed for YEARS.
Safety and quality have nothing to do with short-term share price. They are measures of quality and fundamental risk.
Those fundamentals determine the safety of the dividend and your savings in those shares. And I can say with very high confidence that MO, LOW, and PII are not value traps, with cratering fundamentals that risk becoming the next GE.
They are three of the world’s best companies, with strong balance sheets, sound growth prospects, and valuations that are simply too cheap to ignore.
Could they fall lower in a bear market? Sure, if the S&P 500 falls another 25% as many economists expect, I’d be surprised if they didn’t fall a bit more.
But let me ask you this, what would you regret more? Failing to buy these amazing aristocrats and dividend kings at the precise bottom? Or not buying them at all because they bottom faster than you expected?
- in the tech crash, Amazon (AMZN) bottomed in January 2002 and had nearly doubled by the time the market bottomed in October
- During the Great Recession, Altria bottomed in November 2008 (at a 15% very safe yield) five months before the rest of the market
Imagine during the Great Recession seeing Altria at a 15% yield, the highest since the Great Depression. Buy a safe 15% yield that grows 5% over time and you’ll earn Buffett-like 20% returns for years or even decades to come.
- assuming no changes in valuation…ever
Today MO doesn’t yield 15%, because the economy isn’t in tatters. But it does yield 9.1% factoring in the August dividend hike and similarly LOW and PII are trading at valuations literally not seen outside of recessionary bear markets.
If you insist on timing the market, and trying to nail the exact bottom, this is what you’re doing.
- risking not locking in this incredible income and return potential
- in order to try to scalp an extra 10% to 15% higher returns…over 30 years.
- in exchange for 0.2% to 0.3% higher annual returns that MIGHT happen, you risk missing out on gains of several hundred or several thousand percent
I can’t tell you when MO, LOW, or PII will bottom, but I can almost guarantee it will surprise most investors.
I never buy at the bottom, and I always sell too soon.” – Lord Baron Rothschild
The Pandemic crash didn’t bottom because of good economic news, and the Great Recession bottom wasn’t caused by anything other than investors no longer selling on bad news.
No one can know when the market has finished pricing in all the bad news that temporarily makes the world’s greatest companies into deep value bargains.
And to paraphrase Casablanca:
If these aristocrat bargains leave the ground and you haven’t bought some, you’ll regret it. Maybe not today, maybe not tomorrow, but soon and for the rest of your life.”
Be the first to comment