

Ridofranz
Co-produced with PendragonY
So far this year, the market stumbled some and then dropped into a full-on bear market. The S&P 500 is down over 20% before recovering recently to only a 12% price drop. For retirees and investors, this poses a problem, as they can’t rely on cashing in on capital gains to help cover their expenses.
YCharts
With The Income Method, we invest in securities that generate immediate income. Before an investor retires and needs this income, this income stream provides the cash to grow the portfolio. And the new shares purchased provide yet more income to buy more income-producing shares. This reinvestment cycle compounds to speed the growth of the portfolio and the income it generates. Once an investor retires, the income from the portfolio provides the cash to cover expenses. Their portfolio provides more cash than required to cover expenses, so there is cash left over to grow the portfolio to offset inflation. A CEF (closed-end fund) that pays out a reliable stream of income fits very nicely into this strategy. Let’s look at three funds that can be expected to pay out a generous and reliable income stream in these uncertain times.
Pick #1: RQI – Yield 6.2%
We’ll start with Cohen & Steers Quality Income Realty Fund (RQI), which has approximately 200 holdings with a reasonable yield of approximately 6.3%. RQI invests in real estate, particularly real estate investment trusts (“REITs”), that generate money from leases. REITs and real estate, in general, generate a stable and inflation-protected cash flow. (Source: Fact Sheet)
Fact Sheet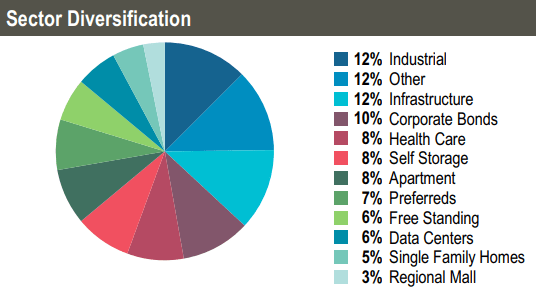
Of note given the troubles this sector has experienced over the last few years, malls and shopping centers combine for less than 5% of the portfolio. Fixed income can provide both ballast and stable income, and that is what RQI gets from its 10% exposure to corporate bonds and 7% exposure to preferred shares. Leverage is currently at a modest 25% level.
Fact Sheet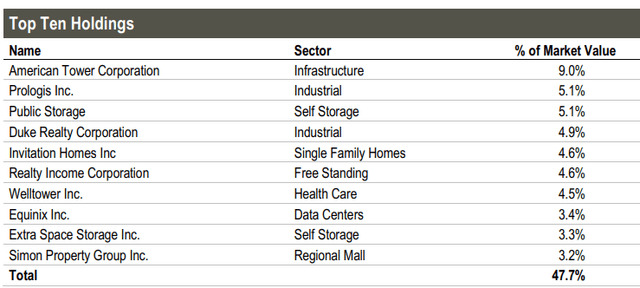
REITs make money by owning real estate that they then rent out to tenants. Because people and businesses tend to pay their rent even in hard times, leases on real estate provide a fairly stable income stream. Rent is usually the last expense to be shorted. Rent has significant weight in determining inflation, and so is inflation protected. Looking at the latest inflation report, rent (for consumers) saw a 5.5% increase from last year. Outside of the consumer housing market, leases typically have year-over-year rent escalators. Many REITs use escalators tied to inflation, so those will be boosting rent payments in the coming months, which will provide more cash flow to the REITs in RQI’s portfolio.
RQI has not cut the distribution over the last 10 years. Even better, it has had several distribution increases, with the most recent increase in 2015. In October of 2016, RQI switched from a quarterly distribution of 24 cents to a monthly distribution of 8 cents.
YCharts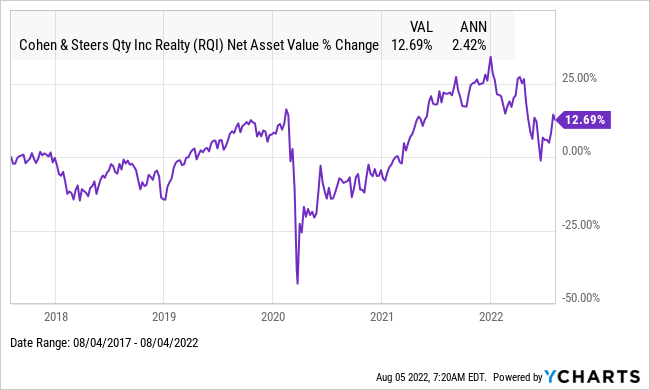
NAV has generally been increasing over the years, so the small amounts of ROC in the distribution have not been destructive. This year, the distributions have been covered 60/40 by a mix of long- and short-term capital gains. RQI navigated the last recession with only a short-lived reduction in the distribution, so the current distribution looks reasonably safe. Given the generous yield of 6.2%, the almost 16% drop in share price since the start of the year looks to offer a good entry point.
Pick #2: UTG – Yield 7.0%
Reaves Utility Income Fund (UTG) is a superstar CEF that has stood the test of time since its inception in 2004. The utility sector experiences inelastic demand and generates predictably consistent earnings through difficult economic conditions. This is because the individual demand for utilities (electricity, water, waste collection, gas, internet, wireless telecom services, etc.) stays relatively stable even during poor economic times. Furthermore, population increases will increase the aggregate demand.
YCharts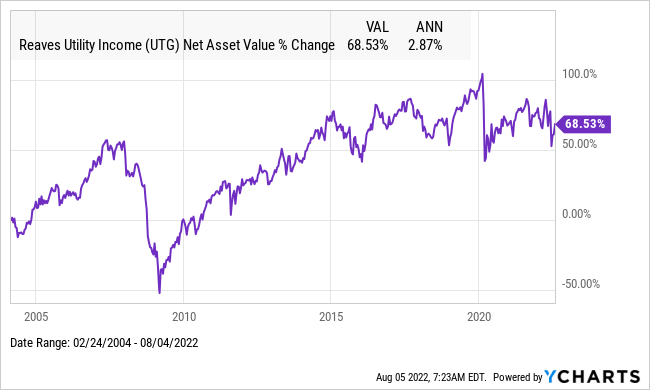
UTG has demonstrated an impressive ~68% increase in NAV, with no distribution cuts since its inception on February 24th, 2004. While the 2.8% CAGR increase in NAV doesn’t sound impressive, it does show the reliability of the income this fund generates. By regularly increasing NAV, it regularly increases its ability to generate cash to pay its shareholders. That is why UTG has such a reliable distribution record. For a CEF, NAV can only increase if the fund generates more cash than it pays out in distributions. The CEF has also paid the occasional special dividend over the years as a further sign that it is reliably generating cash to fully cover its distributions.
UTG trades a small premium to NAV that is currently less than 1%. UTG is modestly leveraged at ~17% and comes at a reasonably modest 1.2% expense ratio. This low leverage reduces the negative impact of any further price declines while also positioning the fund to increase leverage once prices begin to recover. The CEF maintains a portfolio of 41 securities that are some of the most defensive names in the market.
UTG Fact Sheet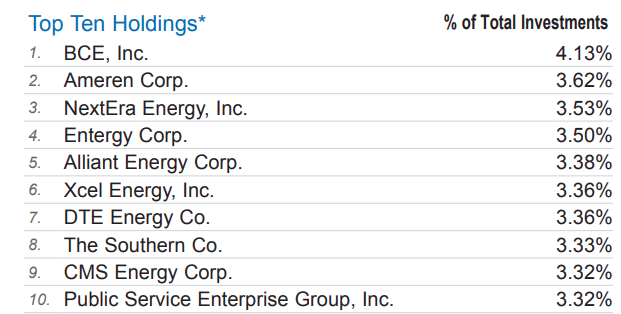
UTG pays a distribution of $0.19/month. That generates a current yield of 7.0%. Distributions since inception have nearly doubled, starting at 9.67 cents a month to the current payment of 19 cents a month. UTG is a great fit for investors looking for high safe income that grows some over time. All distributions have been sourced from NII and capital gains (both long and short). Return of Capital (‘ROC’) has not been used to cover the distribution at any time since inception.
Fear of the impact of higher interest rates and higher inflation is depressing prices. But remember, this is a cost that utilities will be able to recover, so you can use this fear and the lower prices it is generating to boost your income with a solid and relatively safe CEF. This makes for a good entry point into UTG.
Pick #3: PTY – Yield 10.2%
PIMCO is one of the top managers of fixed-income funds, and PIMCO Corporate & Income Opportunity Fund (PTY) is one of its top CEFs. The fund’s portfolio is composed of a mixture of various debt investments with small amounts of preferred shares and common stock. Its debt investments include corporate bonds (nearly half the portfolio), senior floating rate loans, non-Agency MBS, and other asset-backed securities.
data source: PIMCO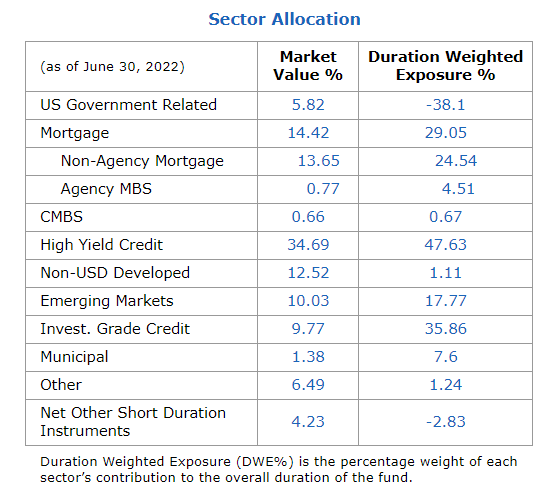
As is to be expected when interest rates are increasing, the NAV (and share price too) of PTY has been decreasing. Investors often have difficulty grasping that rising bond prices often work poorly for bond investors while falling bond prices often work better. Investors are trained to automatically think that rising prices are better than falling prices. But for a bond fund, this “common sense” is wrong. Paying more to replace maturing assets means less income for the fund. Falling prices mean that as bonds (and other debt) mature the fund can replace that income at a lower cost and thus generate more income. And we hold CEFs to get the income stream.
And that is exactly what has been happening with PTY. Back in January, PTY generated NII (Net Investment Income) for the month that exceeded the distribution it paid in January by just 3 cents per share. In June (the latest month reported), the NII exceeded the distribution paid out by 7 cents. This increase in income was such that the distribution coverage for the previous 6 months went from 114% to 138%. So despite being in a period that many think is bad for bonds, PTY increased the safety of its distribution. (Source: PIMCO UNII Report)
PTY UNII Report (PIMCO)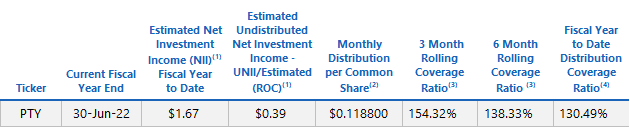
This improved distribution coverage is good for several reasons. First, improved coverage makes the current distribution that much safer, and given the uncertainty in the market, economy, and the world in general, more safety is always better. Second, CEFs have a requirement to pay out most of their NII to shareholders. So with the YTD coverage ratio now at 130.5%, the chance that PTY will increase the distribution or pay out a special distribution has increased.
Finally, while we like PTY primarily as an income investment, over its existence it has proven to be a pretty good investment for total returns as well. Since its inception in December of 2002, PTY has had total returns with a CARG of 11.58%. That compares to the S&P 500, which has only had a CAGR of 10.29%. That is very good long-term total return results for a fund that is currently yielding 10.2%.
YCharts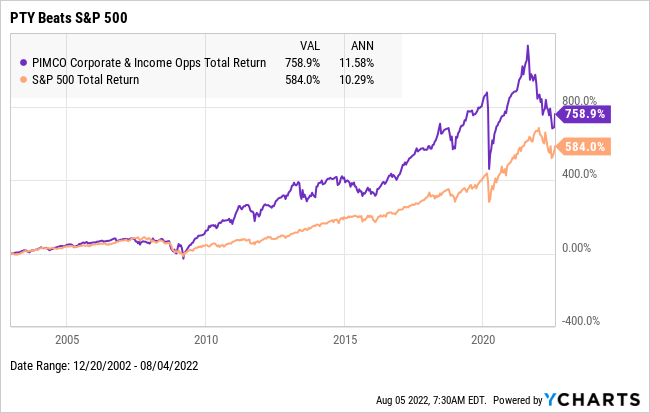
Conclusion
The Income Method does not depend on selling shares to pay expenses. So, in times when the market is likely to see decreasing share prices, it can offer investors a level of certainty that methods that do rely on selling shares can’t offer. With increasing inflation, increasing interest rates, and the uncertainty over how much higher both interest rates and inflation will go, The Income Method offers a steady flow of cash to cover one’s expenses.
CEFs, particularly when they have a well-covered distribution, can be an important piece in a strategy to generate immediate income. PTY, UTG, and RQI all have well-covered distributions and are trading at very good values. While these three funds won’t be an entire portfolio, they can make up a good part of the core of any income portfolio.
This means your retirement can move beyond from “how will I ever afford to pay my bills?” and on to “Do I want both the Steak and the Lobster?”
Live a retirement covered by an overabundance of income and an exceptional lack of stress. That’s my goal for you! Income investing is a key means in my view to achieve it.
Be the first to comment