

Willie B. Thomas/DigitalVision via Getty Images
By Daniel Prince, CFA
Key Takeaways
- Staying the course isn’t easy in times like these, but history shows making a plan and sticking to it could be critical to long-term investing success.
- Even missing just a few of the market’s best days can make a huge difference in your long-term returns.
- Keeping close tabs on management fees and minimizing taxes can also be big drivers of investing performance.
- The iShares Core ETF suite can help investors pursue their long-term goals, no matter the market climate.
Ten years ago, I was single, living in a one-bedroom apartment and very focused on my next trip to the mountains. Life today is quite different, with my focus split between my partner, our children, and the ups and downs of homeownership. Just as “adulting” was a life goal 10 years ago, so was the long-term performance of my investments.
As our iShares Core franchise marks its ten-year anniversary, here are three of the top lessons I’ve learned in the past decade of investing (and life).
Make A Plan And Stick With It
It is important to create a game plan for reaching your financial goals. As baseball legend and folk wisdom sage Yogi Berra, once said: “If you don’t know where you are going, you might end up someplace else.”
Building an investment plan early, and sticking to it over the long term, has helped me. But staying the course has not always been easy. Market noise is hard to ignore, especially as inflation and falling stock prices have dominated headlines in 2022. But think about this: The S&P 500 has experienced an average intra-year drop of nearly 15% in the past 20 years yet delivered positive annual returns in 15 of those years.1 (Figure 1)
Figure 1: Despite ending up in most years, the S&P 500 has averaged a double-digit intra-year decline in each of the last 20 years
Index performance does not reflect any management fees, transaction costs or expenses. Indexes are unmanaged and one cannot invest directly in an index. Index performance does not represent actual iShares Fund performance. Past performance does not guarantee future results. Chart description: Bar chart showing the S&P 500’s annual performance from 2002-2021 as well as its intra-year declines. (Morningstar. Calendar year returns for period 2002 to 2021. Intra-year drawdowns represent the peak to trough decline within each calendar year.)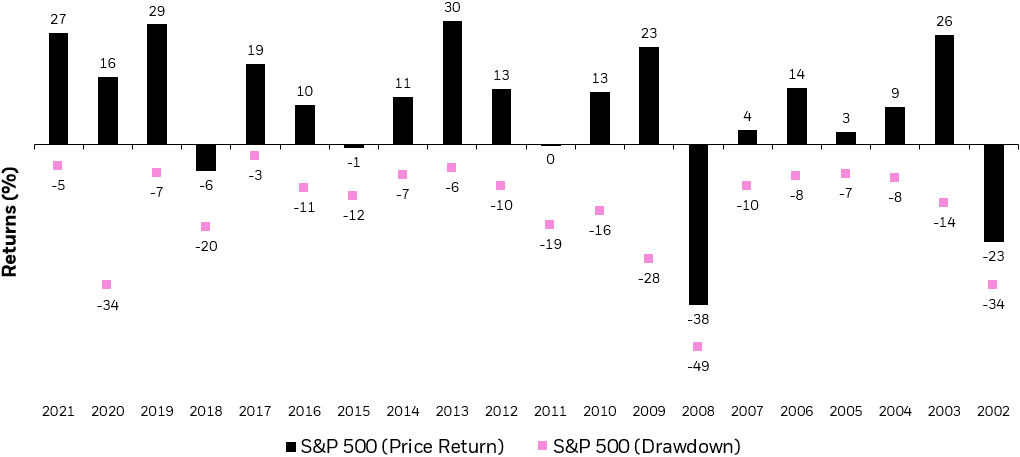
The Best Days Make All The Difference
Investors may find it difficult to stick to their financial plans while staring at a double-digit decline but staying invested is critical to long-term performance. After all, some of the worst days in the market can occur in close proximity to the best days.2
Over the past 20 years, an investor who maintained exposure to the S&P 500 would have significantly outperformed an investor who sat out just the best five days of U.S. equity market performance.3 The difference would have been approximately $20,500 on an initial $10,000 investment (Figure 2).4
Figure 2: Hypothetical $10,000 investment in the S&P 500 index over the 20 years ending 6/30/2022
Growth of 10k
Index performance is for illustrative purposes only. Index performance does not reflect any management fees, transaction costs or expenses. Indexes are unmanaged and one cannot invest directly in an index. Past performance does not guarantee future results. Index performance does not represent actual iShares Fund performance. Chart description: Chart showing the difference in performance of a hypothetical $10,000 investment in the S&P 500 from 2002-June 2022 when staying invested vs. missing the index’s best five or 20 days. (BlackRock and Morningstar. Data covers period 12/31/1989 to 12/31/2021. Using total return which assumes the reinvestment of dividends or capital gains, no fees were deducted.)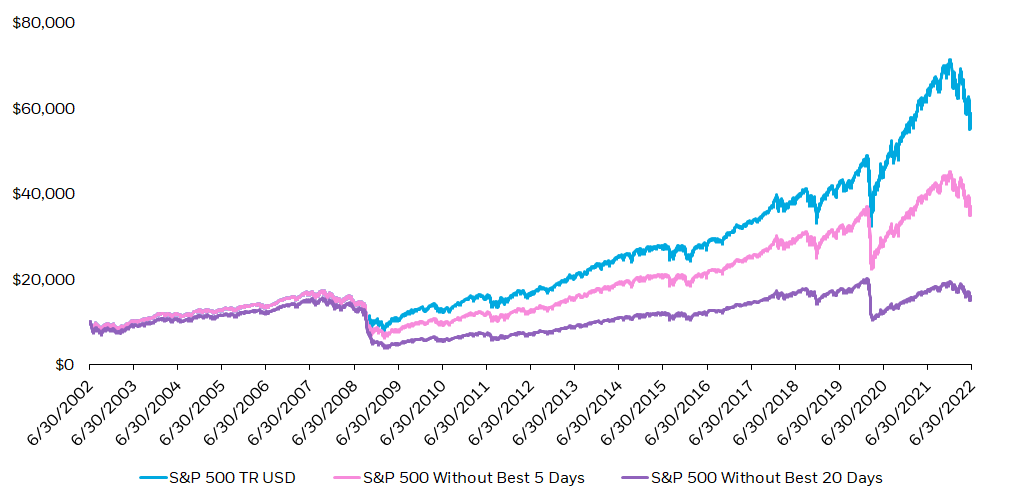
Watch Fees And Focus On Keeping More Of What You Earn
When it comes to expense ratios, you get what you don’t pay for.
Our flagship Core U.S. Equity ETFs, IVV, IJH, and IJR have outperformed their peers over 10 years and lower fees have played a part in that.5 Lower expense ratios mean lower hurdles for investors looking to reach their goals. These three ETFs are at parity with or cheaper than 98% of their actively managed counterparts.6 Over the past ten years, we’ve added value for investors by lowering fees across our Core platform more than 20 times; as a result, we’ve saved investors more than $237 million.7
Our commitment to lowering expenses and providing investors a full complement of options continues as the iShares Core ETF portfolio enters its second decade. On October 24, 2022, we announced a management fee reduction for the iShares U.S. Dividend and Buyback ETF (DIVB) and renamed it to the iShares Core Dividend ETF. DIVB is now part of the iShares Core ETF franchise and is the lowest-cost dividend ETF in the U.S.8
Our U.S. listed Core ETFs’ AUM have grown as our costs have fallen
Chart showing the downward trajectory of fees on the suite of iShares Core ETFs juxtaposed by the simultaneous increase in their assets under management. (BlackRock, as of Aug. 31, 2022.)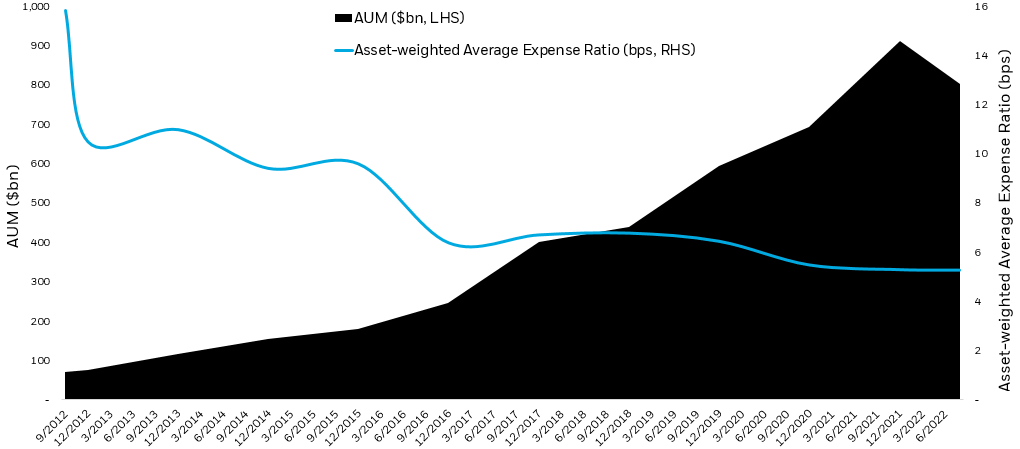
While the flagship iShares U.S. Core Equity ETFs have exhibited strong pre-tax performance, after-tax performance is what matters most – it’s what you keep. While often overlooked, tax costs can matter more than fees: in 2021, the tax costs of the average active U.S. equity mutual fund were more than double the expense ratio.9
Our Core ETFs seek to track broad market benchmarks, which means they trade less frequently than most active strategies, historically resulting in fewer capital gains distributions than most active funds. In addition, ETFs generally don’t need to sell securities to raise cash to meet redemptions. Whereas 90% of active U.S. equity funds made a capital gains distribution in 2021, none of our Core equity ETFs have distributed capital gains in any year from 2017-2021.10
Conclusion
For many investors, creating a long-term plan starts with determining an asset allocation, or the mix of stocks and bonds that provides the balance of growth and safety aligned with their goals. Our lineup of Core ETFs may enable investors to put their plans to work in a convenient and simple way. Using just a handful of tickers, you can create a low-cost, diversified portfolio tailored to your specific goals and objectives.
iShares launched the Core suite of ETFs 10 years ago and has since expanded the offering to provide investors with building blocks for a diversified portfolio. Over the last 10 years, iShares Core ETFs have offered competitive performance while keeping cost and taxes low.11 Investors have taken notice, and we’ve seen assets grow more than tenfold over this period.12
We believe playing the long game is critical to successful investing. Maintaining a long-term mindset is key to helping investors create value, especially during turbulent market times. Consider iShares Core ETFs as a way to establish a foundation of a thoughtful investment plan.
© 2022 BlackRock, Inc. All rights reserved.
1 Source: Morningstar. U.S. stock market measured by the S&P 500 index, using calendar years ending on 12/31.
2 Source: Morningstar and CNBC.com. Data as of 9/30/2022. The S&P 500 experienced two of its best days in the past 30 years during the COVID-19 selloff in March 2020, in which the index fell over 30% in 22 trading days; Seven of the S&P 500’s highest single-day returns in the past 30 years occurred during the 2007-2009 global financial crisis, during which the index fell for six consecutive quarters and lost 48% of its value.
3 Source: BlackRock and Morningstar. Data covers period 12/31/1989 to 12/31/2021.
4 Source: BlackRock and Morningstar. Data covers period 12/31/1989 to 12/31/2021.
5 Source: Morningstar, as of 9/30/2022. Comparison universe is ETFs and mutual funds in the Morningstar category and uses total return. IVV, IJH, and IJR outperformed 86%, 71% and 94% of their respective ETF and mutual fund peers over the last ten years. They outperformed 59%, 57% and 52% of funds in their respective categories over the last one year, and outperformed 80%, 56%, and 72% of the funds in their categories over the last five years. The category and comprising number of funds for IVV is US Fund Large Blend (1 year: 1,366 funds, 5 year: 1,118 funds, 10 year: 820 funds), for IJH is US Fund Mid-Cap Blend (1 year: 411 funds, 5 year: 335 funds, 10 year: 218), and for IJR is US Fund Small Blend (1 year: 607 funds, 5 year: 536 funds, 10 year: 356 funds). Performance may be different for other time periods. Past performance is no guarantee of future results. For more information on the differences between ETFs and mutual funds, click here.
6 Source: Morningstar Direct. As of 09/30/2022.
7 Source: BlackRock. Cumulative cost-savings figure is calculated by taking the difference between the previous fund expense ratio and the new fund expense ratio from Oct. 2012 through Sept. 2022, multiplied by the fund assets under management at the time of the fund reduction. Methodology does not account for compounding savings over time.
8 Source: BlackRock, Morningstar, as of 9/30/22. Dividend ETFs are defined as funds seeking to provide exposure to companies that pay dividends. DIVB has a lower expense ratio than any other US listed dividend ETF.
9 Source: Morningstar. As of Dec. 31, 2021. The average annual tax cost for active U.S. large-cap mutual funds was 2.09% for the 10 years ending in 2021, more than double their average annual expense ratio of 0.85%. Tax Cost measures how much a fund’s annualized return is reduced by the taxes investors pay on distributions (Difference between total annualized pre and post-tax returns over 10 years.) Data calculated using the oldest share class of all Active US large cap Equity Open-End Mutual Funds available in the U.S.
10 Source: Morningstar, as of 12/31/21. Average from 2017-2021. Comparison universe includes all open-end mutual funds under the classification of US Equity Size and Style across total, large-, mid-, and small-cap market segments that incepted on or before 10/31 of each year and excludes any funds that closed on or before 10/31 of each year. No iShares Core Equity ETF paid a capital gain since they were introduced into the Core suite of ETFs. For a full list of iShares Core Equity ETFs, click here.
11 Source: Morningstar as of 6/30/2022. iShares Core ETFs outperformed 63% of their mutual fund and ETF peers over the last 10 years. Comparison universe is ETFs and mutual funds in the Morningstar category and uses total return. Overall figure is a weighted average of the percentage of funds that the iShares Core equity ETFs outperformed in the Morningstar category, weighted based on the number of funds in the Morningstar category. Performance may be different for other time periods. Past performance does not guarantee future results.
12 Source: BlackRock, as of October 21, 2022.. Assets in iShares Core-series ETFs grew from approximately $74bn in Oct. 2012 to approximately $800bn in Oct. 2022.
Carefully consider the Funds’ investment objectives, risk factors, and charges and expenses before investing. This and other information can be found in the Funds’ prospectuses or, if available, the summary prospectuses, which may be obtained by visiting the iShares Fund and BlackRock Fund prospectus pages. Read the prospectus carefully before investing.
Investing involves risk, including possible loss of principal.
Small-capitalization companies may be less stable and more susceptible to adverse developments, and their securities may be more volatile and less liquid than larger capitalization companies.
There is no guarantee that dividends will be paid.
Diversification and asset allocation may not protect against market risk or loss of principal.
Transactions in shares of ETFs may result in brokerage commissions and will generate tax consequences. All regulated investment companies are obliged to distribute portfolio gains to shareholders.
ETFs are obliged to distribute portfolio gains to shareholders by year-end. These gains may be generated due to index rebalancing or to meet diversification requirements. Trading shares of ETFs may also generate tax consequences and transaction expenses.
Certain traditional mutual funds can also be tax efficient.
The strategies discussed are strictly for illustrative and educational purposes and are not a recommendation, offer or solicitation to buy or sell any securities or to adopt any investment strategy. There is no guarantee that any strategies discussed will be effective.
The information presented does not take into consideration commissions, tax implications, or other transactions costs, which may significantly affect the economic consequences of a given strategy or investment decision.
This material contains general information only and does not take into account an individual’s financial circumstances. This information should not be relied upon as a primary basis for an investment decision. Rather, an assessment should be made as to whether the information is appropriate in individual circumstances and consideration should be given to talking to a financial professional before making an investment decision.
The information provided is not intended to be tax advice. Investors should be urged to consult their tax professionals or financial professionals for more information regarding their specific tax situations.
Prepared by BlackRock Investments, LLC, member FINRA.
The iShares Funds are not sponsored, endorsed, issued, sold or promoted by Bloomberg, BlackRock Index Services, LLC, Cohen & Steers, European Public Real Estate Association (“EPRA®”), FTSE International Limited (“FTSE”), ICE Data Indices, LLC, NSE Indices Ltd, JPMorgan, JPX Group, London Stock Exchange Group (“LSEG”), MSCI Inc., Markit Indices Limited, Morningstar, Inc., Nasdaq, Inc., National Association of Real Estate Investment Trusts (“NAREIT”), Nikkei, Inc., Russell or S&P Dow Jones Indices LLC or STOXX Ltd. None of these companies make any representation regarding the advisability of investing in the Funds. With the exception of BlackRock Index Services, LLC, which is an affiliate, BlackRock Investments, LLC is not affiliated with the companies listed above.
Neither FTSE, LSEG, nor NAREIT makes any warranty regarding the FTSE Nareit Equity REITS Index, FTSE Nareit All Residential Capped Index or FTSE Nareit All Mortgage Capped Index. Neither FTSE, EPRA, LSEG, nor NAREIT makes any warranty regarding the FTSE EPRA Nareit Developed ex-U.S. Index or FTSE EPRA Nareit Global REITs Index. “FTSE®” is a trademark of London Stock Exchange Group companies and is used by FTSE under license.
© 2022 BlackRock, Inc. All rights reserved. BLACKROCK, BLACKROCK SOLUTIONS, BUILD ON BLACKROCK, ALADDIN, iSHARES, iBONDS, FACTORSELECT, iTHINKING, iSHARES CONNECT, FUND FRENZY, LIFEPATH, SO WHAT DO I DO WITH MY MONEY, INVESTING FOR A NEW WORLD, BUILT FOR THESE TIMES, the iShares Core Graphic, CoRI and the CoRI logo are trademarks of BlackRock, Inc., or its subsidiaries in the United States and elsewhere. All other marks are the property of their respective owners.
iCRMH1122U/S-2560521
Editor’s Note: The summary bullets for this article were chosen by Seeking Alpha editors.
Be the first to comment