

andresr/iStock via Getty Images
The 2022 bear market began with the worst inflation in 40 years triggering a historic surge in interest rates. Now it’s progressing to worries about a recession in 2023.
Daily Shot 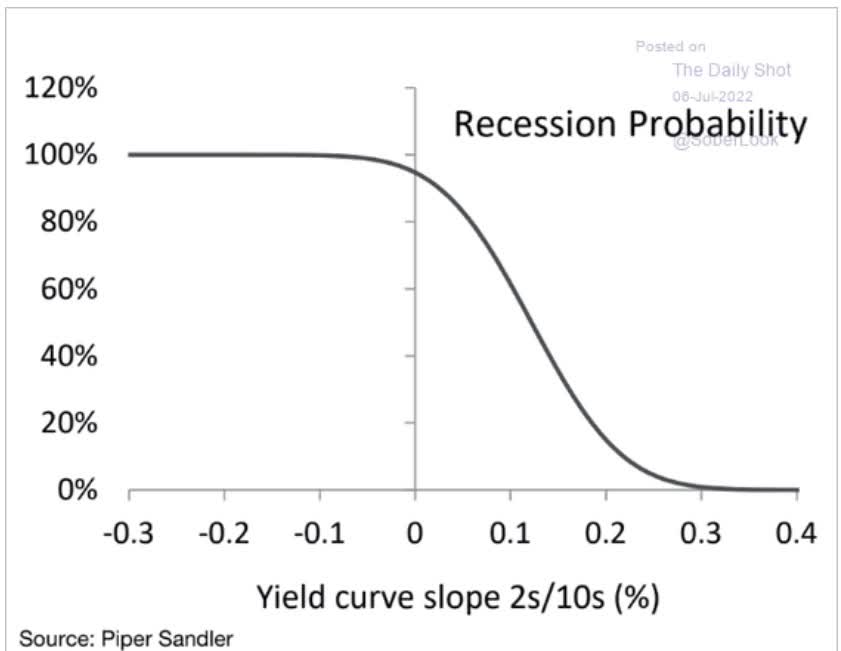
One of the reasons for this is that the 2-10 yield curve is once more inverted, which historically means a near 100% probability of a recession within two years.
Daily Shot 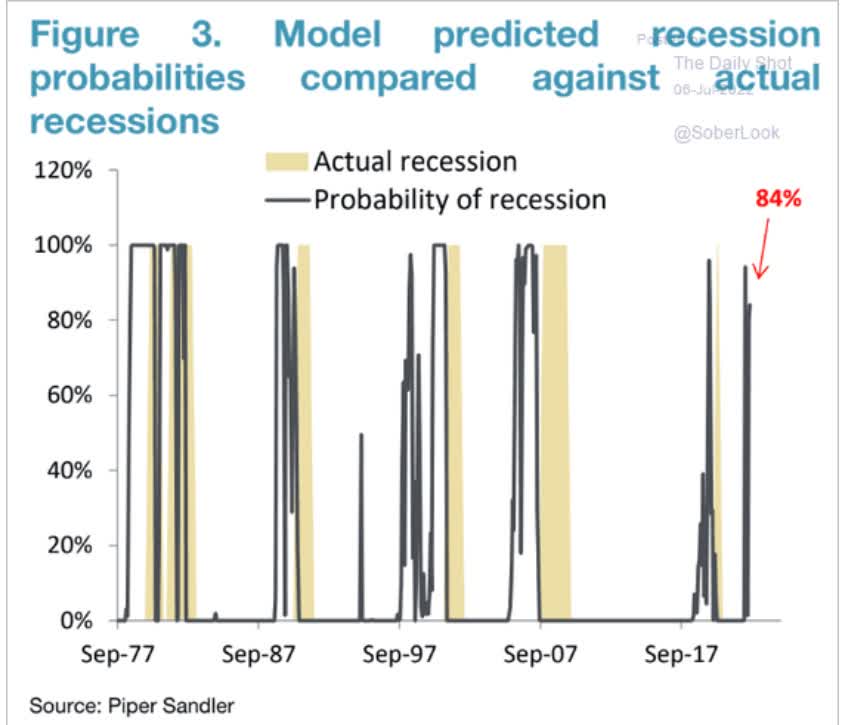
As of July 6th, Piper Sandler’s recession risk model, which is based on the 2-10 curve, estimates an 84% probability of recession.
Cyclical, economically sensitive stocks, such as semiconductor makers, some of the biggest Wall Street darlings of the past two years, have reacted as one might expect when recession risk is elevated.
Ycharts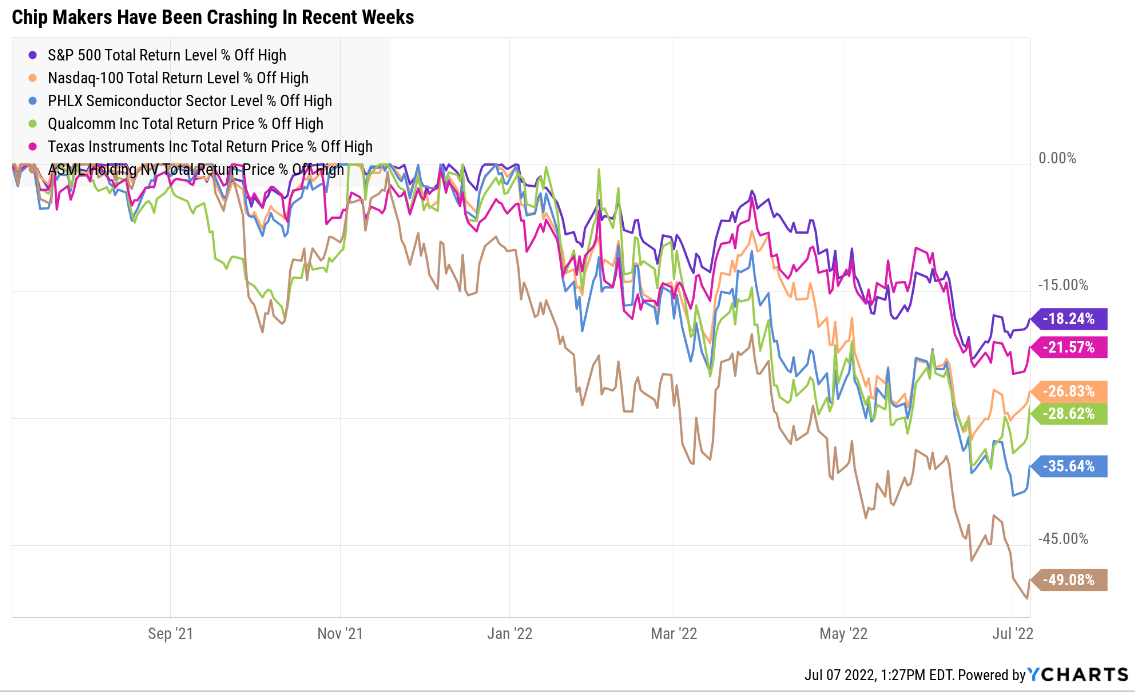
Some of the world’s premier chipmakers, including Texas Instruments (TXN), Qualcomm (QCOM), and ASML Holding (ASML) have seen their prices gutted, in some cases falling into 50% bear markets.
But wait a second? If we are headed for recession couldn’t these Ultra SWAN quality dividend growth legends fall a lot more? Indeed they could, IF we actually get a recession.
Daily Shot 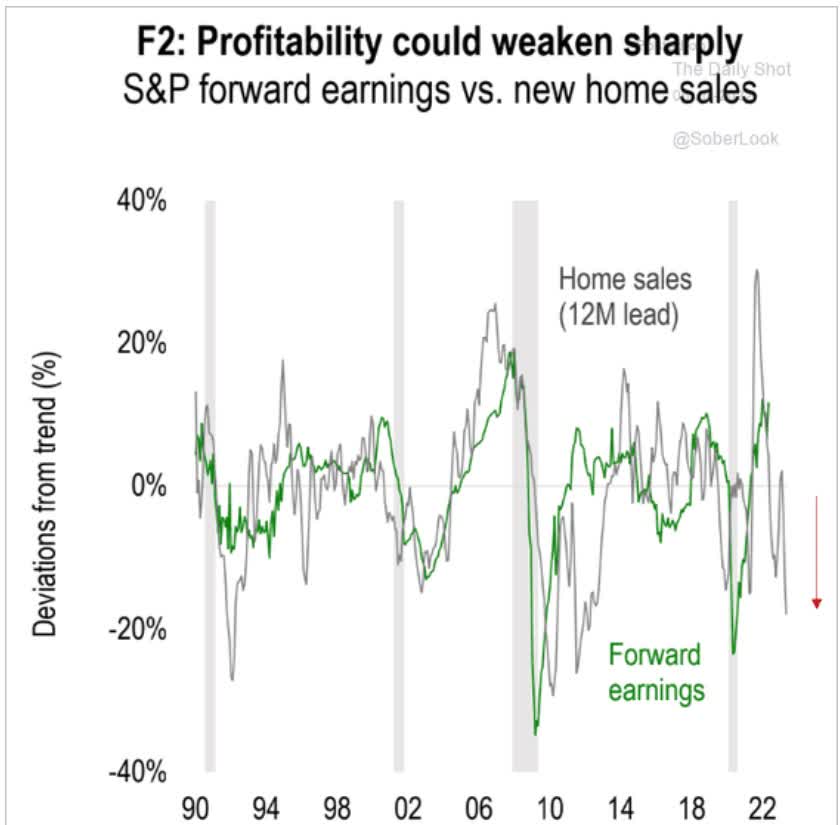
Historically, S&P earnings growth is highly correlated with home sales, with a 12-month lag. Currently, home sales are falling so rapidly that a potential 20% contraction in earnings might be coming by the end of 2023.
This agrees with Morgan Stanley’s model which estimates a 20% EPS contraction if we get even a mild recession, as well as the S&P 500 falling to around 3,000.
- a potential 40% peak decline in this bear market
| Time Frame | Historically Average Bear Market Bottom |
| Non-Recessionary Bear Markets Since 1965 | -21% (Achieved May 20th) |
| Median Recessionary Bear Market Since WWII | -24% (Citigroup base case with a mild recession) June 16th |
| Non-Recessionary Bear Markets Since 1928 | -26% (Goldman Sachs base case with a mild recession) |
| Average Bear Markets Since WWII | -30% (Morgan Stanley base case) |
| Recessionary Bear Markets Since 1965 | -36% (Bank of America recessionary base case) |
| All 140 Bear Markets Since 1792 | -37% |
| Average Recessionary Bear Market Since 1928 |
-40% (Deutsche Bank, Bridgewater, SocGen Severe Recessionary base case, Morgan Stanley Recessionary Base Case) |
|
(Sources: Ben Carlson, Bank of America, Oxford Economics, Goldman Sachs) |
Morgan Stanley is joined by a lot of other blue-chip economist firms, including Deutsche Bank and Societe Generale, in expecting a potential 40% bear market bottom IF we get a recession.
But Wall Street doesn’t run off certainties, just probabilities, and it’s actually possible that the market bottoms a lot higher than many economists, analysts, and investors think.
Ben Carlson 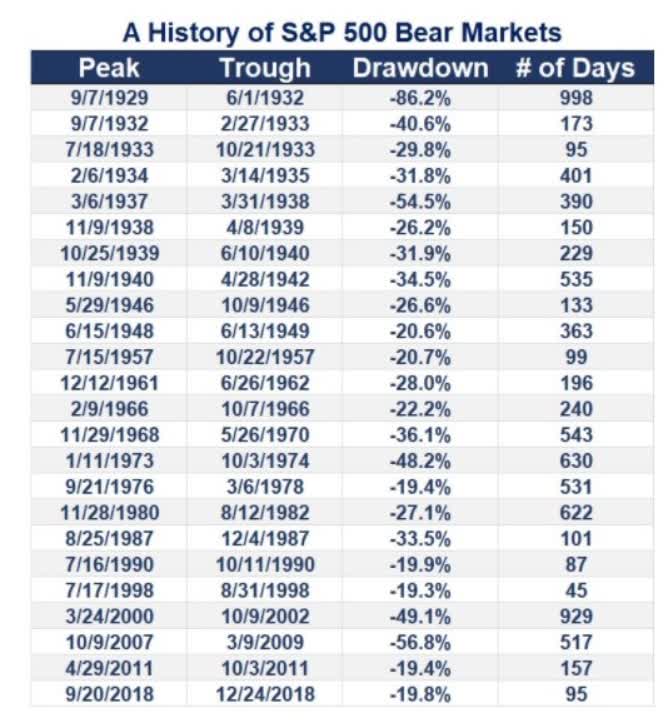
We’re already in a 24.5% peak bear market and as you can see even recessionary bear markets such as 1957, can see stocks fall just 21%.
In 1990, we also fell just 20%, as we did in the recession scares of 2011 and 2018.
How could we potentially avoid a recession when so many warning signs say we are careering towards one or possibly even in one already (the Atlanta Fed’s GDPNow model thinks we are)?
Charlie Bilello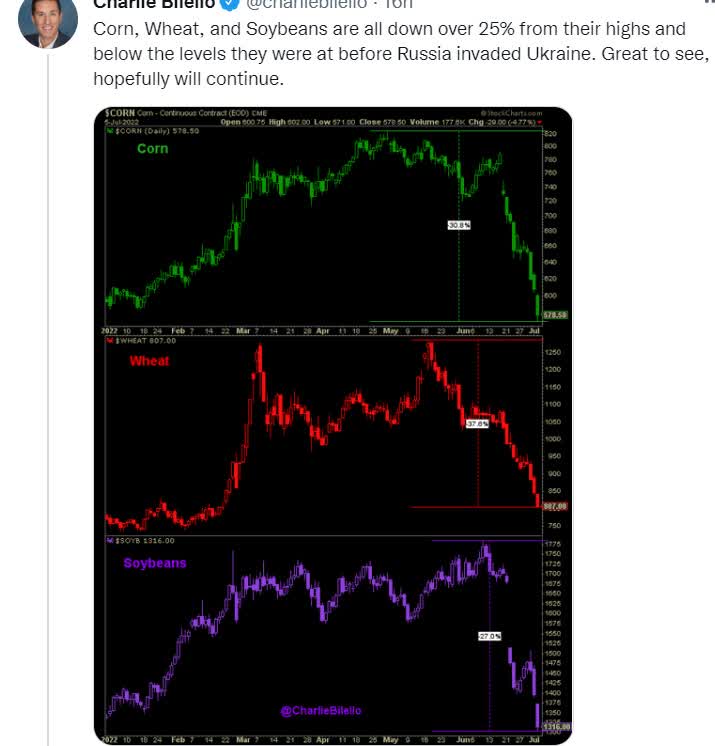
Because commodity prices have started to collapse, which potentially means a peak in inflation arriving months sooner than economists expected just a few weeks ago.
CME Group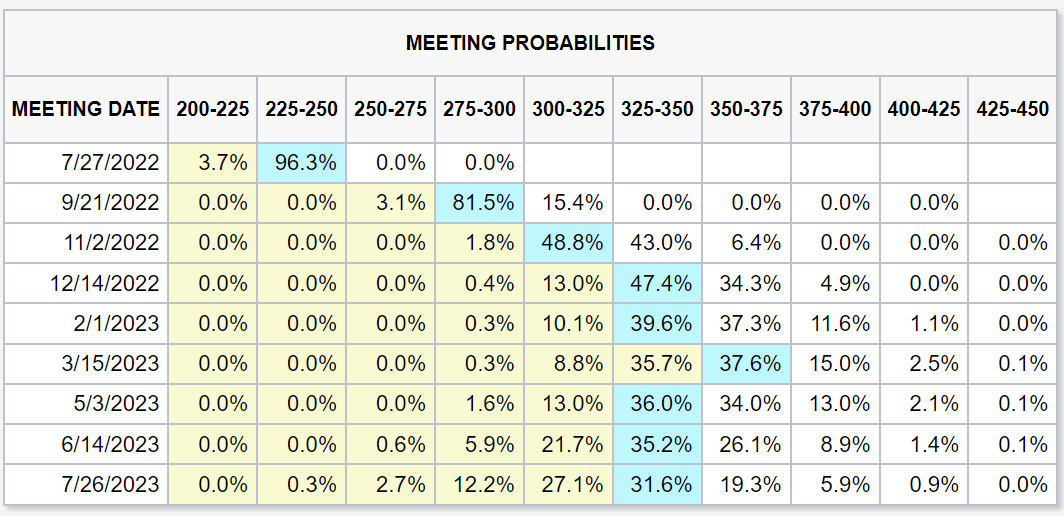
A few weeks ago, after the last shocking CPI report, the bond market was pricing in the Fed hiking all the way to 4% or even 4.25% by July 2023.
That estimate has fallen to a terminal Fed Funds rate forecast of 3.5% by March 2023 and then falling rapidly to 3.25% with the Fed pausing through July.
Obviously, these estimates can and will change as the bond market prices in more data as it comes in.
But Goldman Sachs, Morgan Stanley, Bank of America, and Citigroup all think that the US economy can sustain rates of 3% to 3.5% without triggering a recession (just a major slowdown to around 1% growth).
What might that mean for dividend growth investors? That the market bottoms a lot sooner… and shallower than many are thinking about right now.
And if it does? Well, let me show you three amazing blue-chip dividend growth bargains you might want to buy in this bear market.
Texas Instruments (TXN): One Of The Best-Run Companies On Earth
- Texas Instruments: Playing The Long Game; Buy Now
- a realistic look at TXN’s growth outlook, risk profile, investment thesis, valuation, and total return potential
Reasons To Potentially Buy TXN Today
- 94% quality low-risk 13/13 Ultra SWAN quality chip maker
- 43rd highest quality company on the DK 500 Master List (91st percentile)
- 97% dividend safety score
- 18-year dividend growth streak
- 3.0% very safe yield
- 0.5% average recession dividend cut risk
- 1.2% severe recession dividend cut risk
- 17% historically undervalued (potential strong buy)
- Fair Value: $187.77 (21X earnings)
- 17.7X forward earnings vs 20X to 22X historical
- 13.0X cash-adjusted earnings
- A+ stable outlook credit rating = 0.6% 30-year bankruptcy risk
- 77th industry percentile risk management consensus = Good, bordering on very good
- 6% to 14% CAGR margin-of-error growth consensus range
- 9.0% CAGR median growth consensus
- 5-year consensus total return potential: 6% to 13% CAGR
- base-case 5-year consensus return potential: 11% CAGR (25% more than the S&P consensus)
- consensus 12-month total return forecast: 25%
- Fundamentally Justified 12-Month Returns: 24% CAGR
I love TXN for many reasons but perhaps this one most of all:
Management’s policy is to pay out 100% of free cash flow each year via buybacks and dividends. Free cash flow is what’s left over after running the business and investing in all future growth. It’s the most shareholder-friendly capital allocation policy I’ve ever seen.
TXN 2024 Consensus Total Return Potential
(Source: FAST Graphs, FactSet)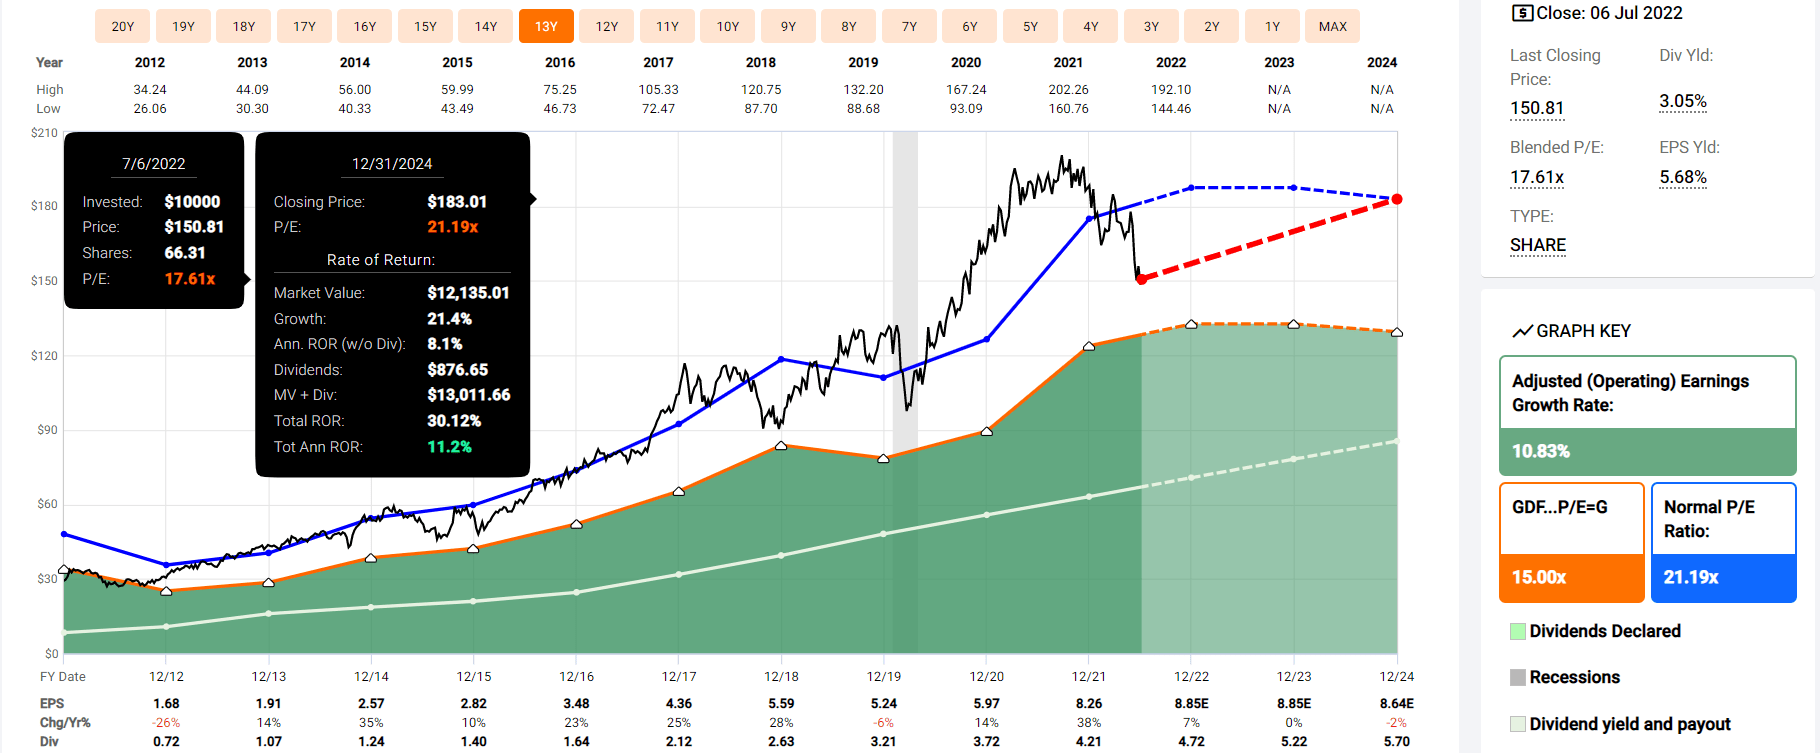
(Source: FAST Graphs, FactSet)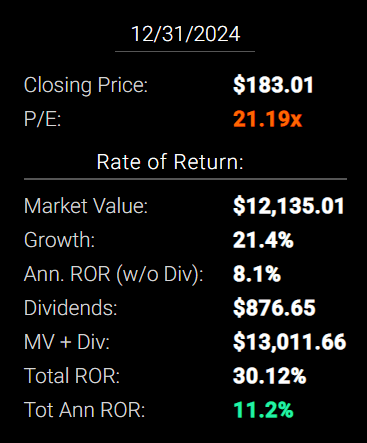
TXN’s short-term return potential isn’t great, because analysts fully expect slowing growth to result in a three-year plateau for the industry.
But if TXN grows as expected and returns to historical fair value by 2024, then investors would still enjoy decent 30% total returns or 11% annually, about 10% more than analysts expect from the S&P 500.
TXN 2027 Consensus Total Return Potential
(Source: FAST Graphs, FactSet)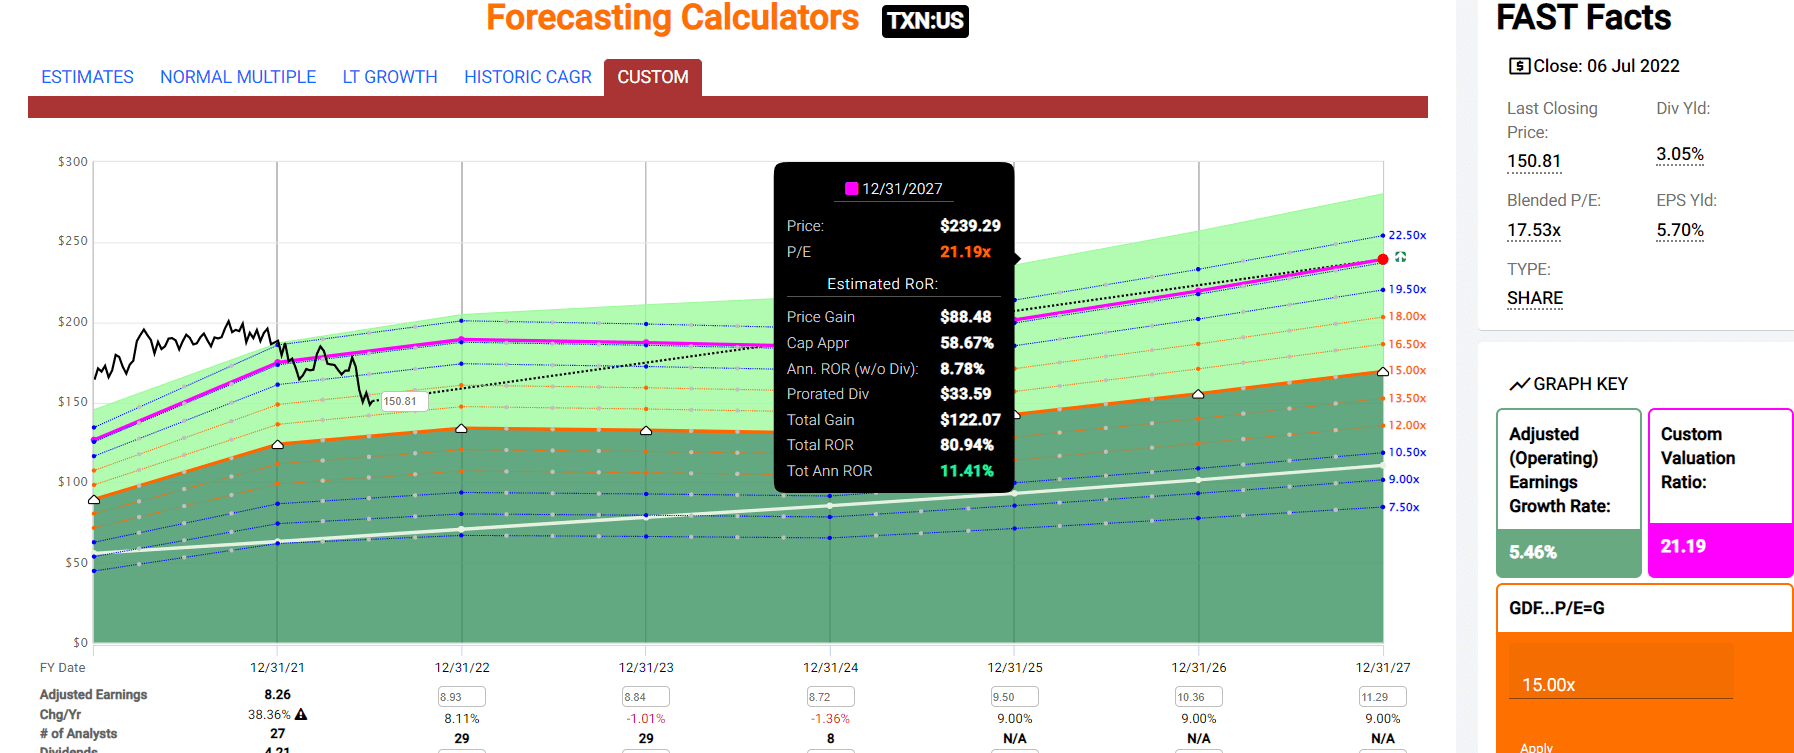
(Source: FAST Graphs, FactSet)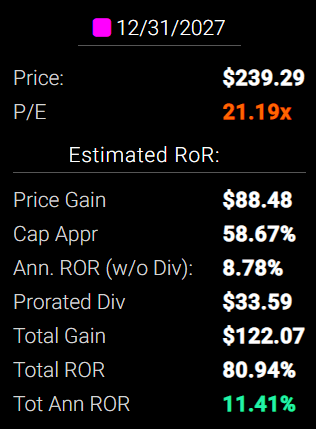
If TXN grows at the modest rate of 5.5% through 2027 as analysts currently expect, factoring in the slowdown of the next few years, then a return to historical fair value generates 81% total returns or 11% annually.
And over the very long-term slightly better returns are currently expected.
| Investment Strategy | Yield | LT Consensus Growth | LT Consensus Total Return Potential | Long-Term Risk-Adjusted Expected Return | Long-Term Inflation And Risk-Adjusted Expected Returns | Years To Double Your Inflation & Risk-Adjusted Wealth |
10-Year Inflation And Risk-Adjusted Expected Return |
| Texas Instruments | 3.0% | 9.00% | 12.0% | 8.4% | 5.9% | 12.1 | 1.78 |
| Dividend Aristocrats | 2.4% | 8.5% | 10.9% | 7.6% | 5.2% | 14.0 | 1.65 |
| S&P 500 | 1.8% | 8.5% | 10.3% | 7.2% | 4.7% | 15.2 | 1.59 |
(Source: Morningstar, FactSet, Ycharts)
12% long-term returns might not seem that impressive but it’s about 1% higher than the dividend aristocrats and 2% more than the S&P 500 are expected to deliver.
That means you can realistically expect to double your money, adjusting for the risk of companies not growing as expected and inflation, every 12 years, compared to 14 years for the aristocrats and 15 years for the S&P 500.
It’s also similar to the historical returns TXN has delivered.
TXN Historical Returns Since April 1985
Portfolio Visualizer Premium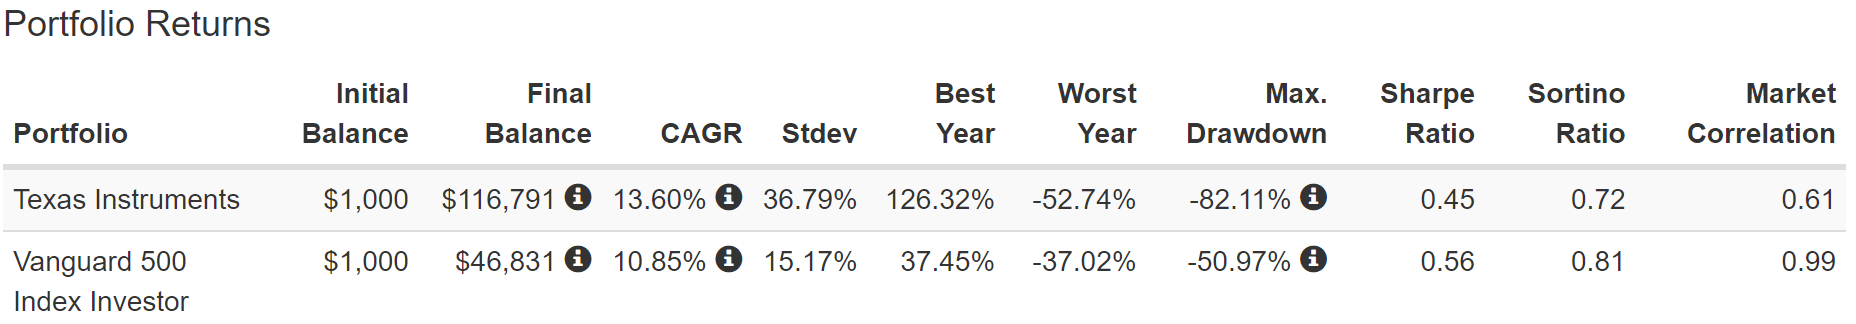
What could that potentially mean for you in the long-term?
Inflation-Adjusted Consensus Total Return Potential: $1,000 Initial Investment
| Time Frame (Years) | 7.6% CAGR Inflation-Adjusted S&P Consensus | 8.4% Inflation-Adjusted Aristocrats Consensus | 9.5% CAGR Inflation-Adjusted TXN Consensus | Difference Between Inflation-Adjusted TXN Consensus Vs S&P Consensus |
| 5 | $1,445.67 | $1,493.29 | $1,576.40 | $130.72 |
| 10 | $2,089.97 | $2,229.92 | $2,485.03 | $395.05 |
| 15 | $3,021.42 | $3,329.92 | $3,917.39 | $895.97 |
| 20 | $4,367.98 | $4,972.54 | $6,175.35 | $1,807.37 |
| 25 | $6,314.67 | $7,425.45 | $9,734.80 | $3,420.13 |
| 30 | $9,128.95 | $11,088.36 | $15,345.91 | $6,216.96 |
(Source: DK Research Terminal, FactSet)
It means potentially 15X inflation-adjusted returns over 30 years, from one of the best run and most dependable dividend blue-chips on earth in my opinion.
| Time Frame (Years) | Ratio Aristocrats/S&P Consensus | Ratio Inflation-Adjusted TXN Consensus vs S&P consensus |
| 5 | 1.03 | 1.09 |
| 10 | 1.07 | 1.19 |
| 15 | 1.10 | 1.30 |
| 20 | 1.14 | 1.41 |
| 25 | 1.18 | 1.54 |
| 30 | 1.21 | 1.68 |
(Source: DK Research Terminal, FactSet)
It’s also about 70% more than analysts expect from the S&P 500 and 50% more from the dividend aristocrats. TXN is likely to become a dividend aristocrat in seven years.
TXN Investment Decision Score
DK
Dividend Kings Automated Investment Decision Tool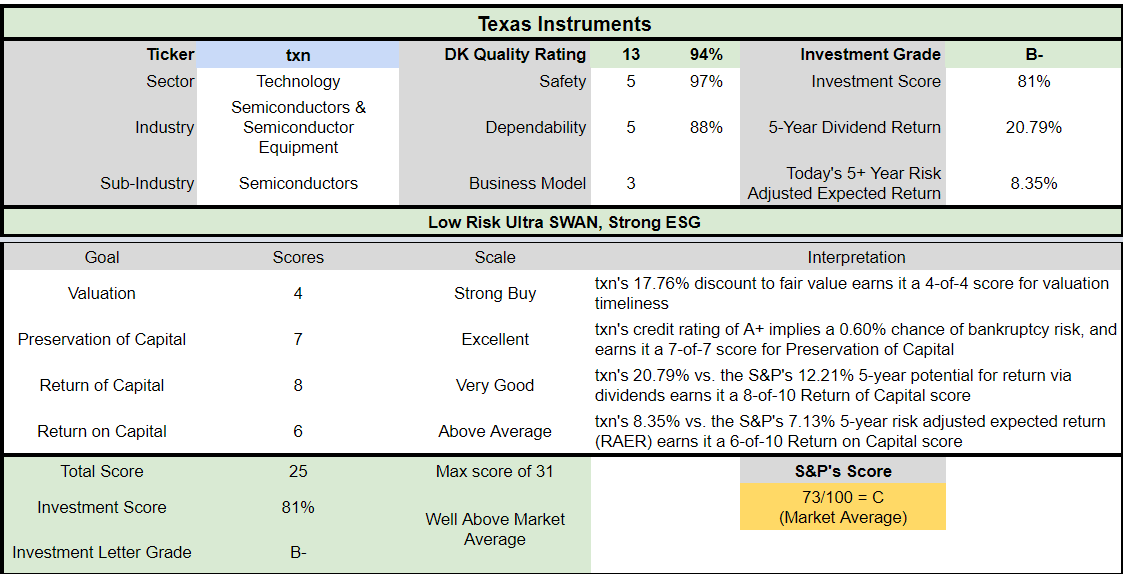
For anyone comfortable with its risk profile, TXN is a potentially reasonable and prudent high-yield, Ultra SWAN dividend blue-chip opportunity.
- 18% discount vs 3% market discount = 15% better valuation
- 3.0% yield vs 1.7% yield (and a much safer yield at that) about 2X higher
- potentially 20% higher long-term return potential than S&P 500 over time
- about 12% better risk-adjusted expected return over the next five years
- 21% of your investment repaid in consensus dividends within five years, about 66% more than the S&P 500
Qualcomm (QCOM): Management Has A Plan To 7X Its Addressable Market In 10 Years
- Qualcomm: A Wonderful Company At A Wonderful Price
- a deep dive look at QCOM’s growth outlook, risk profile, investment thesis, valuation, and total return potential
Reasons To Potentially Buy QCOM Today
- 93% quality low-risk 13/13 Ultra SWAN quality chip maker
- 44th highest quality company on the DK 500 Master List (91st percentile)
- 93% dividend safety score
- 18-year dividend growth streak
- 2.2% very safe yield
- 0.5% average recession dividend cut risk
- 1.4% severe recession dividend cut risk
- 23% historically undervalued (potential strong buy)
- Fair Value: $175.41 (13.7X earnings)
- 10.5X forward earnings vs 16X to 17.5X historical
- 8.3X cash-adjusted earnings (anti-bubble blue-chip bargain)
- A stable outlook credit rating = 0.66% 30-year bankruptcy risk
- 78th industry percentile risk management consensus = Good, bordering on very good
- 11% to 21% CAGR margin-of-error growth consensus range
- 17.2% CAGR median growth consensus
- 5-year consensus total return potential: 15% to 24% CAGR
- base-case 5-year consensus return potential: 23% CAGR (3X more than the S&P consensus)
- consensus 12-month total return forecast: 52%
- Fundamentally Justified 12-Month Returns: 33% CAGR
Investor presentation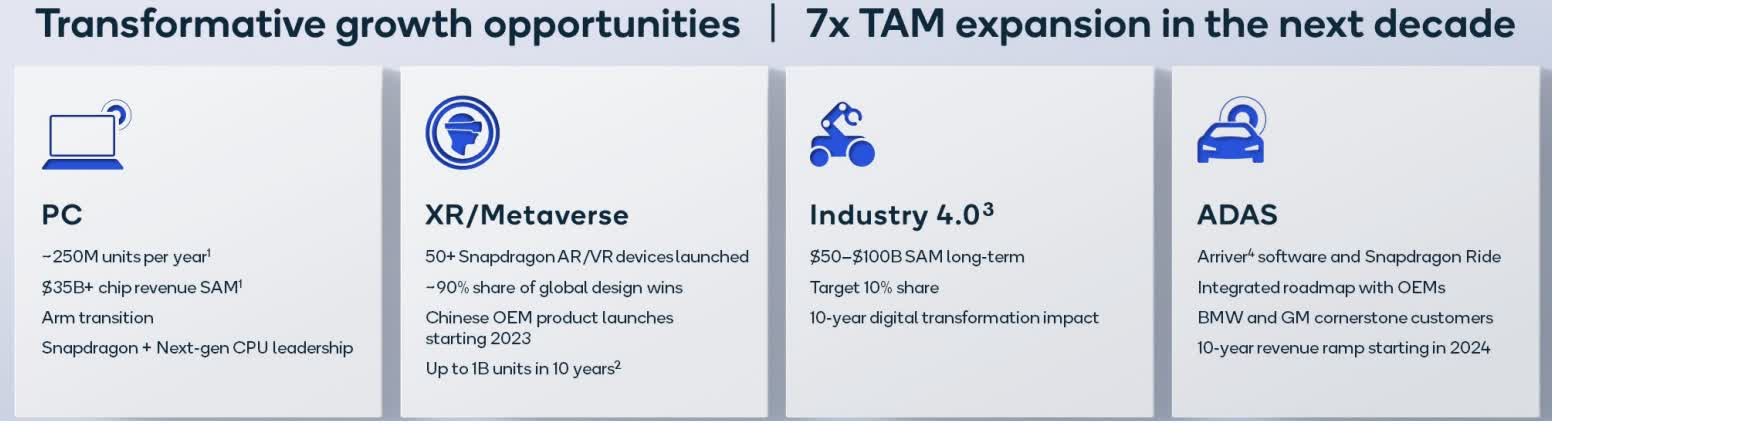
QCOM is investing heavily into every part of the industry that is driving the future of tech, which management thinks can grow its addressable market from $100 billion per year to $700 billion.
QCOM currently has about 36% market share. If it managed to maintain market share, that would be 21% annual sales growth.
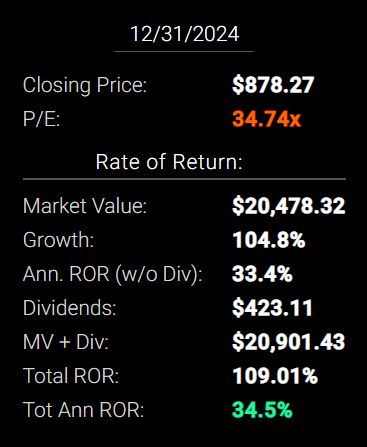
QCOM 2024 Consensus Total Return Potential
(Source: FAST Graphs, FactSet) (Source: FAST Graphs, FactSet)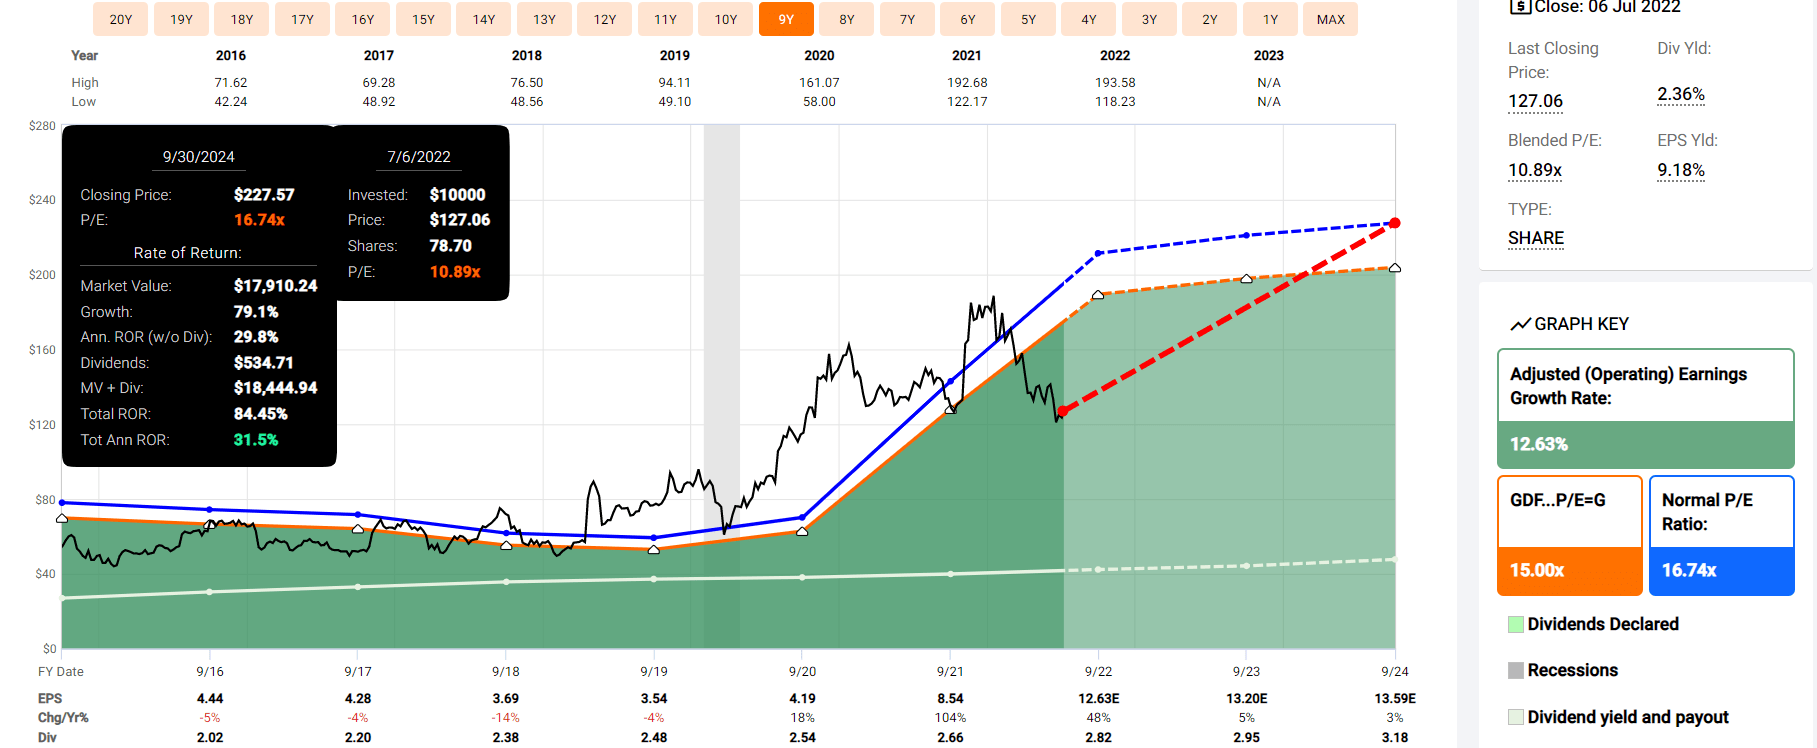
Chip investors always have to look beyond short-term weakness to buy the best blue-chips when they are most out of favor.
But if you are patient for a few years, you could end up making 32% annual returns.
- about 3X more than the S&P 500 consensus
- Buffett and Peter Lynch-like returns from a blue-chip bargain hiding in plain sight
QCOM 2027 Consensus Total Return Potential
(Source: FAST Graphs, FactSet) (Source: FAST Graphs, FactSet)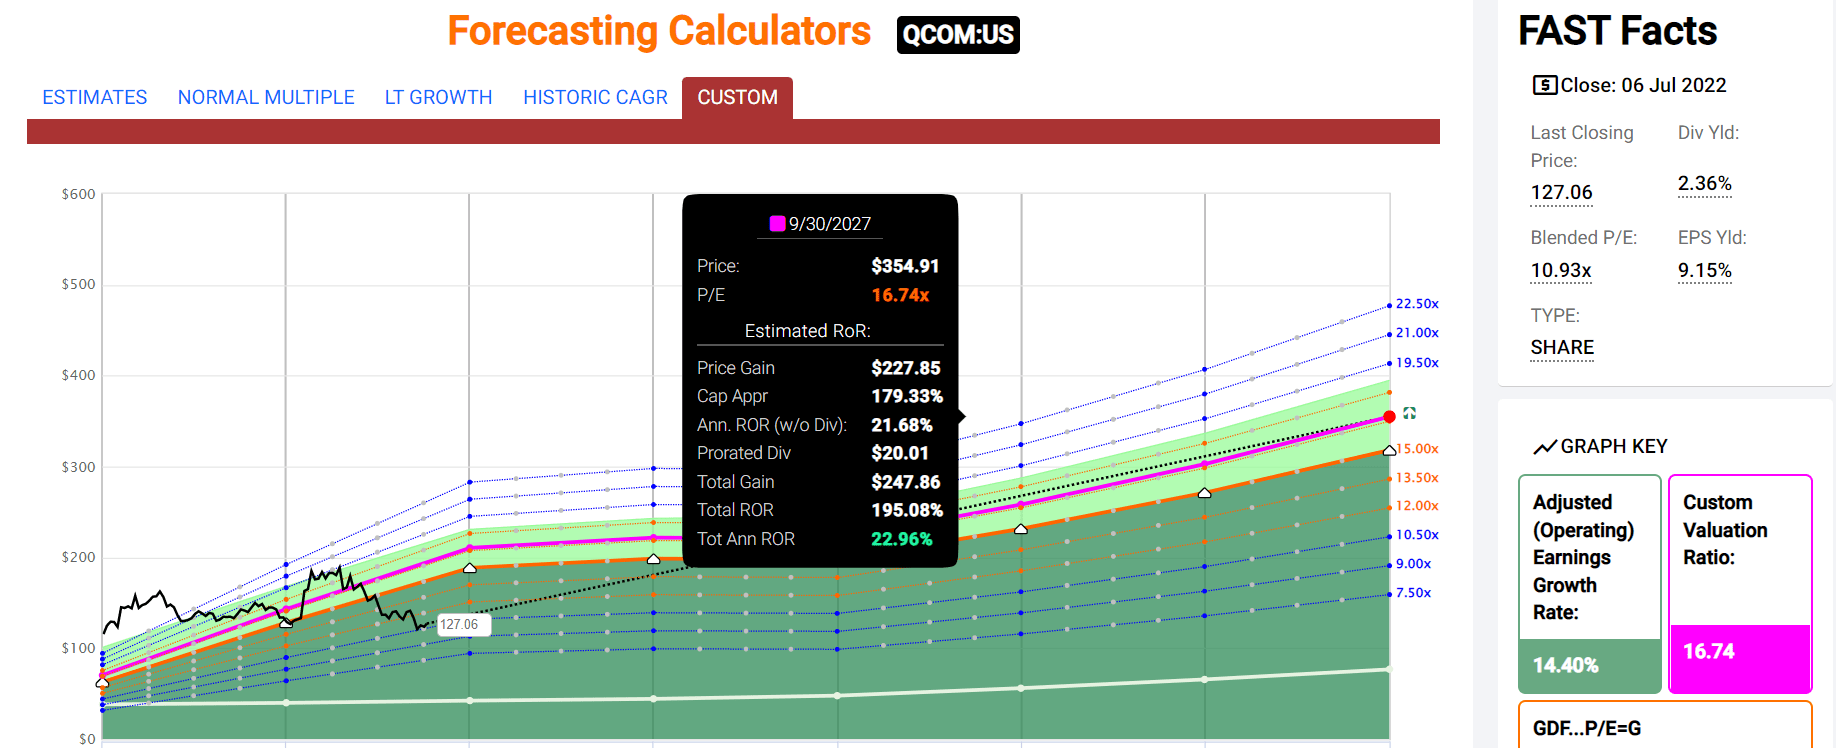
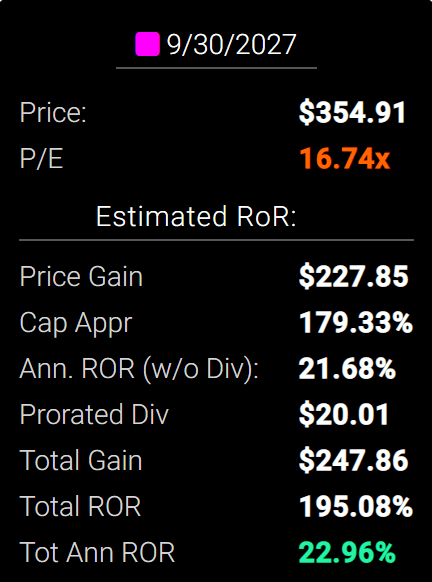
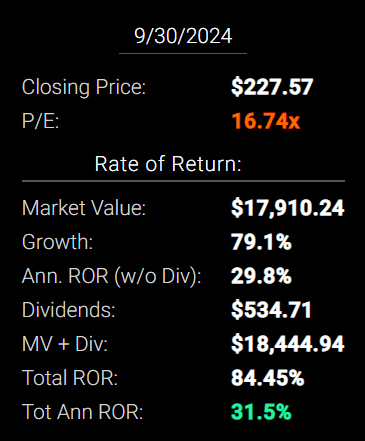
If QCOM grows at the consensus rate of 14.4% through 2027 as analysts currently expect, factoring in the slowdown of the next few years, then a return to historical fair value generates 195% total returns or 23% annually.
- 3X more than the S&P 500 consensus
- Buffett-like return potential from an anti-bubble bargain hiding in plain sight
And take a look at QCOM’s long-term total return potential.
| Investment Strategy | Yield | LT Consensus Growth | LT Consensus Total Return Potential | Long-Term Risk-Adjusted Expected Return | Long-Term Inflation And Risk-Adjusted Expected Returns | Years To Double Your Inflation & Risk-Adjusted Wealth |
10-Year Inflation And Risk-Adjusted Expected Return |
| Qualcomm | 2.2% | 17.20% | 19.4% | 19.4% | 16.9% | 4.3 | 4.78 |
| Nasdaq | 1.0% | 12.7% | 13.7% | 9.6% | 7.1% | 10.1 | 1.99 |
| Dividend Aristocrats | 2.4% | 8.5% | 10.9% | 7.6% | 5.2% | 14.0 | 1.65 |
| S&P 500 | 1.8% | 8.5% | 10.3% | 7.2% | 4.7% | 15.2 | 1.59 |
(Source: Morningstar, FactSet, Ycharts)
Analysts currently expect QCOM to continue delivering its exceptional historical returns. 19.4% consensus return potential is similar to what QCOM has delivered over the last 30 years.
QCOM Returns Since January 1992
Portfolio Visualizer Premium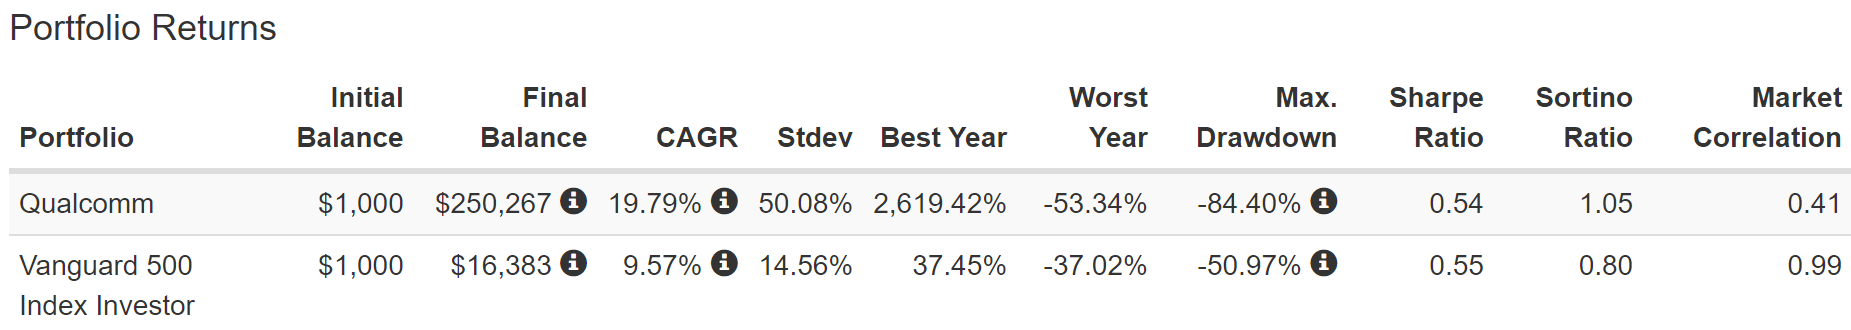
That means you can realistically expect to double your money, adjusting for the risk of companies not growing as expected and inflation, every 4.3 years, compared to 14 years for the aristocrats and 15.2 years for the S&P 500.
What could that potentially mean for you in the long-term?
Inflation-Adjusted Consensus Total Return Potential: $1,000 Initial Investment
| Time Frame (Years) | 7.6% CAGR Inflation-Adjusted S&P Consensus | 8.4% Inflation-Adjusted Aristocrats Consensus | 16.9% CAGR Inflation-Adjusted QCOM Consensus | Difference Between Inflation-Adjusted QCOM Consensus Vs S&P Consensus |
| 5 | $1,445.67 | $1,493.29 | $2,185.90 | $740.22 |
| 10 | $2,089.97 | $2,229.92 | $4,778.15 | $2,688.18 |
| 15 | $3,021.42 | $3,329.92 | $10,444.54 | $7,423.12 |
| 20 | $4,367.98 | $4,972.54 | $22,830.69 | $18,462.71 |
| 25 | $6,314.67 | $7,425.45 | $49,905.54 | $43,590.87 |
| 30 | $9,128.95 | $11,088.36 | $109,088.38 | $99,959.43 |
(Source: DK Research Terminal, FactSet)
Even if QCOM only grows as fast as analysts expect over the next 10 years, which is when management’s plan for 7Xing its addressable market is for, and ignoring its anti-bubble valuation entirely, that’s a potential 5X inflation-adjusted return.
| Time Frame (Years) | Ratio Aristocrats/S&P Consensus | Ratio Inflation-Adjusted QCOM Consensus vs S&P consensus |
| 5 | 1.03 | 1.51 |
| 10 | 1.07 | 2.29 |
| 15 | 1.10 | 3.46 |
| 20 | 1.14 | 5.23 |
| 25 | 1.18 | 7.90 |
| 30 | 1.21 | 11.95 |
(Source: DK Research Terminal, FactSet)
That’s conservatively 2.3X more return potential than the S&P 500 and double that of the dividend aristocrats. QCOM is likely to become a dividend aristocrat in seven years.
QCOM Investment Decision Score
DK Dividend Kings Automated Investment Decision Tool 
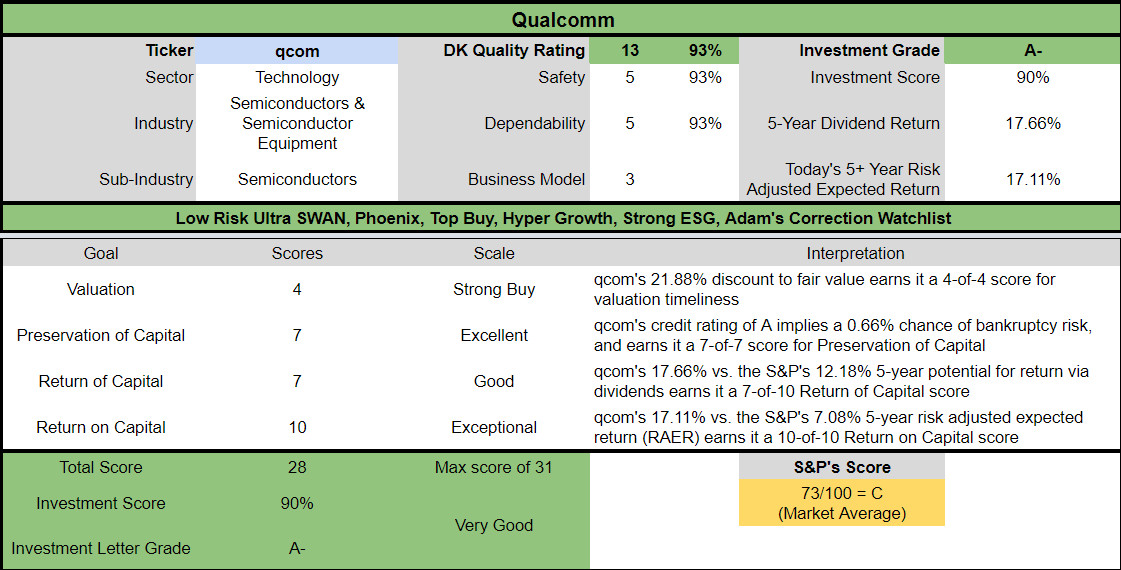
For anyone comfortable with its risk profile, QCOM is one of the most reasonable and prudent hyper-growth Ultra SWAN dividend growth investments you can make.
- 22% discount vs 3% market discount = 19% better valuation
- 2.2% yield vs 1.7% yield (and a much safer yield at that)
- potentially 90% higher long-term return potential than S&P 500 overtime
- more than 2X better risk-adjusted expected return over the next five years
- 18% of your investment repaid in consensus dividends within five years, about 50% more than the S&P 500
ASML Holding: One Of The Best Hyper-Growth Dividend Stocks You’ve Never Heard Of
- ASML: World-Leading Semis With A Long Shelf-Life
- a deep dive look at ASML’s growth outlook, risk profile, investment thesis, valuation, and total return potential
Reasons To Potentially Buy ASML Today
- 99% quality low-risk 13/13 Ultra SWAN quality chip maker
- 8th highest quality company on the DK 500 Master List (98th percentile)
- 100% dividend safety score
- 12-year dividend growth streak
- 1.4% very safe yield
- 0.5% average recession dividend cut risk
- 1.1% severe recession dividend cut risk
- 41% historically undervalued (potential strong buy)
- Fair Value: $768.01
- 25.9X forward earnings vs 27X to 35X historical
- 19.1X cash-adjusted earnings
- A stable outlook credit rating = 0.66% 30-year bankruptcy risk
- 92nd industry percentile risk management consensus = exceptional
- 9% to 36% CAGR margin-of-error growth consensus range
- 19.1% CAGR median growth consensus
- 5-year consensus total return potential: 5% to 24% CAGR
- base-case 5-year consensus return potential: 27% CAGR (4.5x more than the S&P consensus)
- consensus 12-month total return forecast: 65%
- Fundamentally Justified 12-Month Returns: 71% CAGR
ASML is the world’s leading extreme ultraviolet lithography device maker. The cutting edge tech that makes advanced semiconductors possible.
Or to put it another way, ASML is the world leader in the technology that is needed to keep advancing chips in the future.
- chips make all of technology possible
- ASML makes better chips possible
- ASML is one of the world’s best “pick and shovels” companies
ASML 2024 Consensus Total Return Potential
(Source: FAST Graphs, FactSet) (Source: FAST Graphs, FactSet)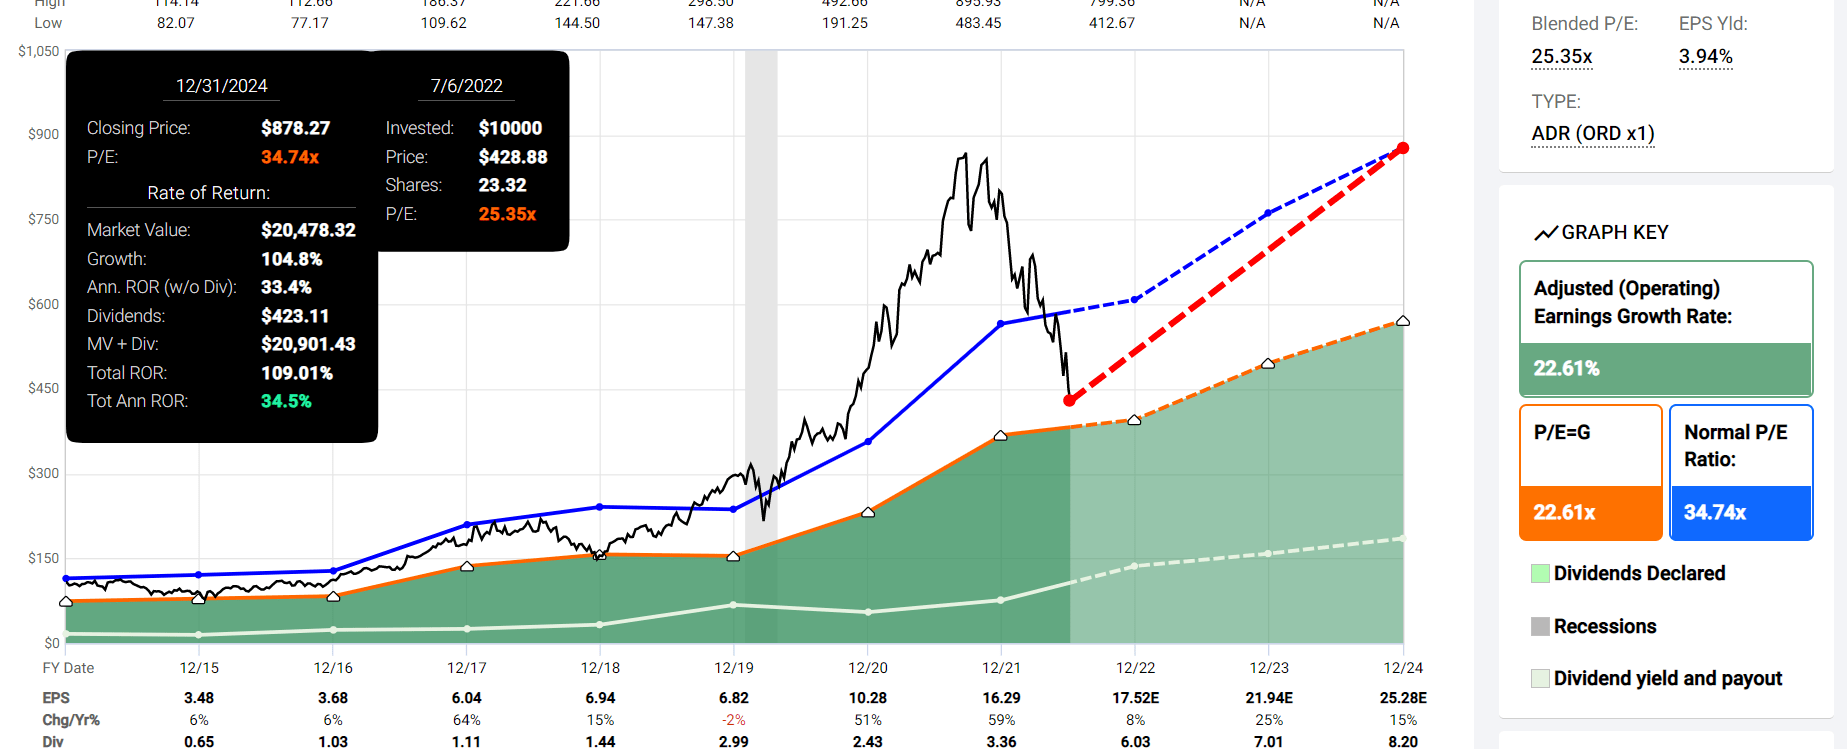
ASML’s business is booming and expected to sail through the industry slowdown with over 40% consensus growth thanks to its unique business model in the next few years.
If analysts are right, then 109% total returns or 35% annually might be coming by 2024.
- about 3.5X more than the S&P 500 consensus
- Buffett and Joel Greenblatt-like returns from a blue-chip bargain hiding in plain sight
ASML 2027 Consensus Total Return Potential
(Source: FAST Graphs, FactSet) (Source: FAST Graphs, FactSet)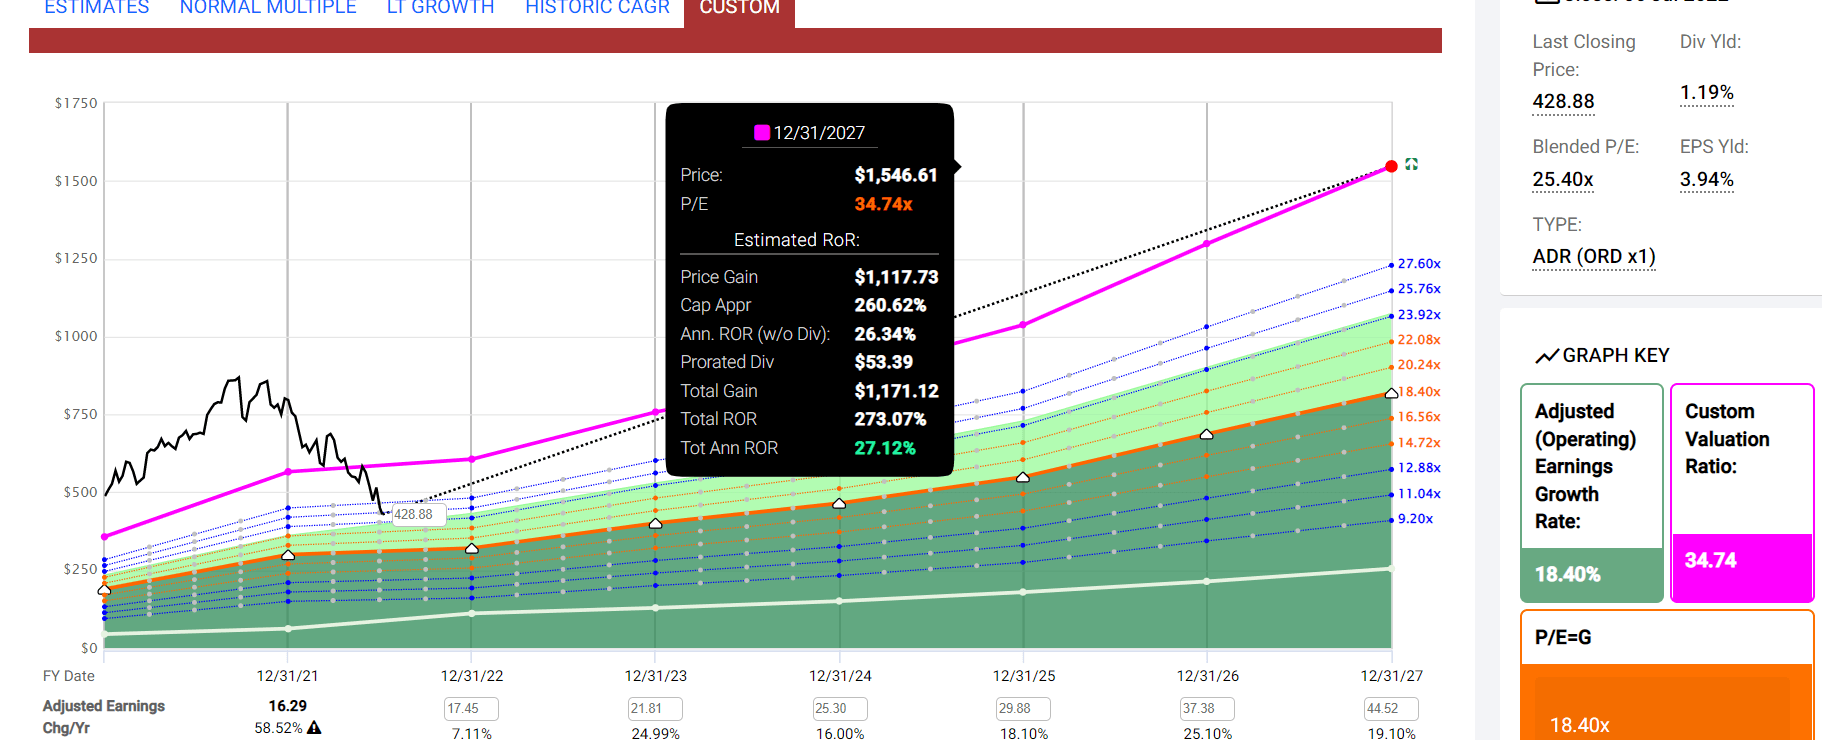
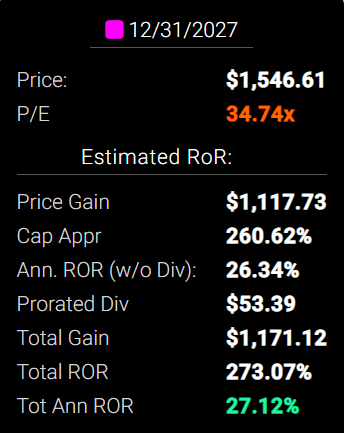
If ASML grows at the consensus rate of 18.4% through 2027 as analysts currently expect, then a return to historical fair value generates 273% total returns or 27% annually.
- 3X more than the S&P 500 consensus
- Buffett and Peter Lynch-like return potential from, in my opinion, one of the world’s highest quality hyper-growth Ultra SWANs
And take a look at ASML’s long-term total return potential.
| Investment Strategy | Yield | LT Consensus Growth | LT Consensus Total Return Potential | Long-Term Risk-Adjusted Expected Return | Long-Term Inflation And Risk-Adjusted Expected Returns | Years To Double Your Inflation & Risk-Adjusted Wealth |
10-Year Inflation And Risk-Adjusted Expected Return |
| ASML Holdings | 1.4% | 19.20% | 20.6% | 20.6% | 18.1% | 4.0 | 5.29 |
| Nasdaq | 1.0% | 12.7% | 13.7% | 9.6% | 7.1% | 10.1 | 1.99 |
| Dividend Aristocrats | 2.4% | 8.5% | 10.9% | 7.6% | 5.2% | 14.0 | 1.65 |
| S&P 500 | 1.8% | 8.5% | 10.3% | 7.2% | 4.7% | 15.2 | 1.59 |
(Source: Morningstar, FactSet, Ycharts)
Analysts currently expect ASML to continue delivering its exceptional historical Buffett-like returns. Returns that could beat almost every popular investment strategy including the S&P, aristocrats, and Nasdaq, by a wide margin.
20.6% consensus return potential is similar to what QCOM has delivered over the last 30 years.
ASML Returns Since April 1995
Portfolio Visualizer Premium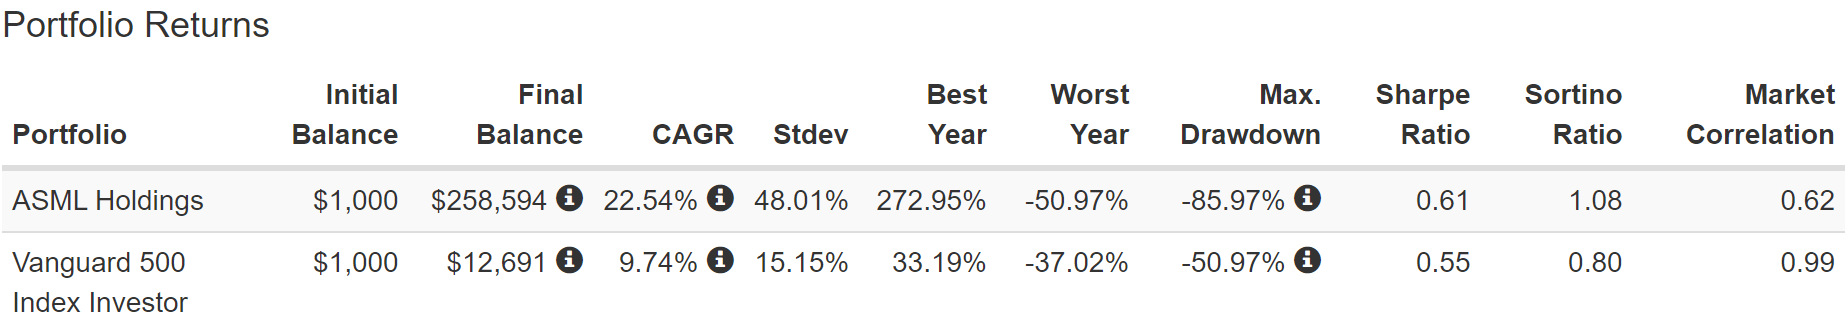
That means you can realistically expect to double your money, adjusting for the risk of companies not growing as expected and inflation, every 4.0 years, compared to 14 years for the aristocrats and 15.2 years for the S&P 500.
What could that potentially mean for you in the long-term?
Inflation-Adjusted Consensus Total Return Potential: $1,000 Initial Investment
| Time Frame (Years) | 7.6% CAGR Inflation-Adjusted S&P Consensus | 8.4% Inflation-Adjusted Aristocrats Consensus | 18.1% CAGR Inflation-Adjusted ASML Consensus | Difference Between Inflation-Adjusted ASML Consensus Vs S&P Consensus |
| 5 | $1,445.67 | $1,493.29 | $2,300.39 | $854.71 |
| 10 | $2,089.97 | $2,229.92 | $5,291.78 | $3,201.81 |
| 15 | $3,021.42 | $3,329.92 | $12,173.15 | $9,151.74 |
| 20 | $4,367.98 | $4,972.54 | $28,002.97 | $23,634.99 |
| 25 | $6,314.67 | $7,425.45 | $64,417.68 | $58,103.01 |
| 30 | $9,128.95 | $11,088.36 | $148,185.64 | $139,056.69 |
(Source: DK Research Terminal, FactSet)
Even if ASML only grows as fast as analysts expect over the next 10 years, and ignoring its attractive valuation entirely, that’s a potential 5.3X inflation-adjusted return.
| Time Frame (Years) | Ratio Aristocrats/S&P Consensus | Ratio Inflation-Adjusted ASML Consensus vs S&P consensus |
| 5 | 1.03 | 1.59 |
| 10 | 1.07 | 2.53 |
| 15 | 1.10 | 4.03 |
| 20 | 1.14 | 6.41 |
| 25 | 1.18 | 10.20 |
| 30 | 1.21 | 16.23 |
(Source: DK Research Terminal, FactSet)
That’s conservatively 2.5X more return potential than the S&P 500 and the dividend aristocrats. ASML is likely to become a dividend champion in 13 years.
ASML Investment Decision Score
DK Dividend Kings Automated Investment Decision Tool
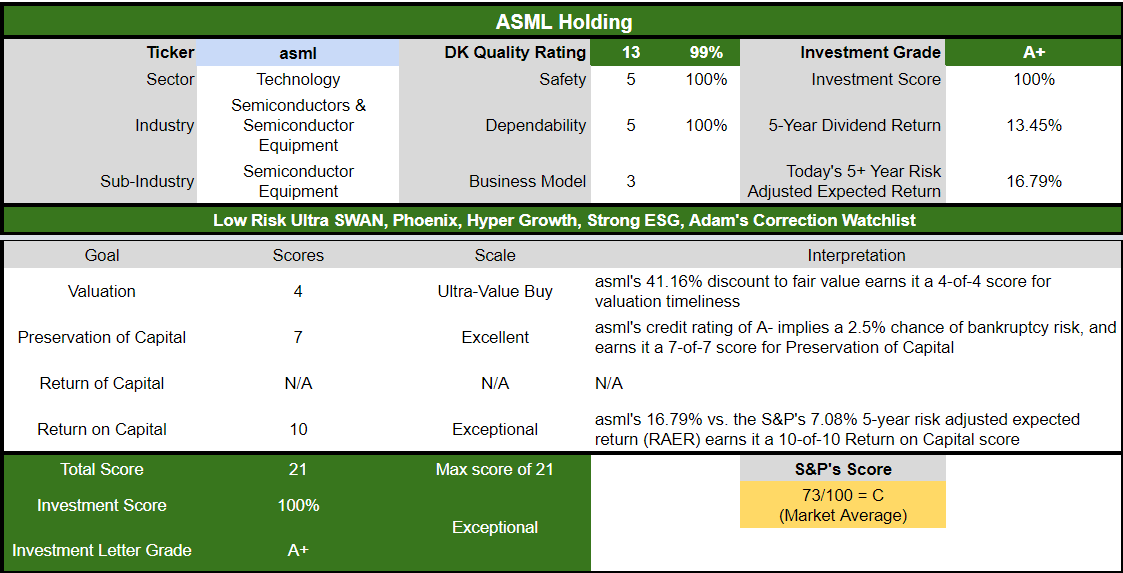
For anyone comfortable with its risk profile, ASML is as close to a perfect hyper-growth Ultra SWAN dividend growth investment opportunity as exists on Wall Street.
- 41% discount vs 3% market discount = 38% better valuation
- potentially 110% higher long-term return potential than S&P 500 overtime
- about 2.5X better risk-adjusted expected return over the next five years
Bottom Line: TXN, QCOM, And ASML Are Three Fast-Growing Dividend Blue-Chips You Want To Buy In This Bear Market
I can’t tell you when chip makers will bottom, or when the market will bottom. No one can, all we can do is offer various scenarios based on the best available data.
- inflation is driving the bus right now, for the Fed, interest rates, the economy, and the stock market
Cleveland Federal Reserve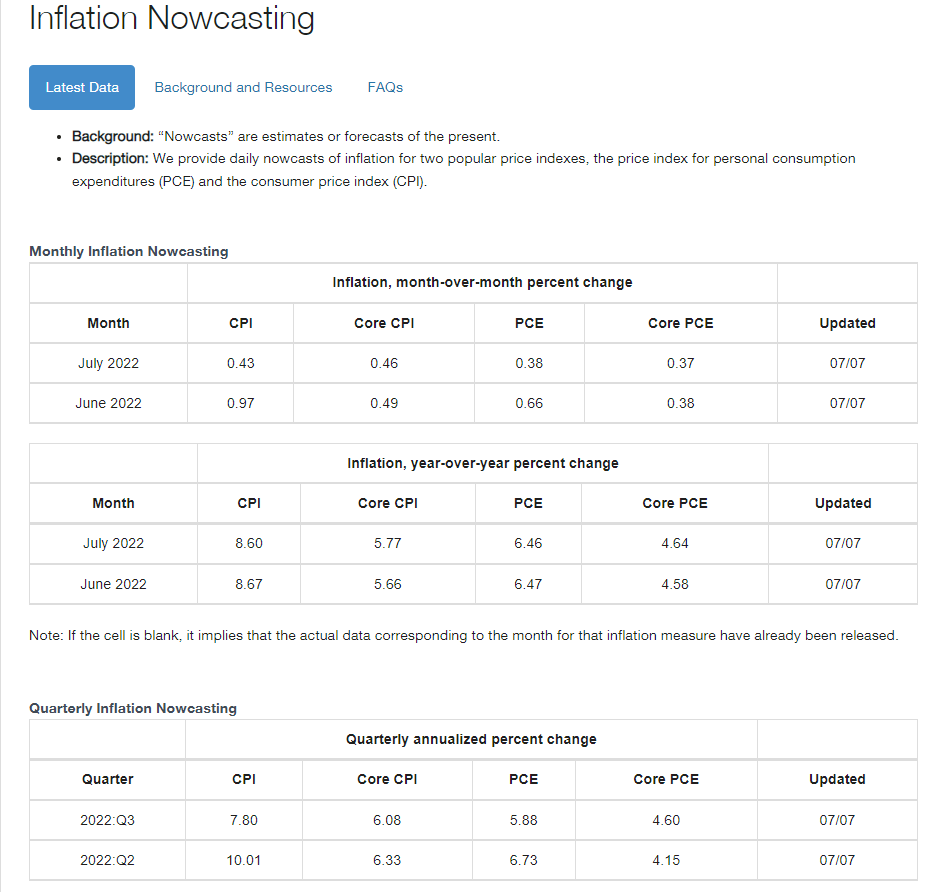
The Cleveland Fed’s daily updated inflation nowcast model estimates YOY CPI inflation of 8.7% for the next report (Wed, July 13th), and 8.6% for the August report.
FactSet Research Terminal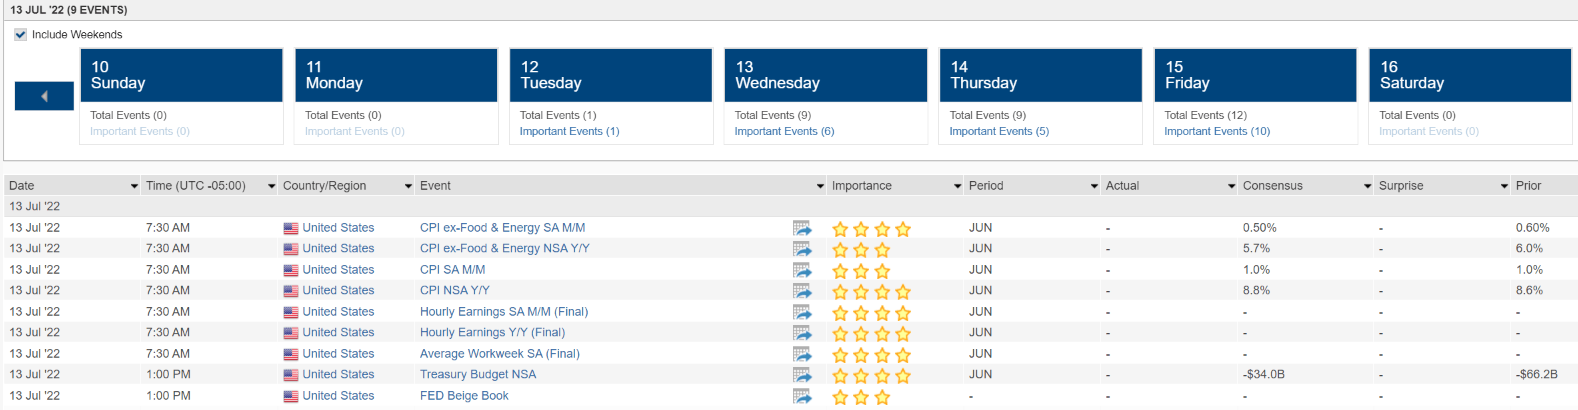
The FactSet Consensus is for 8.8% YOY inflation in the next CPI report with the same 1% MoM report.
FactSet Research Terminal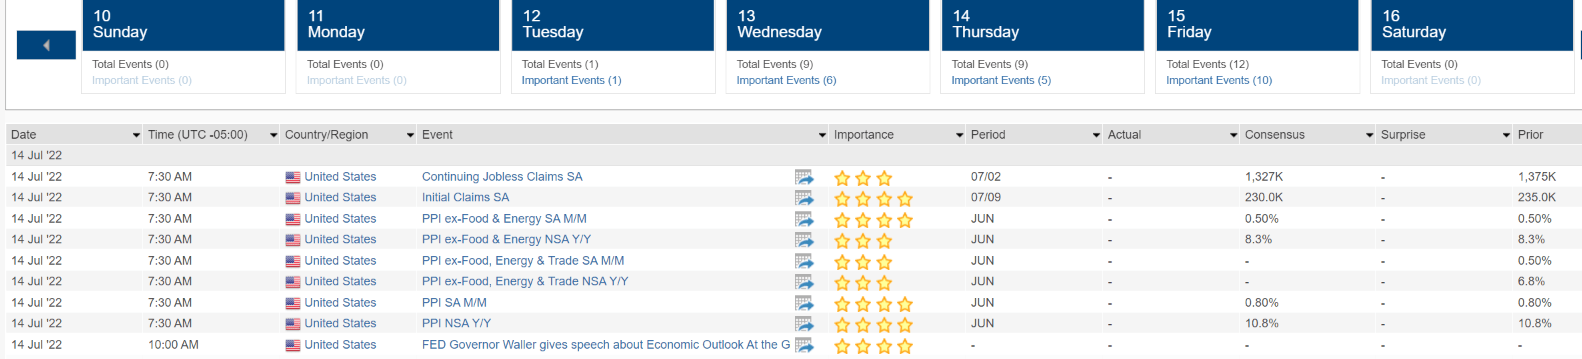
The FactSet consensus for the next wholesale inflation report, PPI, coming July 14th, is 10.8% YOY, the same as last month.
Daily Shot 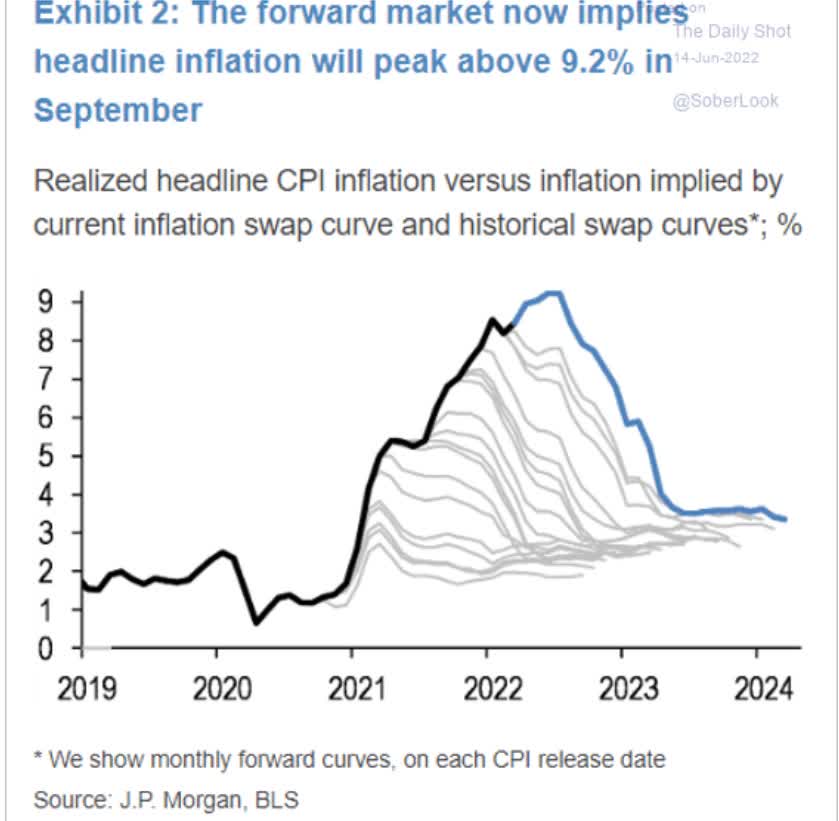
According to JPMorgan’s model, based on the commodities futures market, inflation could peak around 9.2% in the October inflation report.
Daily Shot 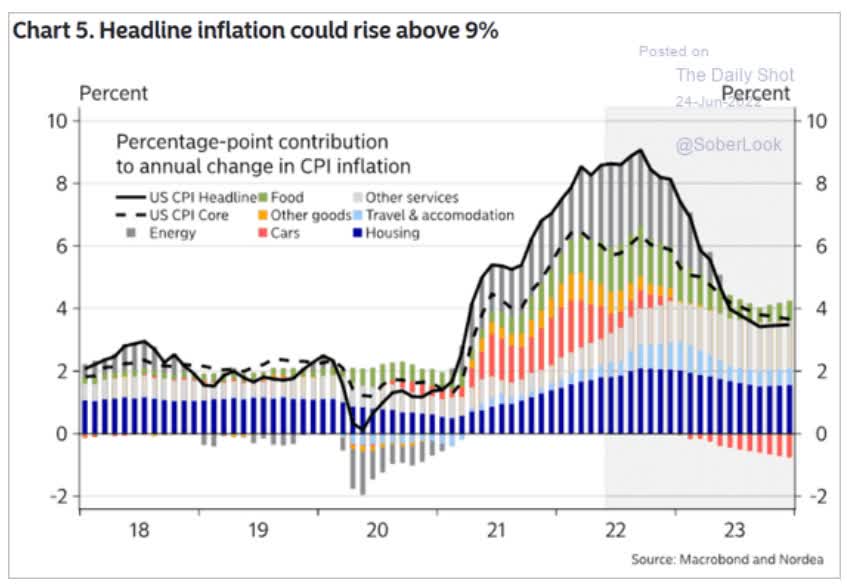
Nordea agrees, expecting peak inflation of just above 9%.
How accurate are these forecasts? Time will tell.
How will the Fed react to inflation over the next year? Not even the Fed knows as they are data-dependent.
How will the economy react to tightening financial conditions? We have to watch the data as it comes in.
How will the stock market react? That largely depends on how earnings expectations fare after earnings season begins on July 14th, when JPM kicks off earnings season.
This is the kind of uncertainty that drives Wall Street, always has, and always will.
Some of the smartest people in the world work in this industry and two equally smart experts can take a look at the same data and come to two opposite conclusions, that’s why markets exist.
But while I can’t tell you what the Fed, economy, or stock market will do in the next year, here’s what I can say with very high confidence.
Texas Instruments, Qualcomm, and ASML Holding are, in my opinion, three of the world’s highest quality, safest, and most dependable dividend growth Ultra SWANs.
- A-rated from 2+ rating agencies
- impeccable long-term risk management (according to six rating agencies)
- cash-rich balance sheets
- outstanding free cash flow generators
- strong to excellent long-term growth prospects
- some of the safest dividends on earth
- steadily growing dividends in all economic and market conditions
- attractive valuations
- outstanding medium and long-term return potential
- a history of delivering sensational dividend growth and wealth compounding
I can’t tell you whether or not these chip makers are close to bottom now, or might fall another 10%, 20%, or 30%.
What I can tell you is that anyone buying today, based on the best available evidence, is very likely to be happy or even thrilled with the results in 5+ years.
“If you’re not willing to own a company for 10 years, don’t even think about owning it for 10 minutes.” – Warren Buffett
My goal isn’t to try to help you score a quick 50% gain in a year (though that’s what analysts expect from ASML).
My goal is to help you take charge of your financial future and make your own luck on Wall Street.
“Luck is what happens when preparation meets opportunity.” – Seneca the Younger
Buying three of the world’s best chip makers when they are deeply out of favor and trading at historically good to outstanding margins of safety isn’t a guarantee of Buffett-like returns, but it’s as close as you’ll get to a “sure thing” on Wall Street.
Buying the world’s highest quality and most dependable fast-growing dividend blue-chips for the long-term, in a bear market, is one of the most time-tested approaches to retiring rich and staying rich in retirement.
$1,000 Invested in Texas Instruments In 1985 Has Paid $19,043 In Cumulative Dividends
Portfolio Visualizer Premium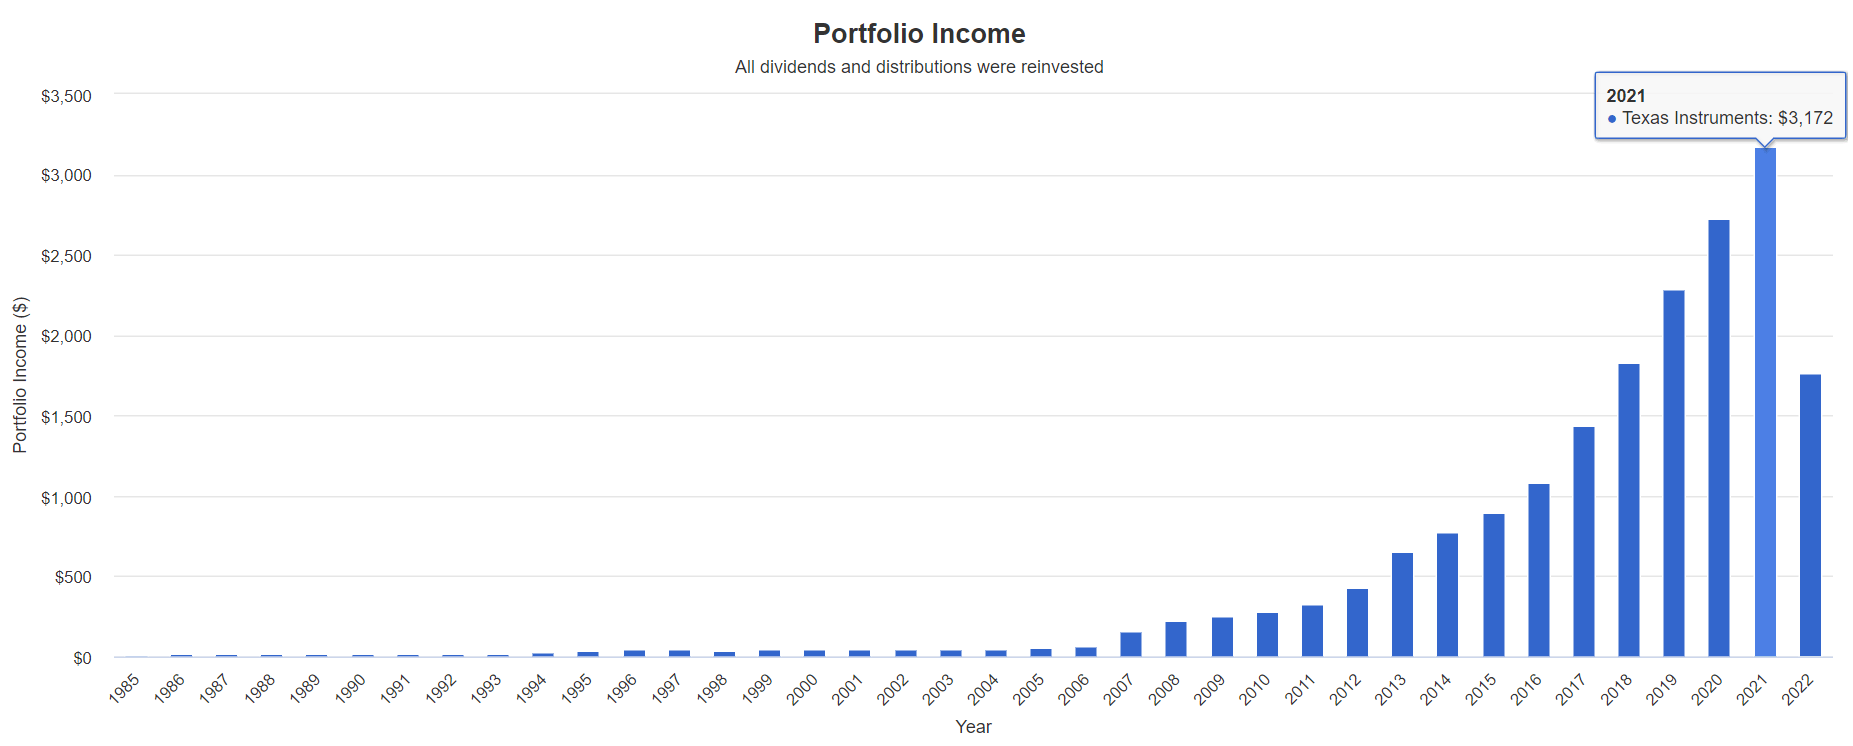
“Fortunes are made by buying right and holding on.” – Tom Phelps
“Just keep buying” – Nick Maggiulli
This is the power of long-term dividend growth investing.
This is the power of Ultra SWAN investing in a bear market.
This is how you take charge of your financial future and make your own luck on Wall Street.
Not through market timing, or speculation, but through a disciplined and methodical, and patient focus on safety and quality first, and prudent valuation and sound risk-management always.
Buying TXN, QCOM, ASML, and similar quality dividend blue-chips in this bear market is the best way to maximize your chances of retiring in safety and splendor.
Be the first to comment