

Galeanu Mihai
Thesis
This article presents a forecast of S&P 500 (SP500) based on two independent approaches. Both approaches rely on quite simple, intuitive, and timeless principles in my view.
The first approach is based on the ECY (excess CAPE yield), i.e., the earnings yield on a CAPE basis (cyclically adjusted P/E) minus the 10-year treasury bond yield. And the results are summarized in the table below. As seen, this approach arrives at a forecast of 4,068, about 6.2% above the current level of 3,825 as of this writing.
Source: Author 
The second approach involves the yield spread (“YS”) between SP500 and the 10-year Treasury bonds. And this is where I relied on the data from the SPDR S&P 500 Trust ETF (SPY). I treated SPY and SP500 interchangeably as SPY does track the index closely as seen in the next section and SPY’s data are more easily obtained in many cases (such as the dividend yield). And I will use this YS approach as an independent check on our above forecast. Moreover, the YS analysis will provide an uncertainty bar on my estimate, which is more important than the forecast itself in my view.
In both approaches, the forecast is based on two basic assumptions: one about the earnings per share for the S&P 500 index and another on the risk-free interest rates by the end of 2023. And we will elaborate on these assumptions immediately below.
Source: Seeking Alpha data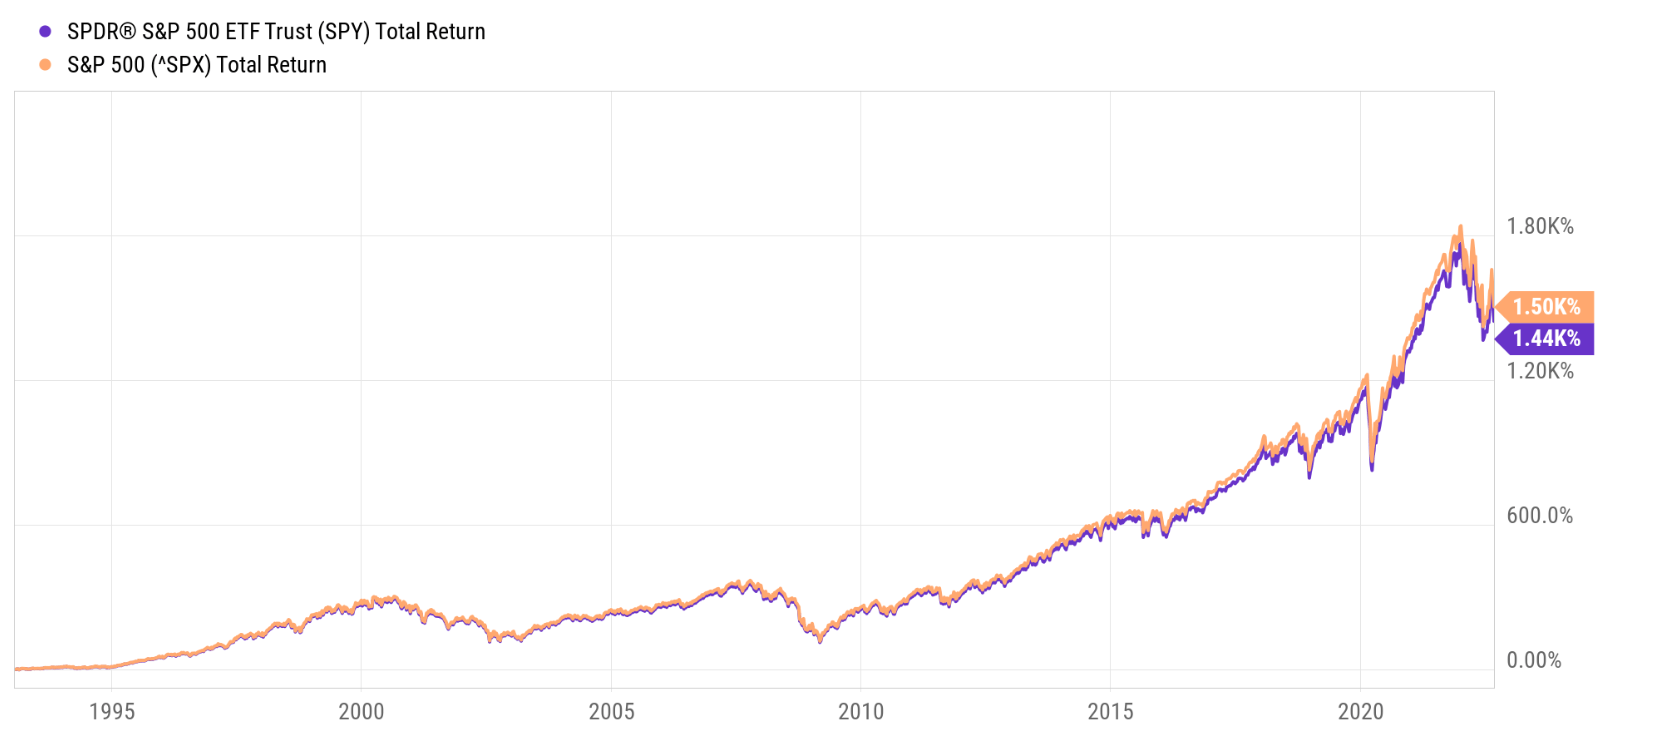
S&P 500 earnings and treasury rates
For the S&P 500 earnings, I am assuming a growth rate of 4.2% to $201.48 per share for 2023. The assumption is based on the following GDP and CPI data provided by the Federal Reserve Bank of St. Louis:
The outlook for U.S. real GDP growth has dimmed appreciably over the past year, with the consensus prediction now calling for it to increase by 0.8% in 2023. Headline CPI inflation is forecast to slow, from a projected 7.7% in 2022 to 3.4% in 2023.
Hence, the 4.2% growth consists of 0.8% of real GDP growth and 3.8% of inflation.
For the treasury rates, I am forecasting the 10-year Treasury rates to stabilize at 3.5% by 2023 for two reasons primarily. First and foremost, as repeatedly communicated in our other writings, we firmly believe that long-term Treasury rates cannot exceed inflation or real GDP growth – that is the only way our government can handle its debt. And the long-term combined effects of inflation and real GDP growth is about 3.5%. Second, recent CPI reports have been showing two months of milder-than-expected inflation data already. To wit, the November Consumer Price Index dialed in at +0.1%, compared to +0.3% expected, indicating that the Fed’s aggressive rate hikes are working through the economy and the pace of rate hikes should slow from here on (otherwise, the risk of pushing the economy into a recession increases).
You can see both reasons reflected in the data shown below. The average 10-year Treasury rate is 3.91% in the past two decades since 1992. And recently, the long-term Treasury rates (10 years and above) and the short-term rates (2 years and below) began to diverge, supporting the argument that long-term rates cannot stay about 4%+ for too long.
Source: Seeking Alpha data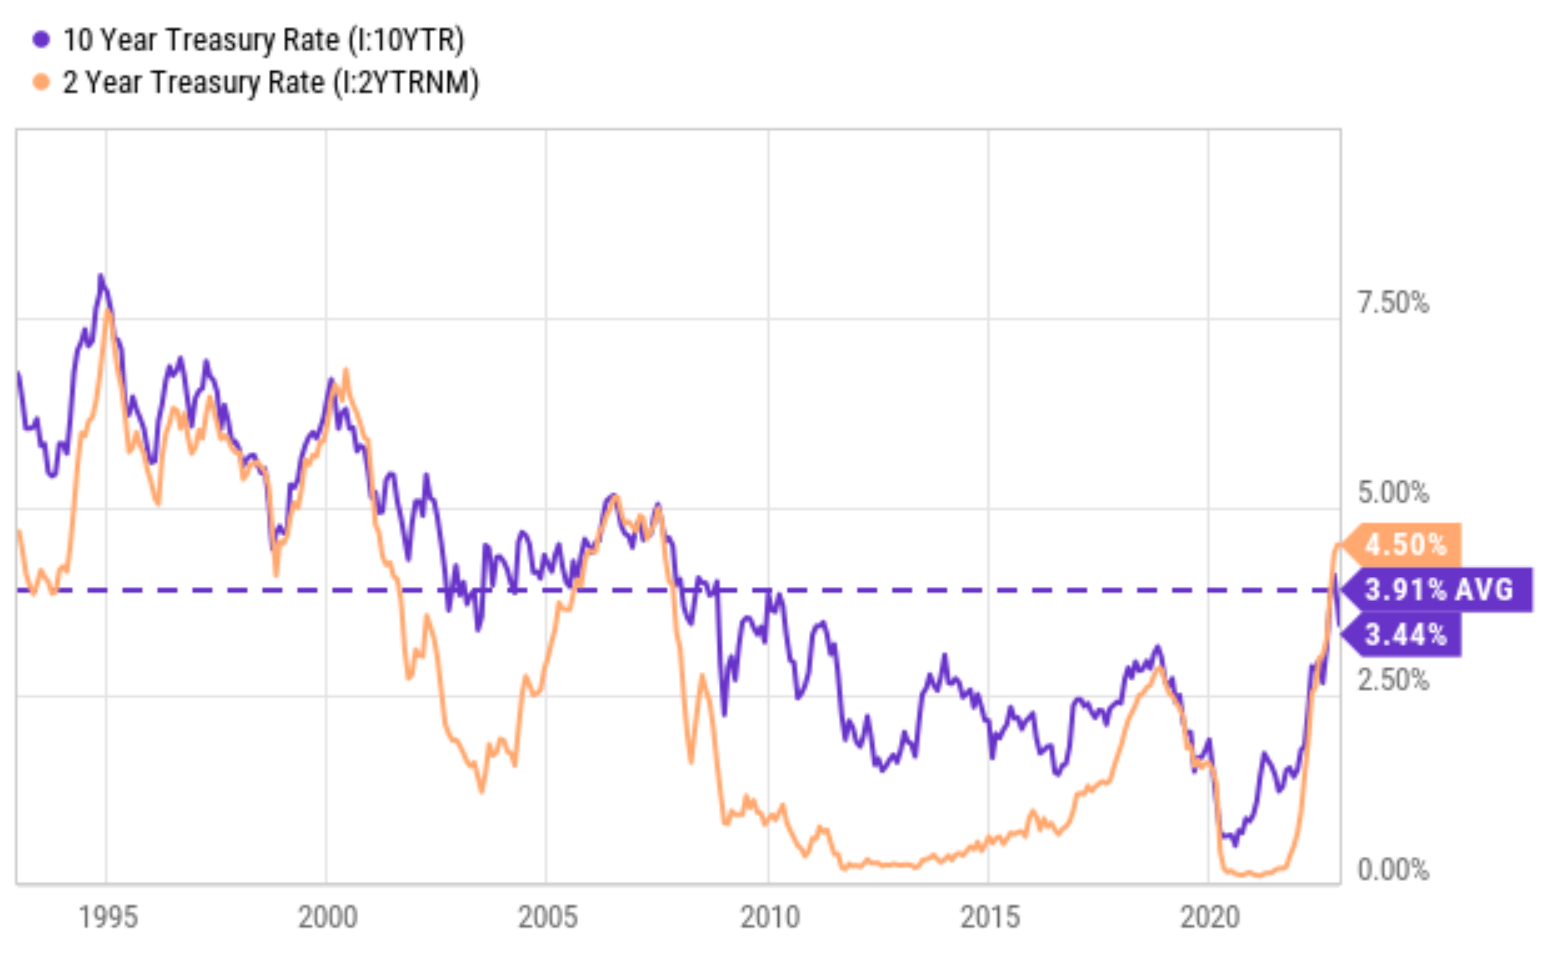
S&P 500 Excess CAPE Yield
Once the earnings and treasury rate forecasts are established, the rest of the forecasting is quite straightforward. Let’s start with the ECY (excess CAPE yield). The ECY is defined as:
ECY = (1 / CAPE) – US 10-year bond real yield
The intuition is really simple. The earnings yield from stocks and bonds should be in equilibrium in the long term because fundamentally stocks and treasury bonds are the same. Treasury bonds are supported by the tax revenues collected from the companies. And in return, the revenues of the companies are facilitated and protected by government services supported by taxes. Each of them is only as strong as the other.
You can see the above equilibrium from the long-term trend of the ECY from the following chart spanning more than 6 decades since 1960. The ECY (the blue line) fluctuated more or less in a range of 0% to 5% with an average of 2.5% as highlighted by the yellow box.
In case you are wondering why the average is not 0% but 2.5%, it is because the definition of ECY above is based on US 10-year bond REAL yield. And the average of 2.5% is precisely the average inflation in the long term. So, if you consider the nominal yield spread, i.e., (1 / CAPE) – US 10-year bond yield, the average would be very close to 0%.
Source: en.macromicro.me S&P 500 Excess CAPE Yield 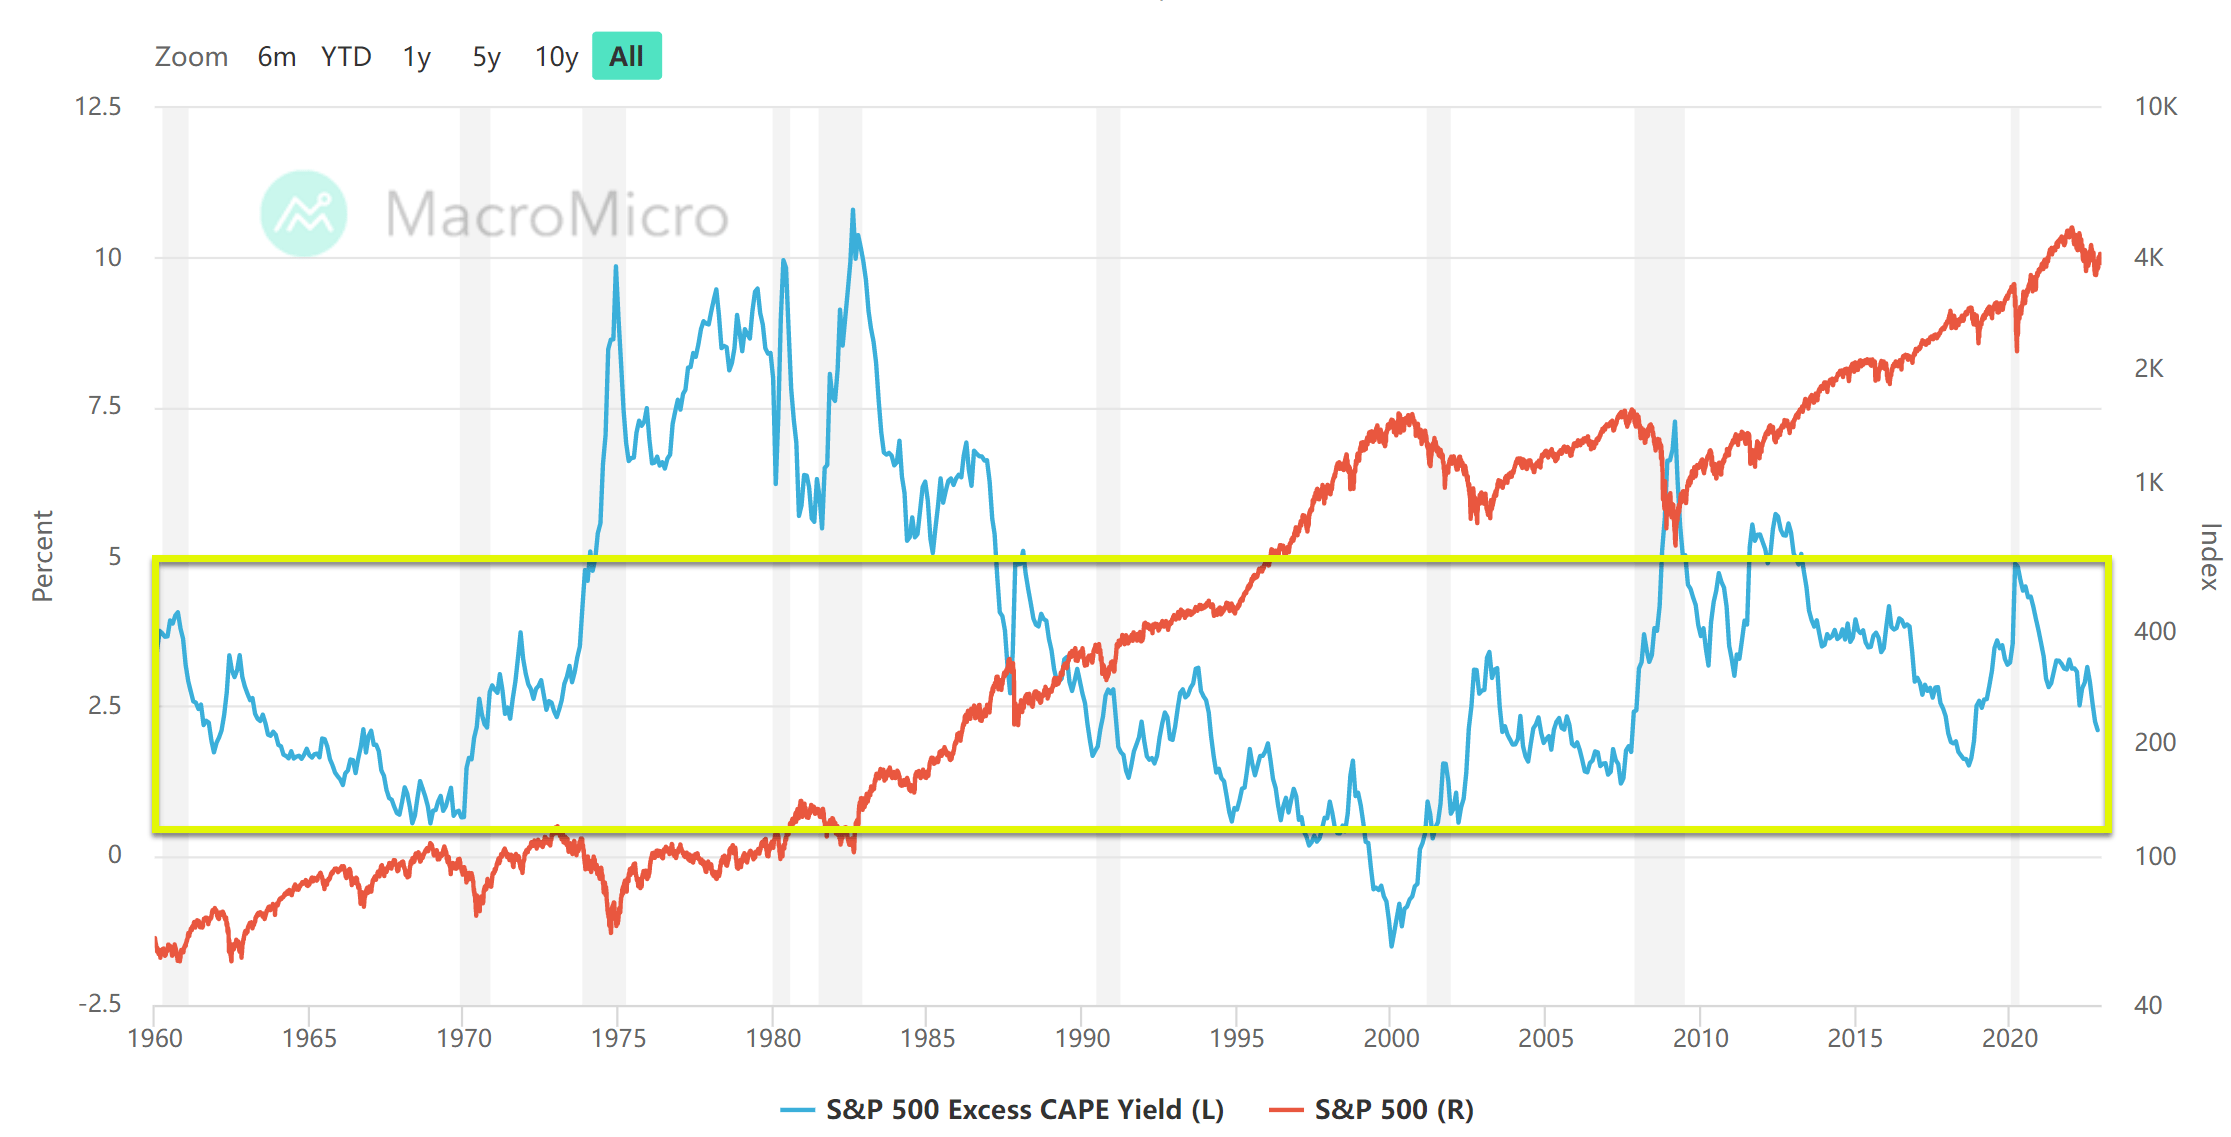
With this background, let’s walk over my forecast again. As aforementioned, I am forecasting the S&P 500 earnings to be $201.48 per share in 2023, which translates into a cyclical adjusted EPS (CA EPS) of $142.39 per share. Based on the assumption of 10-year Treasury rates of 3.5% and also a nominal ECY of 0%, the CAPE ratio would be the inverse of 3.5% (i.e., 28.57x). Putting together the CAPE multiple and the CA EPS forecast, I arrived at an SP500 forecast of 4,068 for 2023 as shown.
Source: Author 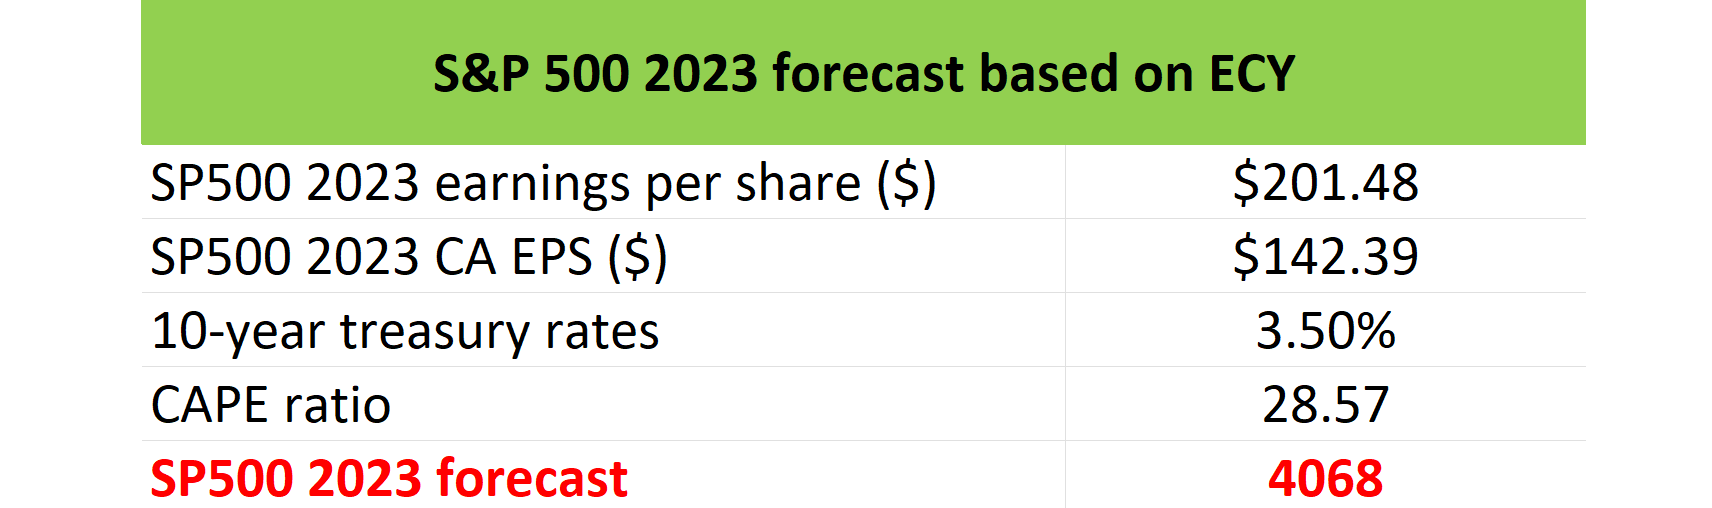
SPY dividend yield vs. treasury yields spread
As a second approach, the next chart shows the yield spread (“YS”) between SPY and 10-year Treasury rates. Similar to the above ECY concept, the YS concept is also based on timeless principles as detailed in our earlier article:
- The common PE multiples provide partial and even misleading information due to the differences between accounting earnings and owners’ earnings.
- Dividends provide a backdoor to quickly estimate the owners’ earnings. Dividends are the most reliable financial information and least open to interpretation.
- The dividend yield spread (“YS”) is based on a timeless intuition. No matter how times change, the risk-free rate serves as the gravity on all asset valuations and consequently, the spread ALWAYS provides a measurement of the risk premium investors are paying relative to risk-free rates.
The chart below shows the YS between SPY and 10-year Treasury rates in the past two decades since 2002. As seen, the YS has been again range-bound in the long term, spending most of the time between -2.0% and 1.0%.
Source: Author based on Seeking Alpha data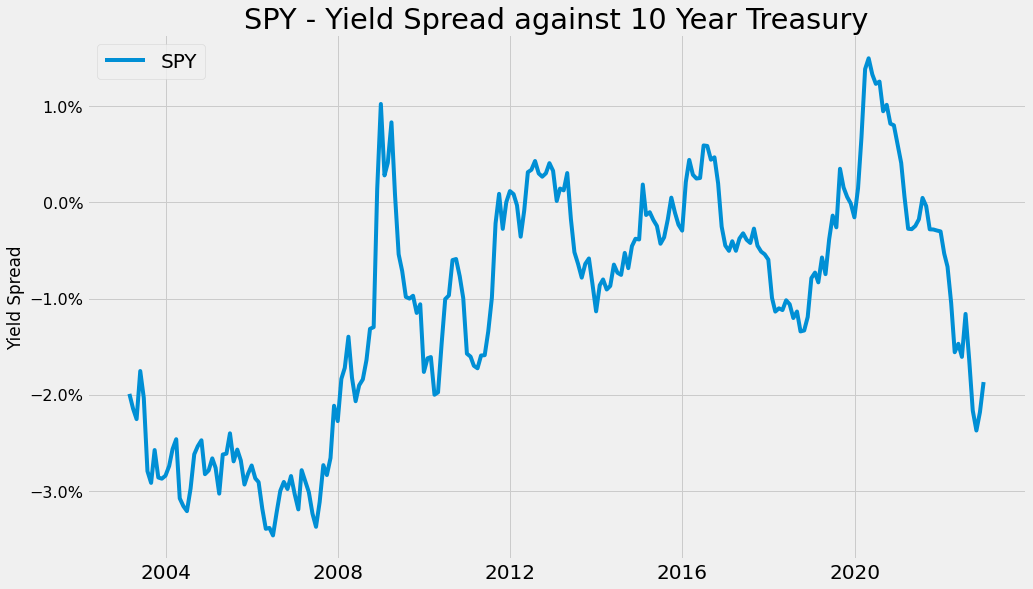
Looking forward, for 2023, I assume the dividend from the S&P 500 would grow at the same rate as the earnings (i.e., 4.2%). As a result, the dividend per share would grow to $68.33, which implies a payout ratio of 33.9%, very consistent with the rule of a 1/3 payout ratio. Combined with the forecast of a 4,068 S&P 500 price and 3.5% Treasury rates, the dividend yield is projected to be 1.68% and the YS would be -1.82% as shown in the table below.
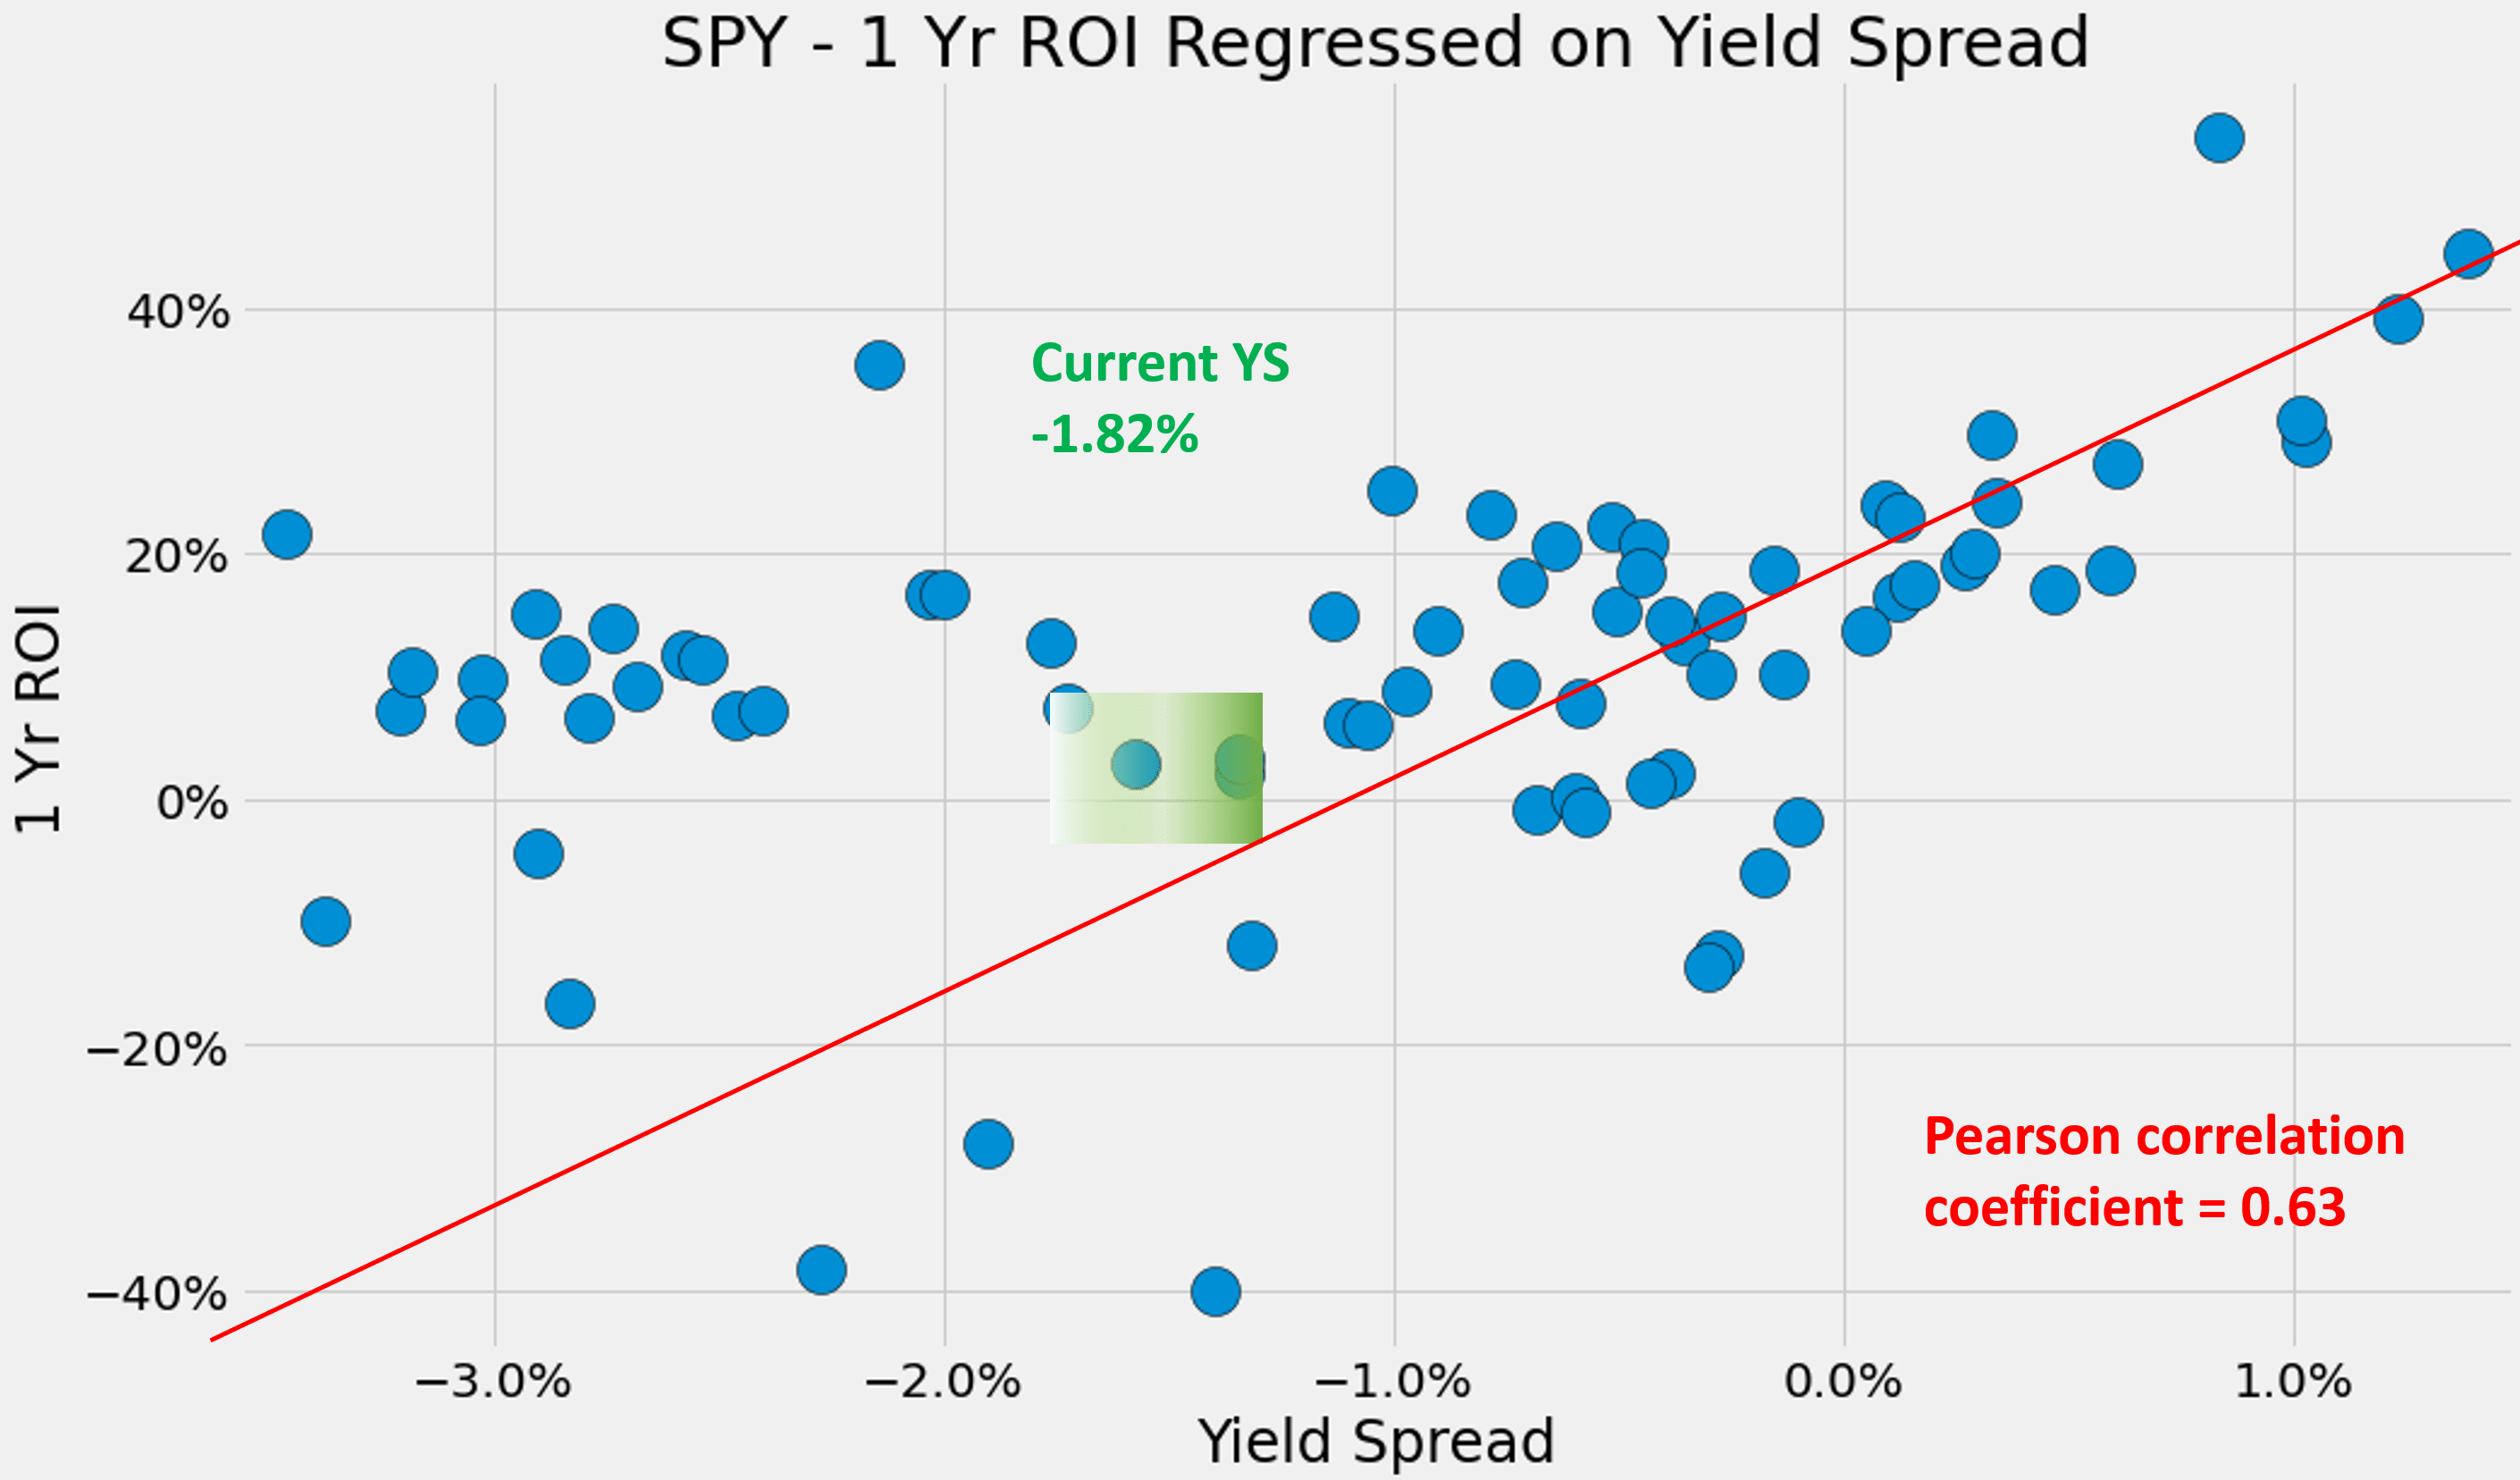
To put things into context, the second chart below shows the 1-year total return of SPY (including price appreciation and dividend yield) regressed on YS using the data since 2002. As seen, there is a positive correlation between the total return and the YS (the Pearson correlation coefficient is mildly strong at 0.63).
Here I want to draw your attention to the data points highlighted in the green box, for the YS in the vicinity of -1.8% (which is about the current YS as of this writing and also the projected YS for 2023 as just mentioned). As seen, historically, when YS is near this range, the 1-year return has been indeed very close to 0%, providing a piece of supporting evidence to the 4,068 forecasts.
Source: Author Source: Author based on Seeking Alpha data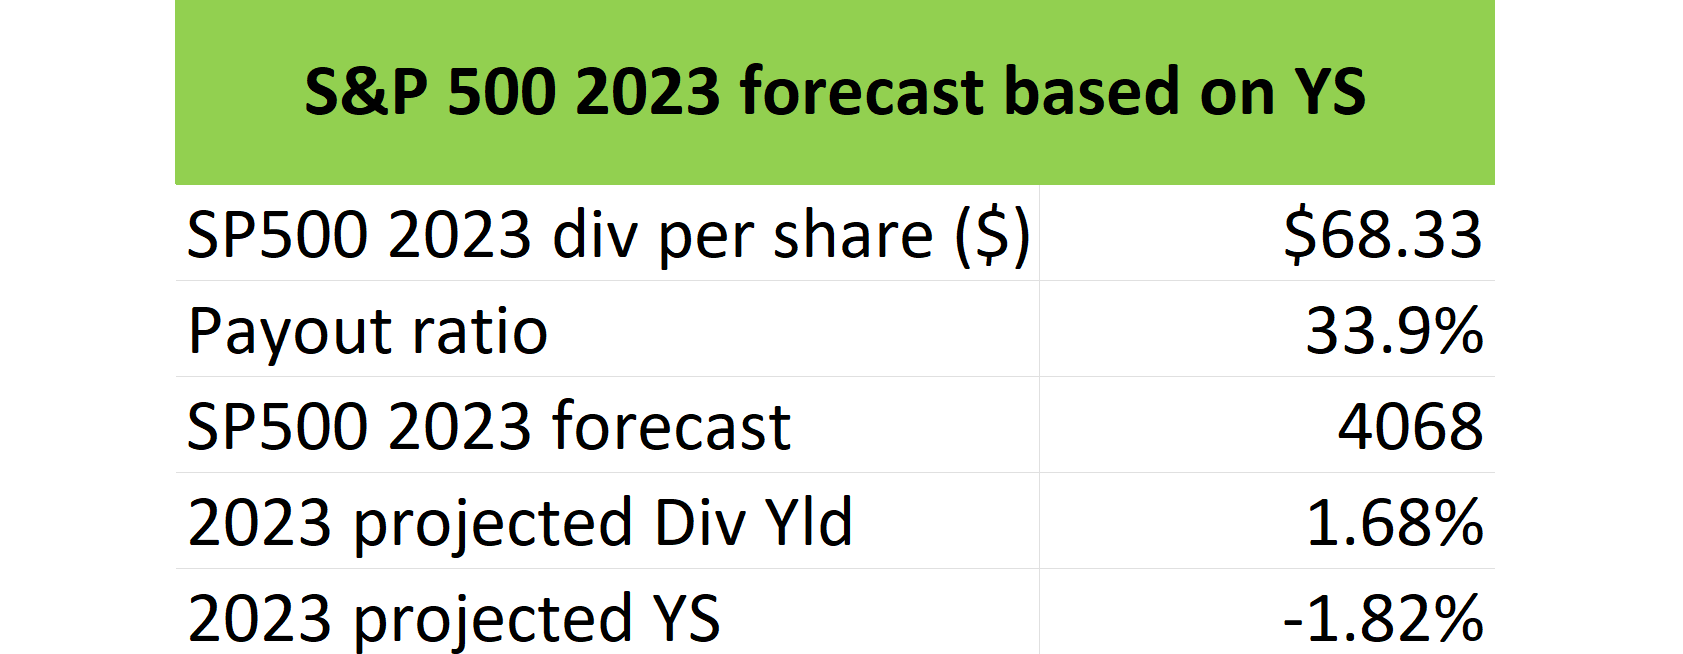
Risks and final thoughts
To conclude, this article presents a forecast of 4,068 for the S&P 500 in 2023, about 6.2% above the current level. The forecast was made using two independent approaches: one based on the concept of excess CAPE yield and the other based on dividend yield spread. Both approaches rely only on intuitive concepts, timeless principles, and easily obtained data.
The forecast of course is subject to macroscopic risks and uncertainties such as inflation, geopolitical risks, currency exchanges, and interest rates. These risks have been detailed in our past article and also by other SA authors. And I won’t further belabor those points. Here, I will just comment on the YS method used. As mentioned, the YS analysis also provides an estimate of the uncertainties of my forecast. And it is my view that for any forecast, the error bars are as important as the forecast itself. And as you can see from the last chart above, when the yield spread is near the current range, there is a bit of scattering in the historical data even though they are all clustered around 0% total return in 1 year. Upon closer look, the 1-year return is scattered between 0.8% to 6.3% in the next year among these few data points, providing a sense of the risks and uncertainty involved in my estimates.
Be the first to comment