

hernan4429
I wish you a happy new year – and remember, money doesn’t make you happy and money isn’t everything. That being said: Don’t expect to make astronomical profits in 2023 or going to the moon – these times are over, and it is difficult for me to be optimistic about the stock market in 2023. Actually, don’t expect to make any money in 2023 – and you won’t be disappointed.
We are witnessing a terrible combination of several early warning indicators calling for a recession, the stock market still being extremely overvalued (despite a decline of 20% to 30%) and many economies all around the world being at the end of a long-term debt cycle. This is a combination making investing in the stock market a difficult task in the years to come – and will lead to a completely different picture from the last few years.
Where We Are
We start by looking at some metrics that can be early warning indicators for a recession and in my opinion the picture looks grim. We start with the most reliable indicator that has predicted every recession in the last decades with high accuracy (and no false signals) – the inverted yield curve (or to be more precise the 10-year minus 3-month treasury yield). At the time of writing, the ratio is at -0.54 and it has been at similar low levels before the Dotcom Bubble or the Great Financial Crisis. Right now, this is one of the clearest warning signals that the United States will be hit by a recession in 2023 with a high probability.
FRED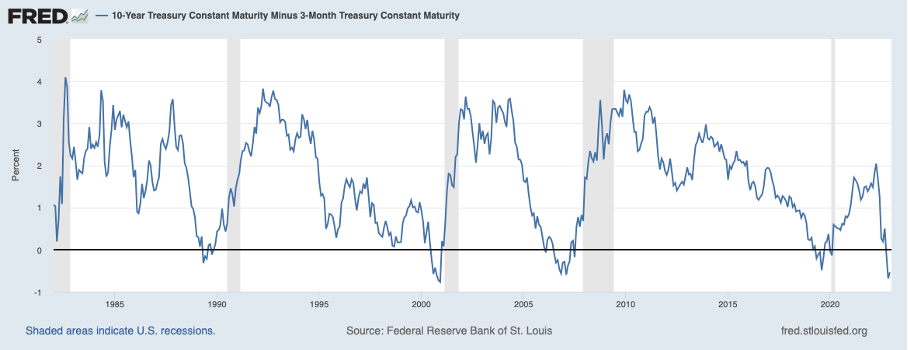
A second warning sign are the housing permits. And the number is already decelerating fast. While it peaked in December 2021 with 1.896 million new housing permits, the permits in November 2022 were only 1.342 million – this is a decline of 29%. And I assume the number will decelerate further in 2023. We don’t know if the situation will be as worse as in 2005 till 2009 but back then the number of housing permits declined almost 80%.
FRED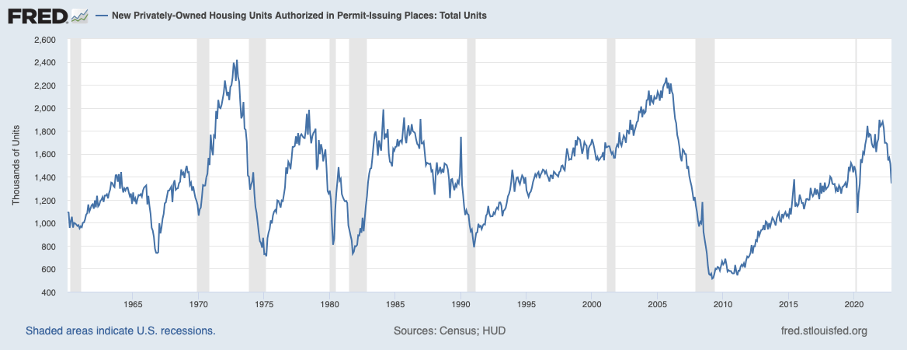
And a third warning sign we can highlight right now is the ISM Purchasing Manager Index, which fell below 50 in November 2022 and a number below 50 is usually indicating trouble. In November 2022 it was 49, consensus for December 2022 is now 48.5. When looking at the long-term development of the ISM we can also see that a reading below 50 is not a warning sign for a recession by itself. But in combination with all the other metrics, it is indicating trouble.
ISM Purchasing Manager Index (Trading Economics)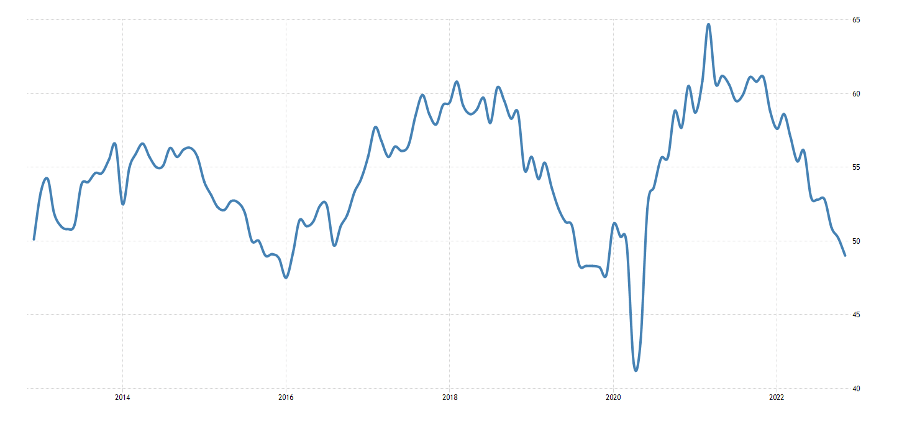
Valuations: Still Extreme
And aside from the economy heading towards a recession, the stock market is faced with a second problem, which is increasing the risk for a brutal bear market and a steeply declining S&P 500 (SP500). The current valuation levels for the S&P 500 – despite a 20% decline from previous all-time highs – are still too high.
The problem is – and I don’t want to blame FactSet Research (FDS) here – that we are often looking at the last 5 or last 10 years and make conclusion about average performance numbers. I also am to blame as I also look often at the last 10 years (in some cases it is not so easy to get more data). And when we are looking at the last 5 years or the last 10 years, the U.S. stock market might seem reasonably valued as we are trading at or even below 5-year or 10-year average P/E ratios.
FactSet Earnings Insights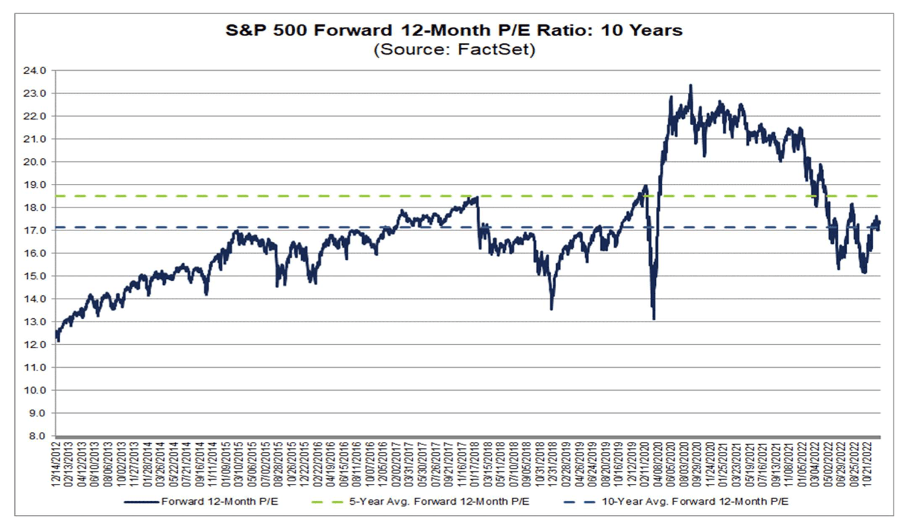
We see that the forward P/E ratio is below the 5-year average and at a similar level as the 10-year average and we reach the conclusion that the stock market is not so overvalued. We reach the conclusion that the stock market is neither cheap nor expensive and there are solid arguments for higher stock prices at this point.
But we make several crucial mistakes here. First mistake is using the forward P/E ratio which is based on earnings estimates and despite clear warning signs for a steep recession, analysts are still expecting higher earnings per share in 2023 than in 2022. They assume lower earnings for Q4/22 and Q1/23 but for the second half of 2023 analysts are assuming a higher EPS than before. By the way: this is turning the argument of the “most-advertised recession” upside down. As long as analysts are expecting higher earnings per share in 2023, we should not conclude that everybody is expecting a recession.
FactSet Earnings Insights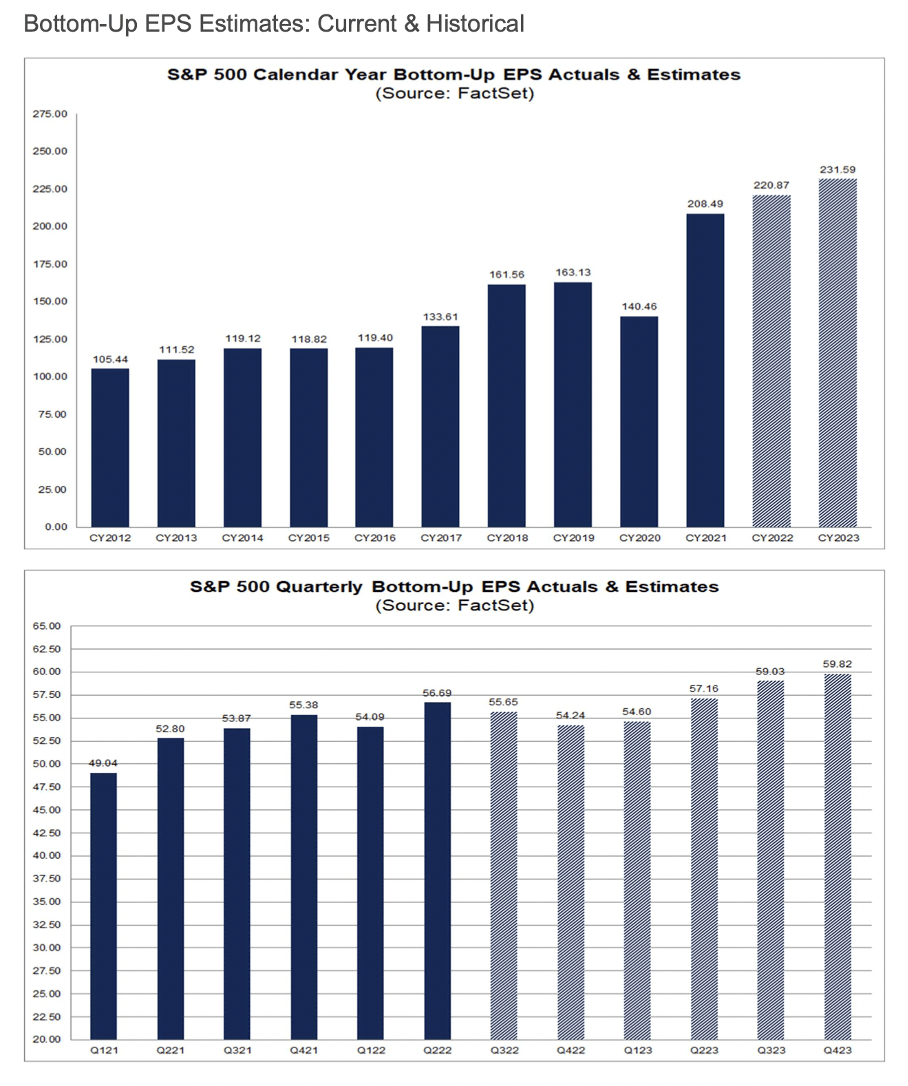
And a second mistake – aside from using too optimistic earnings per share assumptions – is using P/E ratios of the last ten years to determine what a realistic valuation multiple might be. It is not enough to look at the last 10 years to realize what a historic outlier stock market valuations in the last ten years have been. It is actually not even enough to look at the last two or three decades – we have to zoom out much more. Only when looking at the last 50, 100 or 150 years we realize that the last three decades have been rather atypical.
Author’s work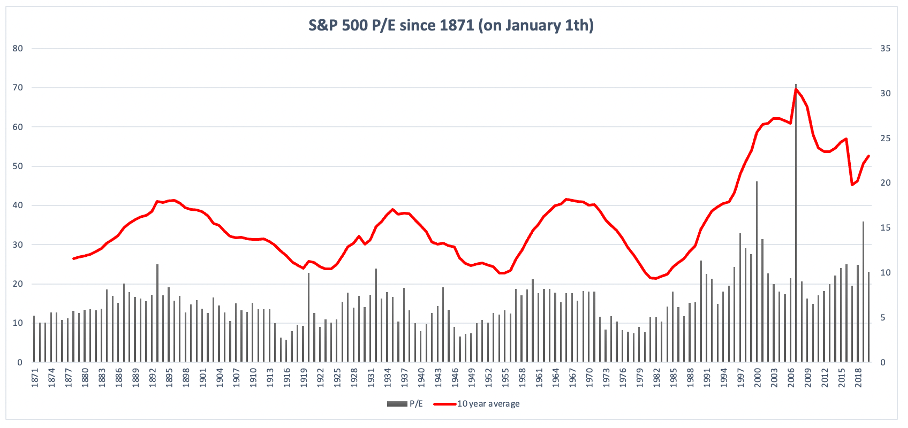
The S&P 500 peaked at a CAPE ratio above 38 in November and December 2021. And since then, the CAPE ratio has declined to about 28 right now. But we should not forget and not ignore that this is still an extremely high CAPE ratio and higher than during many other cyclical stock market peaks. And at 90.8% of the time the S&P 500 has been trading at lower prices in the last roundabout 150 years.
Advisor Perspectives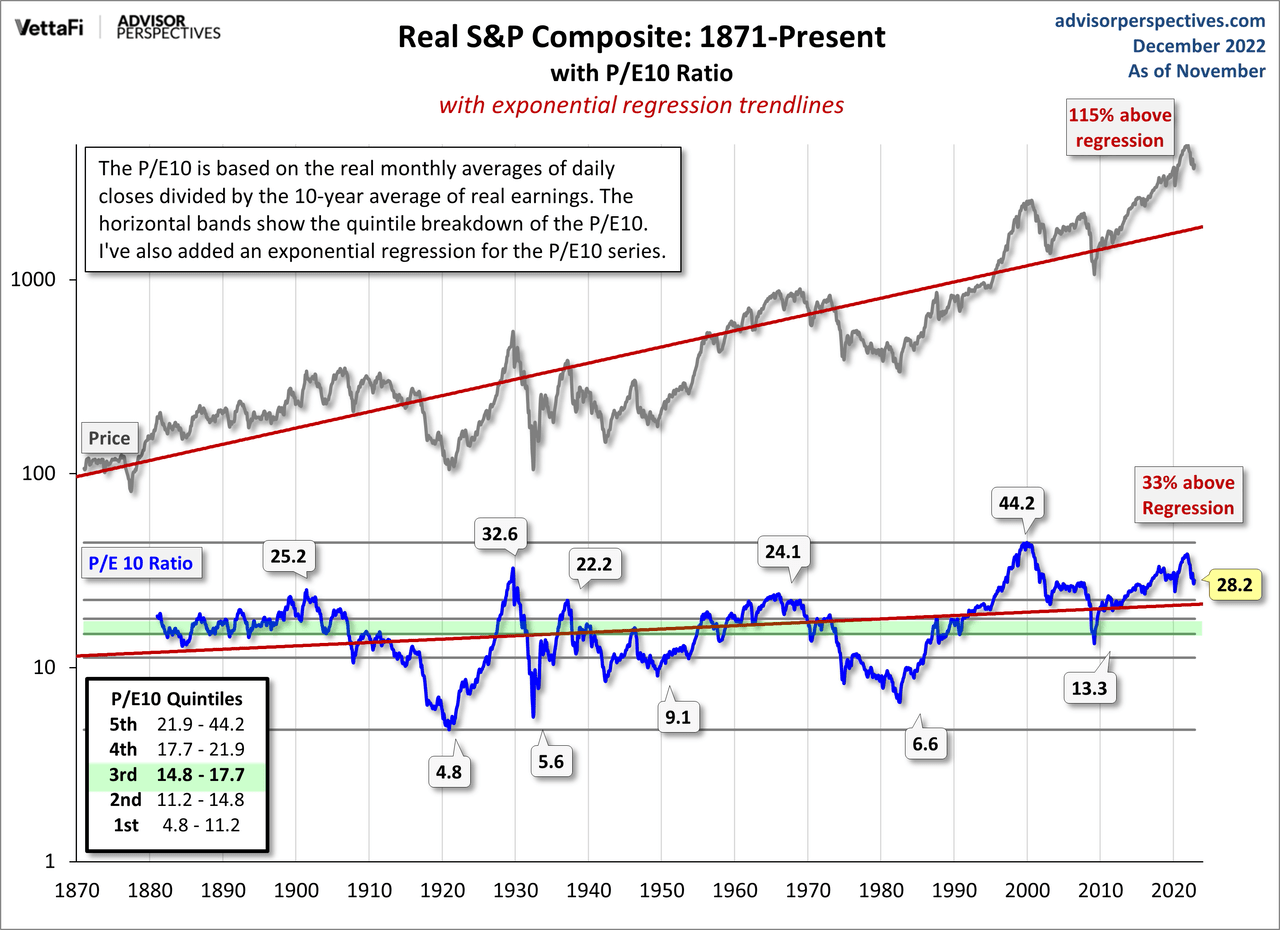
Already In A Bear Market
At the time of writing, the S&P 500 is trading 20.5% below its previous all-time high and a decline below 20% is usually seen as a bear market. And while the Dow Jones Industrial Average (DIA) is trading only 10.4% below the previous all-time high, the Nasdaq-100 (QQQ) is already trading 34.7% below the previous all-time high. And not only are valuation levels at record highs (or have been a year ago), we are also close to the end of a long-term cycle: extreme debt levels (especially federal debt), interest rates close to zero and the FED having to use aggressive quantitative easing to keep the economy under control are not good signs. And now the FED has to fight hard to keep inflation under control – which led to the abrupt shift to quantitative tightening.
As consequence, we have to expect a hard landing for the economy as I have written in my article “When Stanley Druckenmiller Talks It Pays To Listen”. And mistakes the FED made in the past few years generated many problems:
The loose monetary policy created many other problems — it changed the behavior of people and investors. Behavior always was different during asset bubbles. For example, the level of fraud is going up or we see so-called zombie companies that manage to stay alive although they should already have been forced to declare bankruptcy.
We never know what might happen, but at this point it seems just very unlikely that the FED will be able to manage a soft landing for the economy. The different crises that reinforce each other seem just to complex and too massive and it would almost be a miracle if government and central banks would manage to get us out of this mess with just a few scratches.
Where We Go
In another Medium article I already outlined the targets I am seeing for the S&P 500. And I don’t know if we will hit the targets already in 2023 as a steep crash is one possibility while a slow and steady decline over several years is also a possibility.
When looking for potential support levels in the chart, we can identify two major regions where the S&P 500 could bottom in a bear market. In the range between 2,130 and 2,250 we find a first strong support level for the S&P 500. In this region we can find the COVID-19 low of March 2020. Combined with the highs of 2015 we are creating a strong support level. Additionally, we find the 38.2% Fibonacci retracement at that level as well as the 200-months simple moving average. All in all, this would result in a 55% decline and create a strong support level for the S&P 500.
Monthly Chart S&P 500 with support levels (TradingView)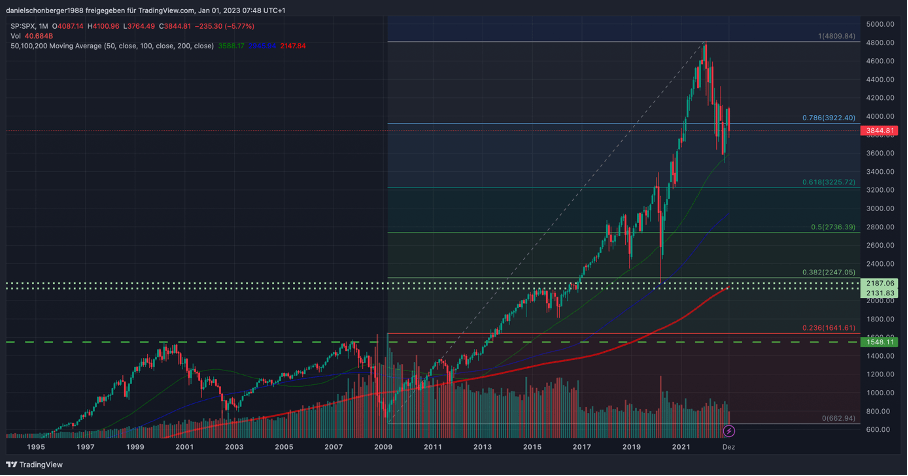
I realize this decline might already sound steep and like a very unlikely scenario for many, but I actually assume an even steeper decline and in my opinion the stock market will find its bottom around 1,600. This is a second strong support level and at this price level we find the 23.6% Fibonacci retracement of the last upward wave. Additionally, we have the highs of the Dotcom bubble and the peak before the Great Financial Crisis. This would result in the S&P 500 losing 66% of its previous value. And although such a decline seems unlikely as it would be the steepest decline since 1929, a decline to the 666-point low in 2009 is also a possibility.
Never, Never, Never
Many might see these targets as completely unrealistic, and I am also aware that many see the market close to a bottom. But let me provide you with some perspective:
- In the last 150 years, the stock market has never bottomed at a CAPE ratio of 28 (at such valuation levels, the stock market usually had its top).
- At least since 1980 (I don’t have older data), the stock market has not bottomed with the 10-year minus 3-months treasury yield still being negative. Usually, the stock market has bottomed when this ratio was at its highest (around 3 to 4; in 1990 the stock market bottomed with the ratio being 1.3).
- Since the mid 1960s (once again, I don’t have older data) the stock market also never bottomed with initial unemployment claims not being substantially higher than at the cycle low (substantially higher can be defined as at least 50% higher, in some cases the number was two or three times higher than before).
- And the stock market (almost) never bottomed with the CPI (year-over-year percentage change) still being near its cycle high. In almost every recession the inflation ratio came down steeply before the stock market bottomed (in most cases it was at least cut in half). 1990 was the exception with the stock market bottoming with a high inflation rate.
- And going hand-in-hand with the CPI data, the FED (almost) always had turned over long before the market bottomed and started lowering the Federal Funds Rate again. 1990 would once again be the exception. In every other recession since the early 1970s, the FED has started to cut rates before the bottom occurred.
What To Do
And of course, we can try to adjust to this market environment – for example by shorting equities. I personally stopped shorting the market – especially as the last few years taught me that irrational exuberance can last for a long time (and another correction and bullish upward wave is not unlikely).
We can also try to identify stocks that might perform quite well in the next few quarters. A good starting point might be undervalued, recession-resilient businesses. In my opinion, companies from the healthcare sector could be mentioned here. Names like Walgreens Boots Alliance (WBA) or CVS Health (CVS) as well as the German company Fresenius SE (OTCPK:FSNUF) might be good examples. Another hunting ground might be beaten-down, high quality technology companies. Stocks like Meta Platforms (META) or several Chinese technology stocks might also deserve a closer look. And finally, gold (GLD) could also be an interesting play with upside potential.
Conclusion
But don’t deceive yourself – most of the stocks will trade lower at the end of 2023 than they are now. At least that is the scenario I am ascribing the highest probability to and I am seeing the S&P 500 trading rather for 2,xxx at the end of 2023 than for 3,xxx or even for 4,xxx.
All in all, the year 2023 will be challenging for investors. With several early warning indicators showing clear signs for a recession and the U.S. indices still trading for extremely high valuation multiples, I see a huge downside risk for U.S. equities. And not only is the S&P 500 still trading for unreasonably high valuation multiples, but the stock market has almost never bottomed in the current market environment (high CPI, FED still raising rates, inverted yield curve). As a result, I can only be bearish about the stock market for 2023 (still not forgetting that we are always dealing with probabilities in investing and no certainties). I also don’t know how low we might fall, but we should be prepared for the S&P 500 declining at least to a range between 2,200 and 1,600 points. And I don’t know when we will reach a bottom: We should be prepared for a painful multi-year bear market. Finally, it might take more than a decade before we reach 2021 levels again.
Be the first to comment