

Deagreez/iStock via Getty Images
It’s been a tough year for investors, we don’t need anyone to tell us that, we’ve been living it.
In fact, on June 16th, when the S&P hit -24.5% from its highs, investor sentiment as measured by Bank of America’s indicator, hit 0.0.
The last time it was this low was in March 2020, during the pandemic, when the economy was locked down and fears of another Great Depression were rampant.
Does that mean that last week’s 7% rally for stocks was the bottom? Or just another bear market “sucker rally”?
Ycharts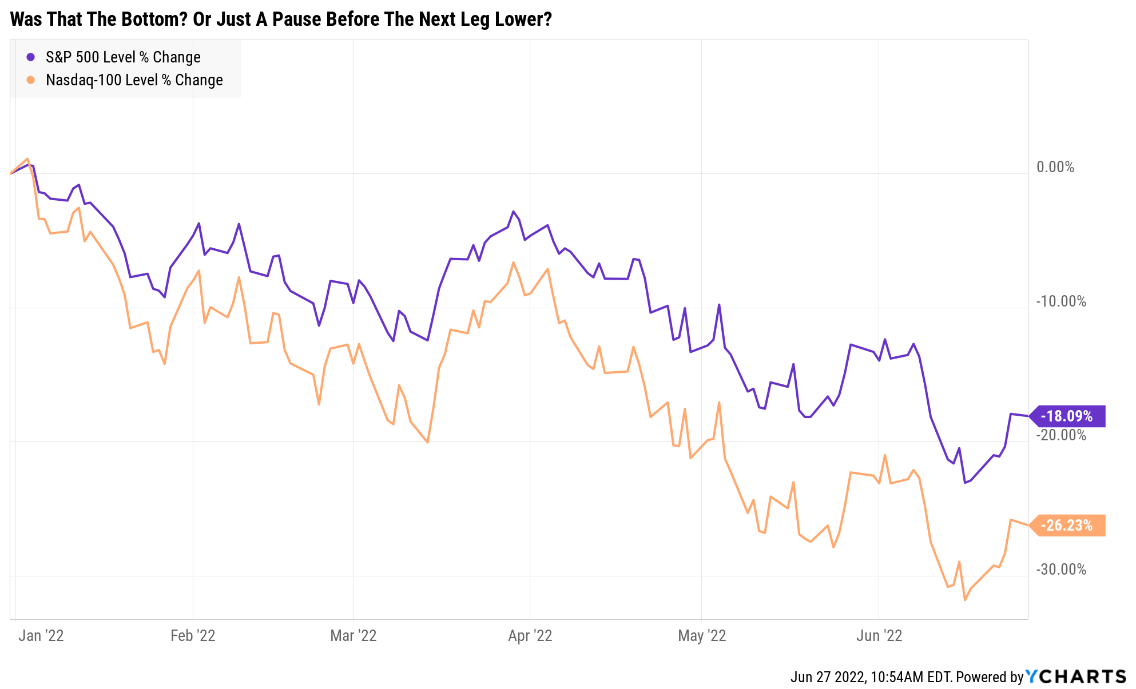
JPMorgan has some potentially good news for anyone needing a reprieve from the selling.
The end of the quarter and semi-annual rebalancing, combined with 5X lower liquidity than we normally see at this time of year, means that stocks COULD soar as much as 7% this week.
What about whether or not that was the bottom of the entire bear market?
Daily Shot 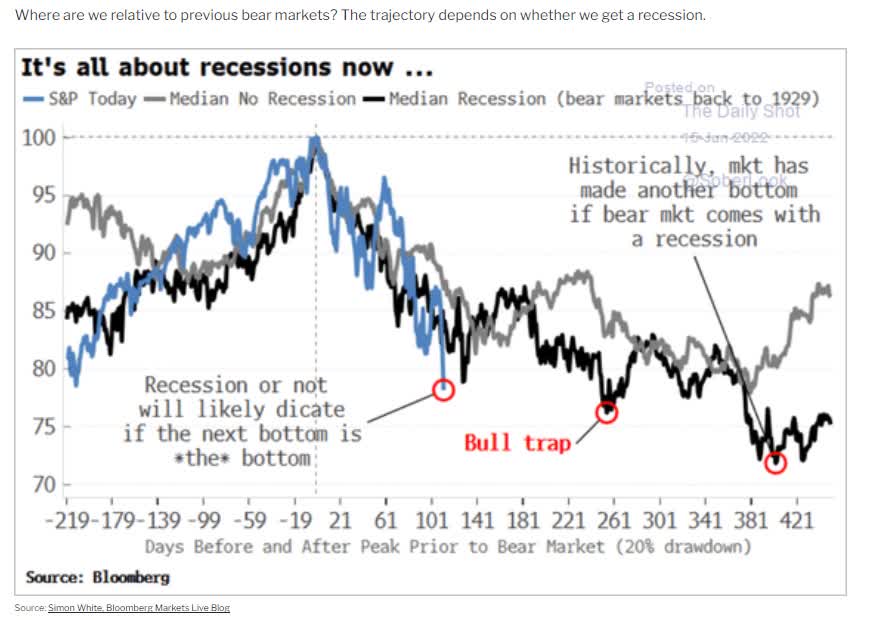
Historically speaking, if we don’t get a recession, it COULD have been the bottom.
If we do get a recession, then historically we would expect one more bear market rally to fail before we fall to the ultimate bottom.
Of course, the economy could always prove us wrong, and Goldman Sachs, one of the 16 most accurate economic teams in the world (part of the blue-chip consensus), thinks we’ll avoid an outright recession.
Bank of America does too, though they expect close to zero growth next year, 3% inflation, and a 4% Fed funds rate.
But as Michael Batnick recently said on the Animal Spirits podcast:
“In 10+years, you won’t remember if you bought near the actual bottom, because the results will be similar to if you had.”
Consider this. If you buy a blue-chip you love at the best valuations in years, and it falls another 10% what would you have gained by nailing the exact bottom?
- 11% higher returns
- 0.2% higher annual returns over 30 years
By not being willing to be “greedy when others are fearful” you potentially risk missing out entirely on the ability for Buffett-like returns from blue-chip bargains hiding in plain sight.
And for what? An extra 11% returns? Even if stocks fall another 20%, that’s just 25% higher returns over time. Over your investing lifetime, 25% will hopefully look like a rounding error.
That’s why I practice regret minimization and use the Dividend Kings Correction Planning tool to have my watchlist of some of the world’s best companies ready at all times.
At -5% I bought some blue-chips. At -10%, at -15%, at -20% and on June 16th, again at -25%.
“I never buy at the bottom and I always sell too soon.” ~ Baron Nathan Rothschild
“It’s better to be approximately right, than precisely wrong.” – Warren Buffett
If stocks fall to -30%, -35%, or even -40%, I’ll keep buying whenever my rules tell me to.
If you buy at 5% market decline increments, you are guaranteed to always be buying within 5% of the ultimate bottom.
In other words, I’ve 100% automated my bear market buying.
- I never have to wonder what companies to buy
- I never have to wonder how many shares to buy
- I never have to wonder when to buy or how much
When the time is right, I just follow my long-term plan, and buy what I believe to be the world’s greatest companies at reasonable to attractive valuations.
Today, I wanted to highlight two more bear market blue-chip buys I made on June 16th that are still attractive today, that could be just what your portfolio is looking for.
British American (BTI): The Growth King Of Tobacco
A full deep-dive analysis of BTI’s long-term thesis, risk profile, growth potential, valuation, and total return potential:
FactSet Research Terminal FactSet Research Terminal FactSet Research Terminal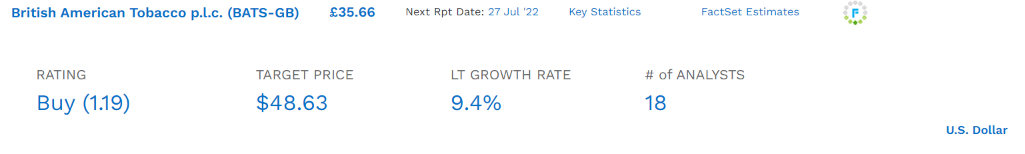

With the war in Ukraine smashing PM’s long-term growth outlook (down from 11% pre-war), BTI has taken over as the growth king of the industry, according to both analysts and management guidance.
- BTI’s growth guidance is 7% to 9% CAGR
So for anyone looking for both very safe yield and the best long-term income growth prospects, BTI is the #1 choice among Ultra SWAN quality tobacco companies.
Reasons To Potentially Buy BTI Today
- 84% quality low-risk 13/13 Ultra SWAN quality global aristocrat
- 82% dividend safety score
- 6.7% very safe yield
- zero tax withholdings (UK company)
- 23+year dividend growth streak
- 0.5% average recession dividend cut risk (mild recession expected in 2023)
- 2.0% severe recession dividend cut risk
- 33% undervalued (potential very strong buy)
- Fair Value: $66.14
- 9.7X forward earnings vs 13X to 14X historical
- 9.1X cash-adjusted earnings
- BBB+ negative outlook credit rating = 5% 30-year bankruptcy risk
- 72nd industry percentile risk management consensus = good
- 6% to 10% CAGR margin-of-error growth consensus range
- 9.4% CAGR median growth consensus
- 7% to 9% management growth guidance
- 5-year consensus total return potential: 17% to 21% CAGR
- base-case 5-year consensus return potential: 17% CAGR (more than 2X S&P consensus)
- consensus 12-month total return forecast: 24%
- Fundamentally Justified 12-Month Returns: 57% CAGR
BTI 2024 Consensus Total Return Potential
FAST Graphs, FactSet FAST Graphs, FactSet 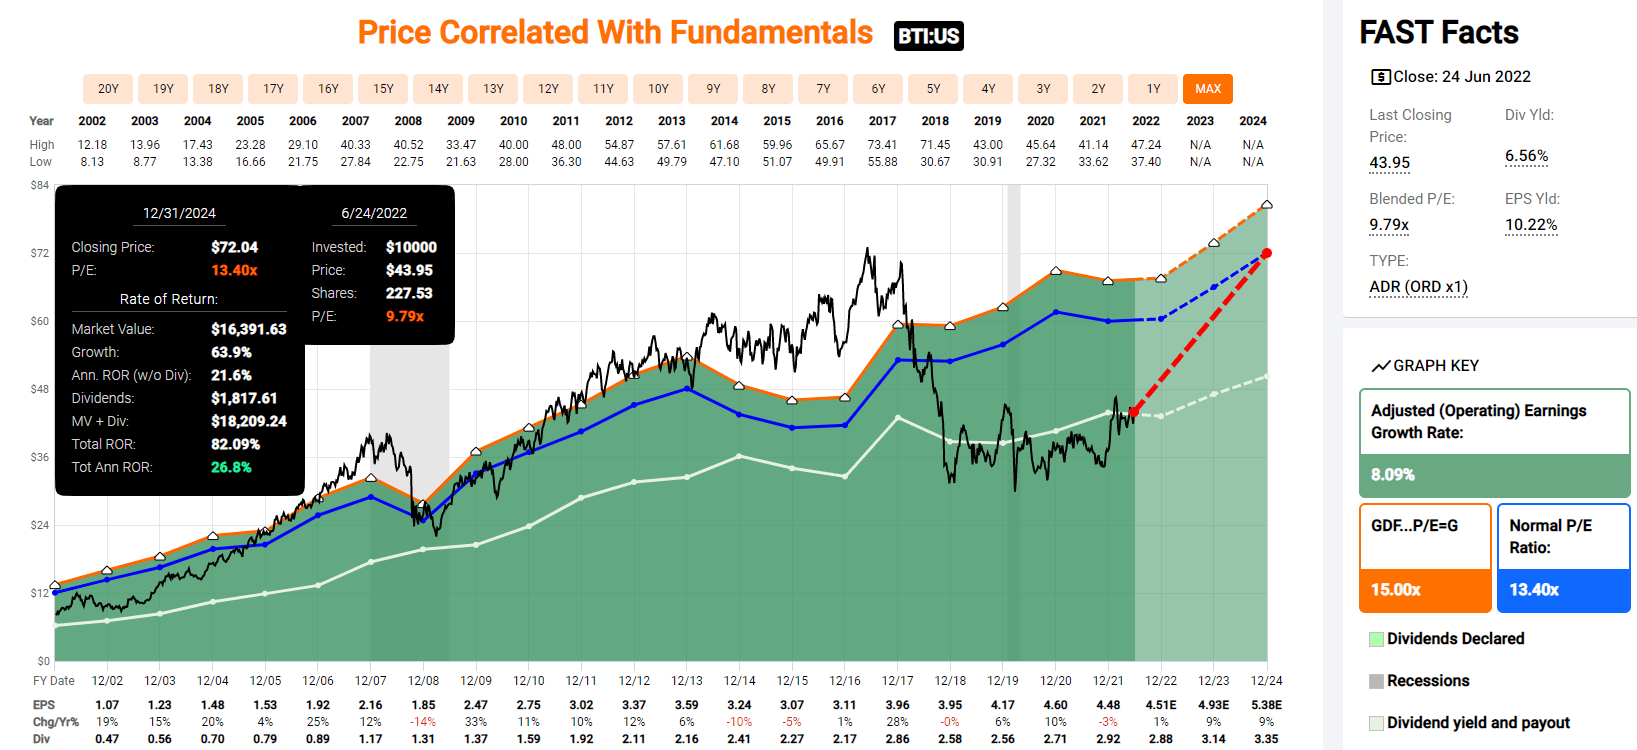
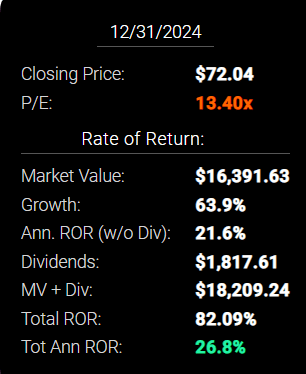
If BTI grows as expected through 2024 and returns to historical mid-range fair value, then investors would see 82% total returns or 27% annually.
- Buffett-like returns from a safe ultra-high-yield blue-chip bargain hiding in plain sight
BTI 2027 Consensus Total Return Potential
FAST Graphs, FactSet FAST Graphs, FactSet 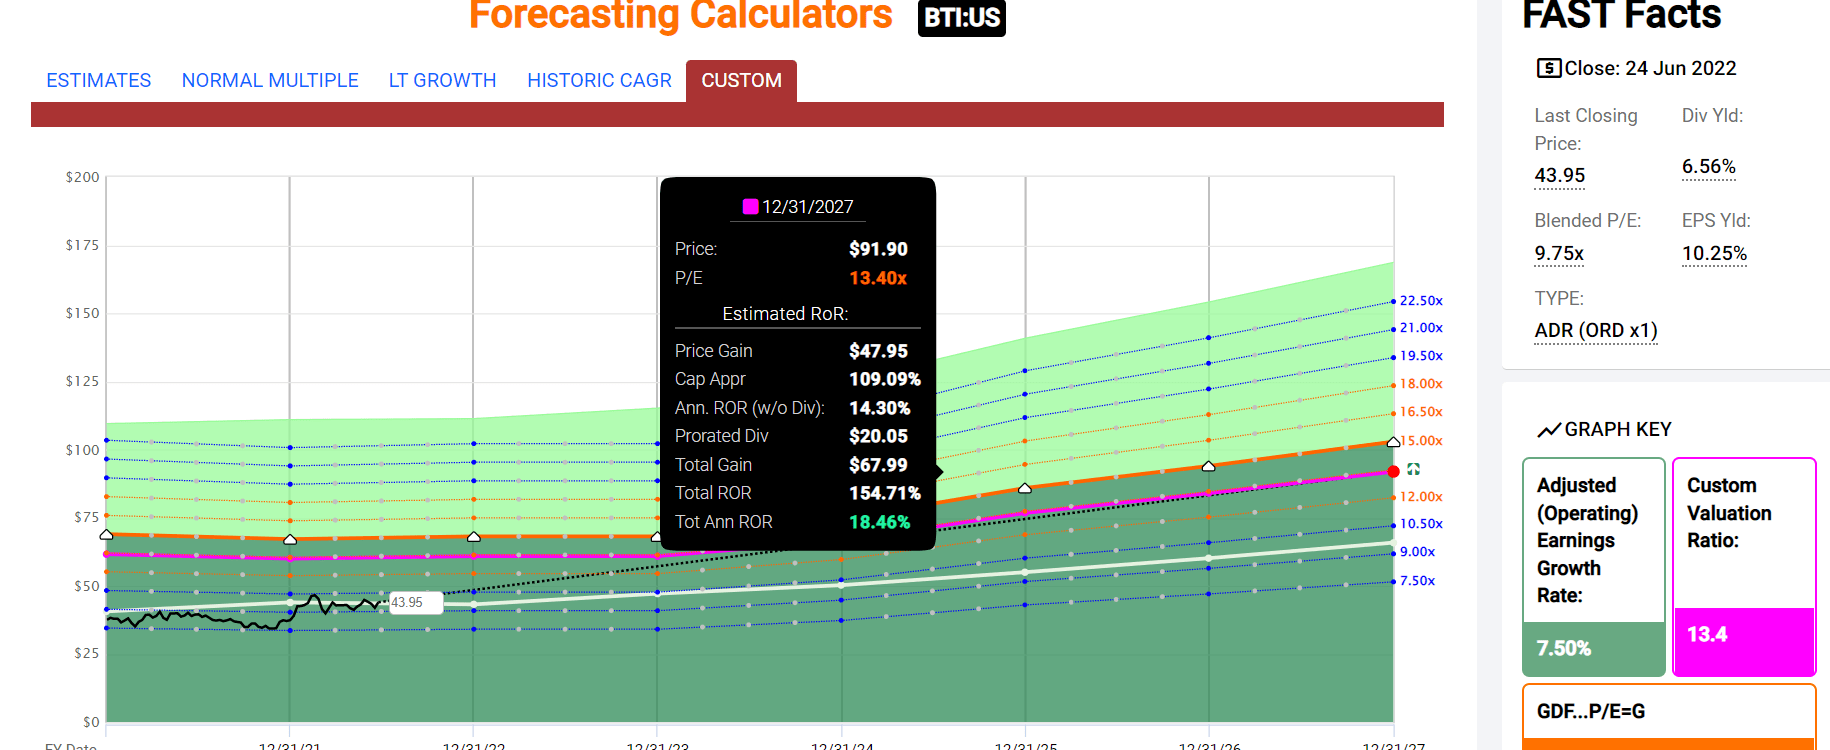
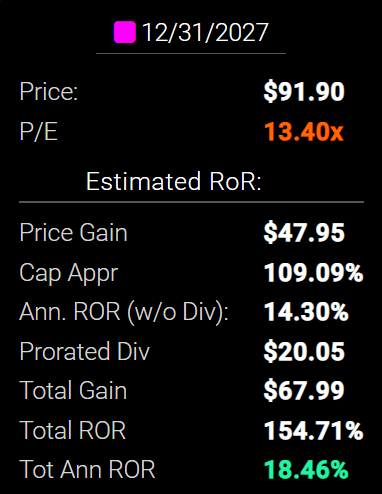
By 2027, if BTI grows as expected and returns to historical fair value, it could deliver 155% total returns or 19% annually.
- more than 2.5X the S&P 500 consensus
- Buffett-like return potential
BTI Long-Term Consensus Total Return Potential
| Investment Strategy | Yield | LT Consensus Growth | LT Consensus Total Return Potential | Long-Term Risk-Adjusted Expected Return | Long-Term Inflation And Risk-Adjusted Expected Returns | Years To Double Your Inflation & Risk-Adjusted Wealth |
10-Year Inflation And Risk-Adjusted Expected Return |
| British American Tobacco | 6.7% | 9.4% | 16.1% | 11.3% | 8.8% | 8.2 | 2.32 |
| Safe Midstream | 6.3% | 6.4% | 12.7% | 8.9% | 6.4% | 11.2 | 1.86 |
| High-Yield | 3.1% | 12.7% | 15.8% | 11.1% | 8.6% | 8.4 | 2.28 |
| Dividend Aristocrats | 2.4% | 8.5% | 10.9% | 7.6% | 5.2% | 14.0 | 1.65 |
| S&P 500 | 1.8% | 8.5% | 10.3% | 7.2% | 4.7% | 15.2 | 1.59 |
| Nasdaq | 0.9% | 15.9% | 16.8% | 11.8% | 9.3% | 7.8 | 2.43 |
(Sources: Morningstar, FactSet, YCharts)
Analysts expect BTI to not only provide some of the possibly safest ultra-high-yield on Wall Street but also deliver superior returns to almost any investment strategy, almost as good as the Nasdaq.
British American Rolling Total Returns Since May 1985
(Source: Portfolio Visualizer Premium)
That’s similar to the 15.1% average annual total return it’s delivered over the last 37 years.
- 46X inflation-adjusted return vs 17.5X S&P 500
In fact, 46X inflation-adjusted returns is what analysts expect from BTI over the next 30 years.
Inflation-Adjusted Consensus Return Potential: $1,000 Initial Investment
| Time Frame (Years) | 7.6% CAGR Inflation-Adjusted S&P Consensus | 8.4% Inflation-Adjusted Aristocrats Consensus | 13.6% CAGR Inflation-Adjusted BTI Consensus | Difference Between Inflation-Adjusted BTI Consensus Vs S&P Consensus |
| 5 | $1,445.67 | $1,493.29 | $1,894.37 | $448.70 |
| 10 | $2,089.97 | $2,229.92 | $3,588.64 | $1,498.67 |
| 15 | $3,021.42 | $3,329.92 | $6,798.22 | $3,776.80 |
| 20 | $4,367.98 | $4,972.54 | $12,878.35 | $8,510.37 |
| 25 | $6,314.67 | $7,425.45 | $24,396.37 | $18,081.69 |
| 30 | $9,128.95 | $11,088.36 | $46,215.77 | $37,086.82 |
(Source: DK Research Terminal, FactSet)
If BTI grows as analysts currently expect, then it could deliver 46X inflation-adjusted returns over the next 30 years,
| Time Frame (Years) | Ratio Aristocrats/S&P Consensus | Ratio Inflation-Adjusted BTI Consensus vs S&P consensus |
| 5 | 1.03 | 1.31 |
| 10 | 1.07 | 1.72 |
| 15 | 1.10 | 2.25 |
| 20 | 1.14 | 2.95 |
| 25 | 1.18 | 3.86 |
| 30 | 1.21 | 5.06 |
(Source: DK Research Terminal, FactSet)
This is 5X more than analysts expect from the S&P 500 and 4.3X more than the dividend aristocrats.
BTI Investment Decision Score
DK Dividend Kings Automated Investment Decision Tool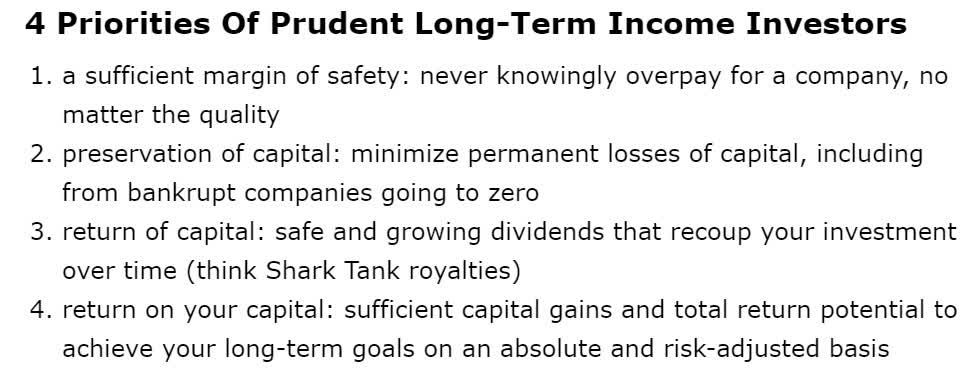
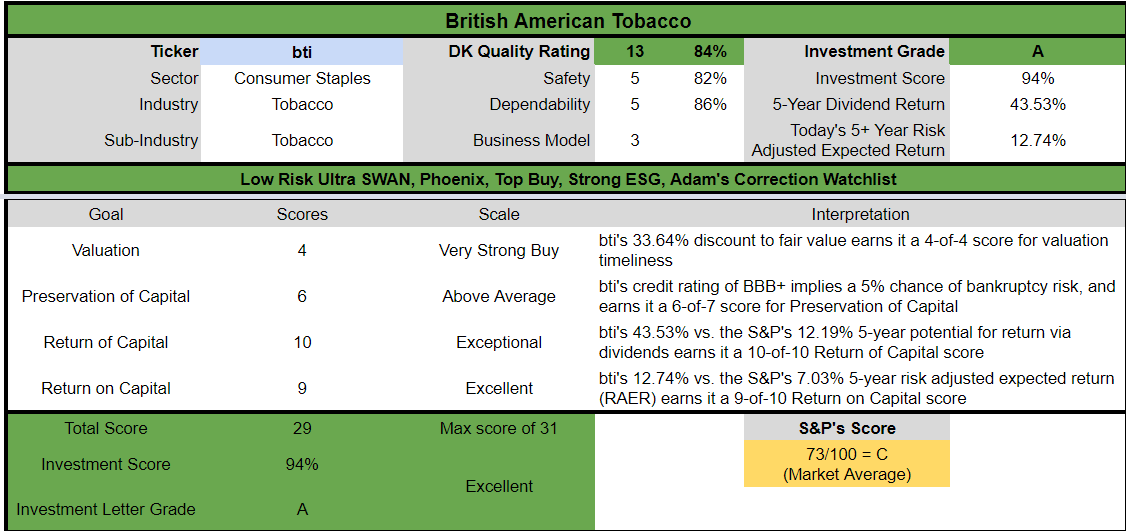
For anyone comfortable with its risk profile, BTI is one of the most reasonable and prudent ultra-high-yielding blue-chips you can buy today.
- 34% discount vs. 3% market discount = 31% better valuation
- 6.7% yield is almost 4X higher (and safer too).
- potentially 60% higher long-term return potential than S&P 500 overtime
- almost 2X better risk-adjusted expected return over the next five years
- 43% of your investment repaid in consensus dividends over the next five years (almost 4X more than the S&P 500)
Microsoft (MSFT): The Ultimate Wonderful Company At A Fair Price
A full deep-dive analysis of MSFT’s long-term thesis, risk profile, growth potential, valuation, and total return potential:
“It’s better to buy a wonderful company at a fair price, than a fair company at a wonderful price.” – Warren Buffett
Reasons To Potentially Buy Microsoft Today
- 100% quality low-risk 13/13 Ultra SWAN hyper-growth software company
- #1 highest quality company on the DK Master List
- arguably the greatest company in the world
- 100% dividend safety score
- 0.9% very safe yield
- 18-year dividend growth streak
- 0.5% average recession dividend cut risk (mild recession in 2023)
- 1% severe recession dividend cut risk
- 3% undervalued (potential good buy)
- Fair Value: $273.38
- 26.6X forward earnings vs 22X to 25.5X historical
- 17.8X cash-adjusted earnings
- AAA stable credit rating = 0.07% 30-year bankruptcy risk
- highest credit rating in America
- 85nd industry percentile risk management consensus = very good
- 10% to 22% CAGR margin-of-error growth consensus range
- 15.8% CAGR median growth consensus
- 5-year consensus total return potential: 10% to 16% CAGR
- base-case 5-year consensus return potential: 17% CAGR (more than 2X S&P consensus)
- consensus 12-month total return forecast: 34%
- Fundamentally Justified 12-Month Returns: 4% CAGR
My fellow Dividend King Nicholas Ward said in our recent Recession Q&A webinar that he considers MSFT to be the world’s greatest company.
- my safety and quality model agrees
- as close to God’s own company as exists on Wall Street
- a potentially good buy at fair value
LGGNY 2024 Consensus Total Return Potential
FAST Graphs, FactSet FAST Graphs, FactSet 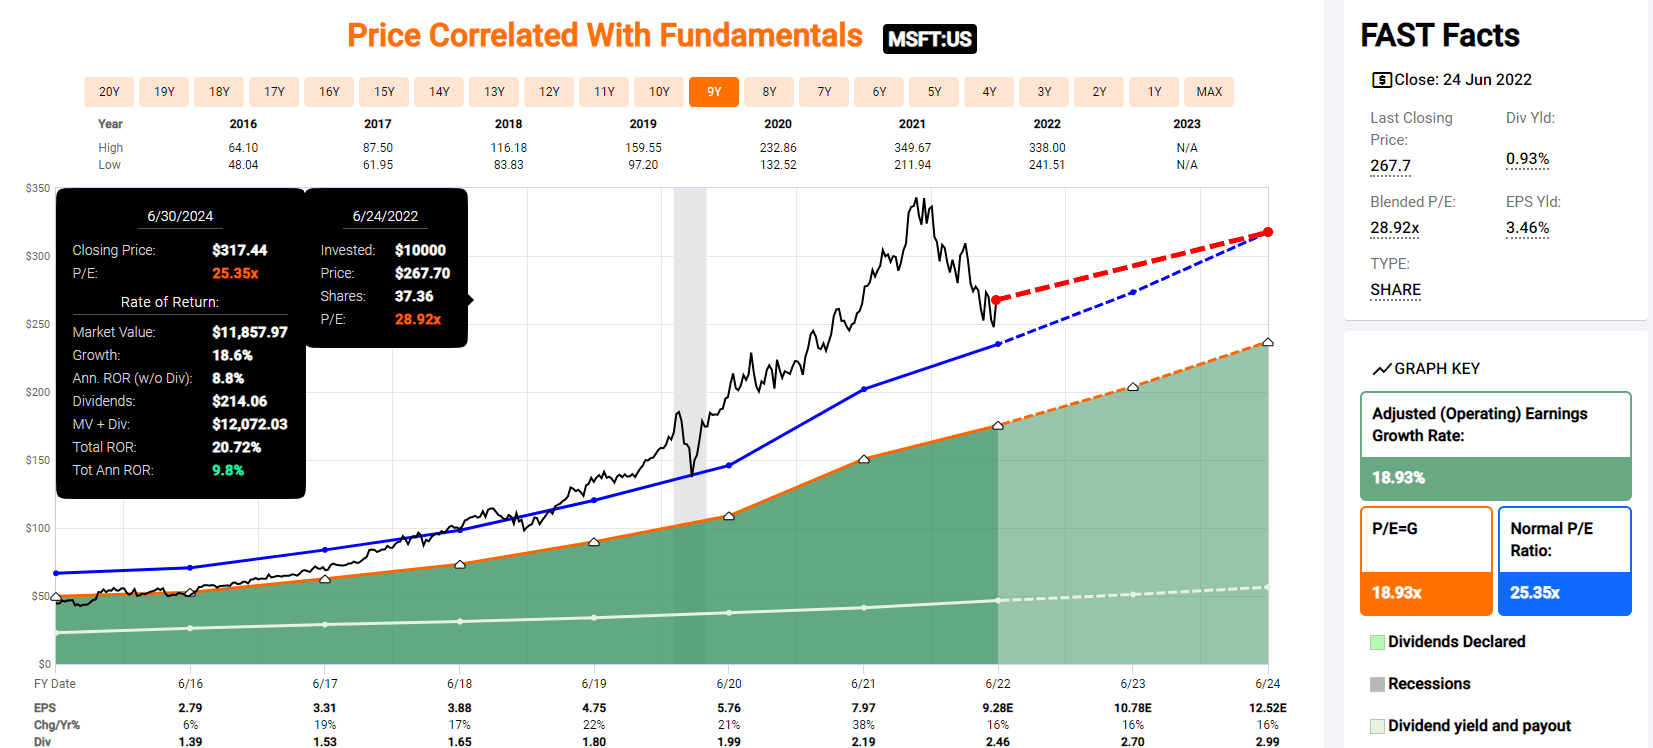
MSFT doesn’t offer exceptional return potential through 2024 merely solid high single-digit return potential.
But it’s over 5+ years where its hyper-growth really shines.
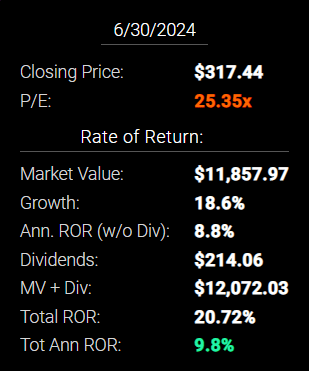
MSFT 2027 Consensus Total Return Potential
FAST Graphs, FactSet FAST Graphs, FactSet 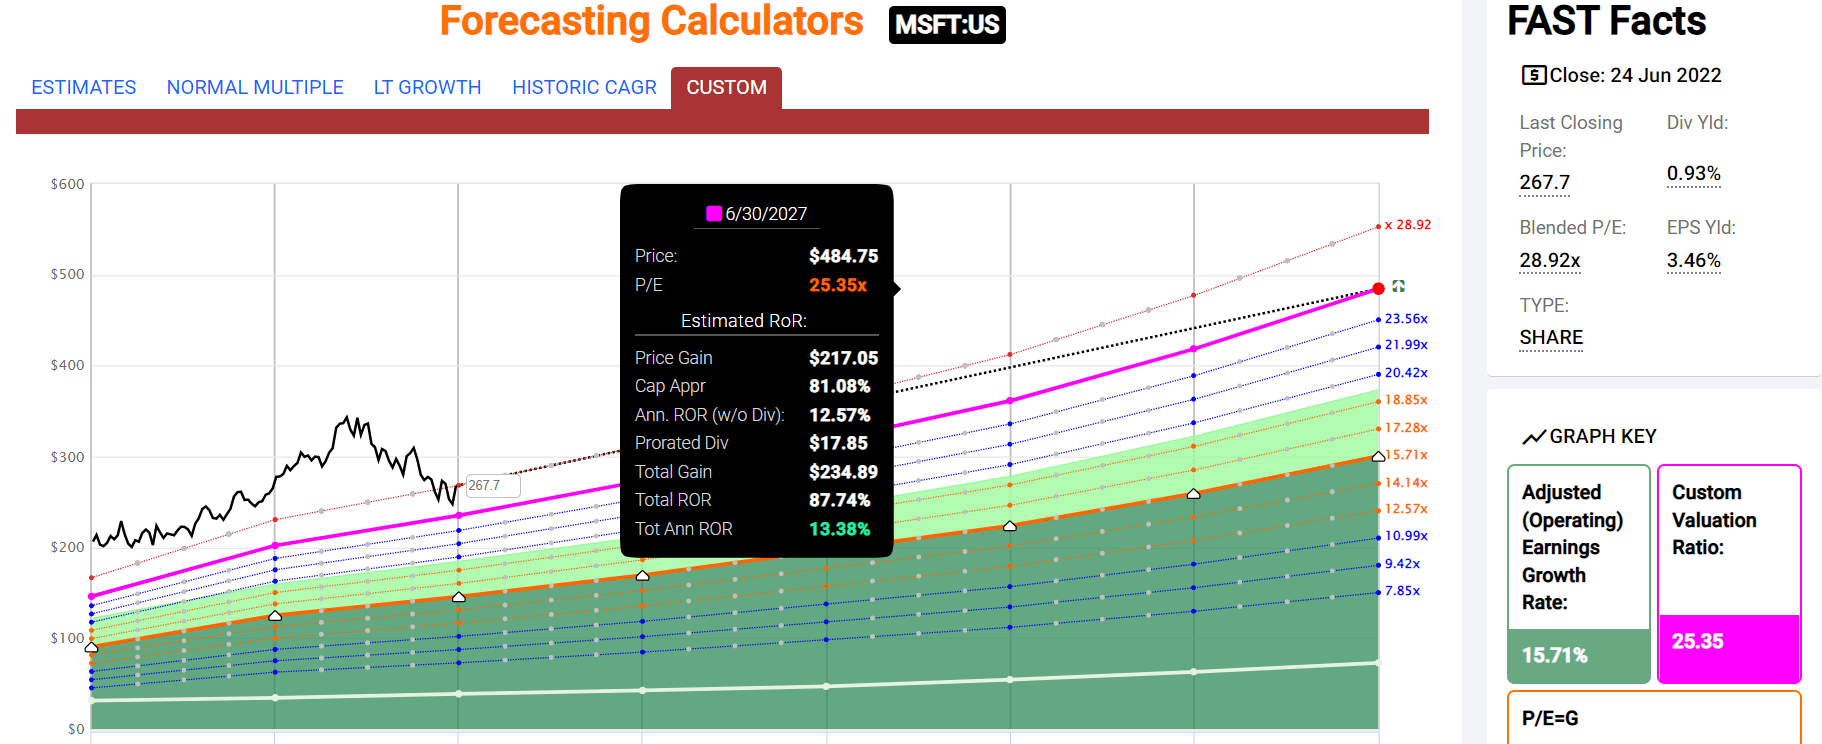
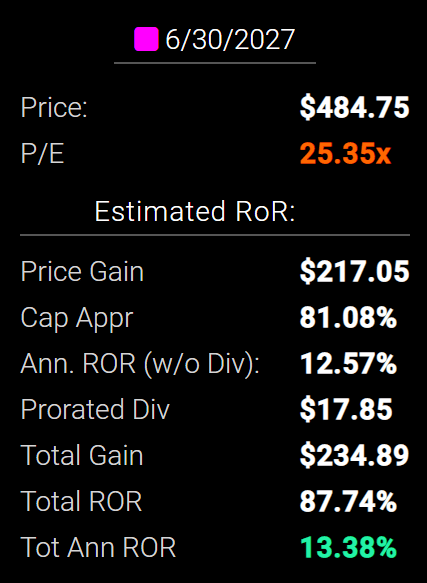
By 2027, if MSFT grows as expected and returns to historical fair value, it could deliver 88% total returns or 13% annually.
- about 25% more than the S&P 500 consensus
And take a look at what owning MSFT over the long-term could deliver.
MSFT Long-Term Consensus Total Return Potential
| Investment Strategy | Yield | LT Consensus Growth | LT Consensus Total Return Potential | Long-Term Risk-Adjusted Expected Return | Long-Term Inflation And Risk-Adjusted Expected Returns | Years To Double Your Inflation & Risk-Adjusted Wealth |
10-Year Inflation And Risk-Adjusted Expected Return |
| Nasdaq | 0.9% | 15.9% | 16.8% | 11.8% | 9.3% | 7.8 | 2.43 |
| Microsoft | 0.9% | 15.8% | 16.7% | 11.7% | 9.2% | 7.8 | 2.42 |
| Dividend Growth | 2.0% | 11.5% | 13.5% | 9.5% | 7.0% | 10.3 | 1.96 |
| Dividend Aristocrats | 2.4% | 8.5% | 10.9% | 7.6% | 5.2% | 14.0 | 1.65 |
| S&P 500 | 1.8% | 8.5% | 10.3% | 7.2% | 4.7% | 15.2 | 1.59 |
(Sources: Morningstar, FactSet, YCharts)
Analysts expect MSFT to deliver almost 17% long-term returns with just 0.07% fundamental risk.
Inflation-Adjusted Consensus Return Potential: $1,000 Initial Investment
| Time Frame (Years) | 7.6% CAGR Inflation-Adjusted S&P Consensus | 8.4% Inflation-Adjusted Aristocrats Consensus | 14.2% CAGR Inflation-Adjusted MSFT Consensus | Difference Between Inflation-Adjusted MSFT Consensus Vs S&P Consensus |
| 5 | $1,445.67 | $1,493.29 | $1,944.92 | $499.24 |
| 10 | $2,089.97 | $2,229.92 | $3,782.70 | $1,692.73 |
| 15 | $3,021.42 | $3,329.92 | $7,357.03 | $4,335.62 |
| 20 | $4,367.98 | $4,972.54 | $14,308.81 | $9,940.83 |
| 25 | $6,314.67 | $7,425.45 | $27,829.44 | $21,514.76 |
| 30 | $9,128.95 | $11,088.36 | $54,125.92 | $44,996.97 |
(Source: DK Research Terminal, FactSet)
Even if MSFT only grows as expected for the next 10 years, that’s a potential 4X inflation-adjusted return.
| Time Frame (Years) | Ratio Aristocrats/S&P Consensus | Ratio Inflation-Adjusted MSFT Consensus vs S&P consensus |
| 5 | 1.03 | 1.35 |
| 10 | 1.07 | 1.81 |
| 15 | 1.10 | 2.43 |
| 20 | 1.14 | 3.28 |
| 25 | 1.18 | 4.41 |
| 30 | 1.21 | 5.93 |
(Source: DK Research Terminal, FactSet)
Which is almost 2X what analysts expect from the S&P 500 and dividend aristocrats.
MSFT Investment Decision Score
DK Dividend Kings Automated Investment Decision Tool
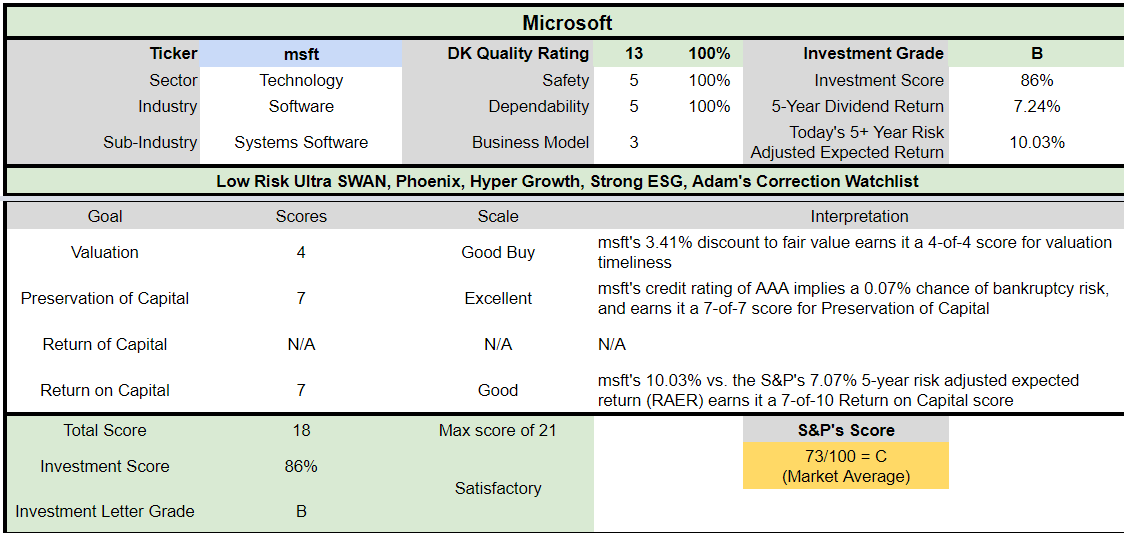
For anyone comfortable with its risk profile, MSFT is one of the most reasonable and prudent hyper-growth Ultra SWANs you can buy today.
- 3% discount vs. 3% market discount = same valuation profile
- but for, in our opinion, possibly the highest quality company in the world
- potentially 60% higher long-term return potential than S&P 500 overtime
- about 1.5X better risk-adjusted expected return over the next five years
Bottom Line: When It’s Raining Blue-Chip Bargains From The Sky, It’s Time To Bend It Like Buffett And Buy, Buy, Buy
I’m not a market timer, and I don’t try to call market bottoms.
| Time Frame | Historically Average Bear Market Bottom |
| Non-Recessionary Bear Markets Since 1965 | -21% (Achieved May 20th) |
| Median Recessionary Bear Market Since WWII | -24% (Citigroup base case with a mild recession) June 16th |
| Non-Recessionary Bear Markets Since 1928 | -26% (Goldman Sachs base case with a mild recession) |
| Average Bear Markets Since WWII | -30% (Morgan Stanley base case) |
| Recessionary Bear Markets Since 1965 | -36% (Bank of America recessionary base case) |
| All 140 Bear Markets Since 1792 | -37% |
| Average Recessionary Bear Market Since 1928 |
-40% (Deutsche Bank, Bridgewater, SocGen Severe Recessionary base case, Morgan Stanley Recessionary Base Case) |
|
(Sources: Ben Carlson, Bank of America, Oxford Economics, Goldman Sachs) |
Depending on whether or not we get a recession, and how much earnings estimates come down in the next few months, the range of potential market bottoms is very wide.
- Soc Gen’s worst-case scenario (1970s-style stagflationary hell) is a 48% decline in the S&P 500
Have stocks already bottomed on June 16th? Probably not but it’s not impossible.
- the 1954 recession saw a 15% peak decline (not even a bear market)
- the 1991 recession saw a 21% peak decline
- the 2011 and 2018 recession scare bear markets bottomed at -20%
Most likely stocks still have a bit more to fall (-35% to -40% based on 13 to 15X trough earnings bottoms in historical recessions).
But all of Wall Street is probabilities, never certainties.
Those that speak in terms of certainties in finance are charlatans, fools, or trying to sell you something, sometimes all three.
Permabears like John Hussman sound smart when stocks are down 25% off their highs, but his never-ending predictions of 70% crashes are dangerous and outrageous.
- from -40% consensus bear case bottom to -70% is an additional 50% decline
If you believe the doomsday prophets, you’ll never buy anything and live in constant fear, and most likely sit in case forever.
Ycharts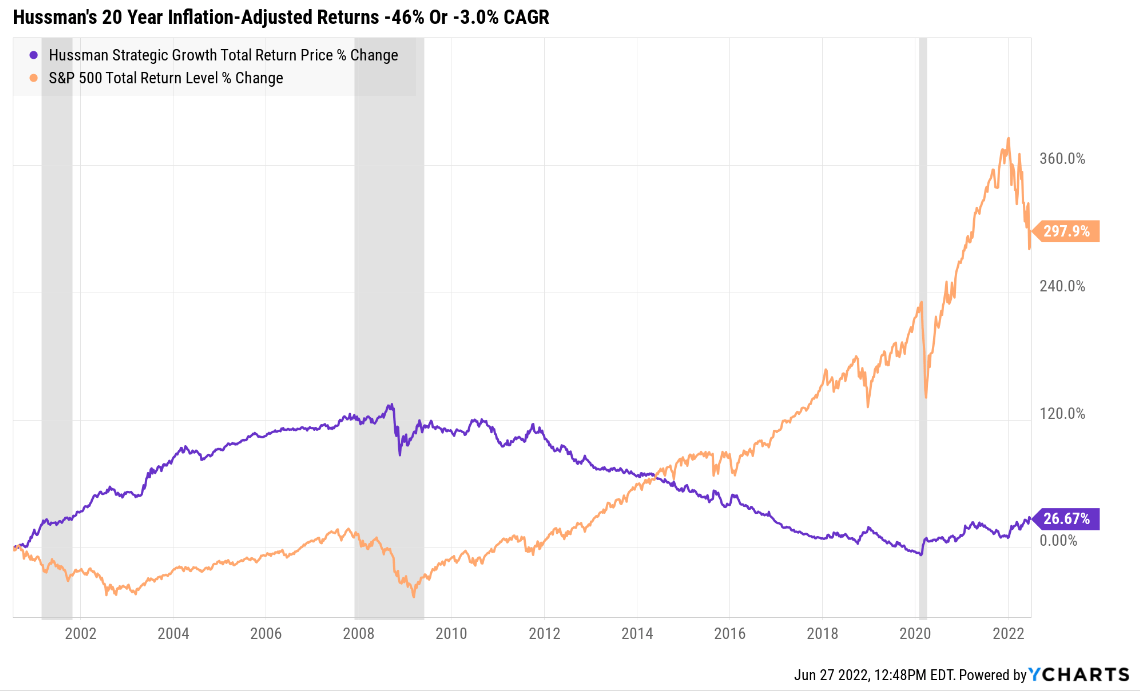
We’ve had three severe bear markets in 20 years, including two major market crashes.
We’ve had three recessions (now likely four) and some of the most extreme economic and market conditions in US history.
And despite all that chaos, Hussman’s never-ending bearishness has caused his investors to lose 50% of their money in inflation-adjusted terms.
“Any man who is bearish on the United States will go broke.” – JPMorgan
There is a big difference between warning about potential further declines in stocks and predicting never-ending catastrophe that never arrives.
There is a big difference in being a fully invested bear who cheers every market decline, but only so he/she can use them to buy the world’s greatest companies at reasonable to attractive valuations.
There is a big difference between market timing and prudent annual rebalancing of sound asset allocation.
- asset allocation (diversification) is the 2nd most proven principle in finance
- market timing is 98% likely to fail for most investors
By no means are BTI and MSFT right for everyone, and I can’t tell you where they are going in the short-term.
But here is what I can say with high confidence. Our model shows that these companies represent potentially as close to perfect dividend growth blue-chips as exist on Wall Street. And Microsoft is, in my estimation, as close to a perfect quality company as you’ll ever find on Wall Street.
What their stock prices do in the next year is a crapshoot. But I can say with near certainty that their dividends will increase in the next 12 months.
What their stock prices do in the next six months is almost all down to sentiment and luck.
But over the next 5+ years? The time horizon all prudent long-term investors use? I can say with 80% confidence that anyone buying BTI and MSFT today are likely to be pleased or even thrilled with the result.
If you’re looking to take advantage of this bear market to make your own luck on Wall Street and retire in safety and splendor, then BTI and MSFT are well worth considering today.
“Luck is what happens when preparation meets opportunity.” – Seneca the Younger
Be the first to comment