

BackyardProduction/iStock Editorial via Getty Images
Despite the recent sharp share price drop, Verizon Communications Inc. (NYSE:VZ) has outperformed the broader market in 2022. While the S&P 500 (SPY) has declined by as much as 16%, year to date, VZ has only lost 8% of its market value.
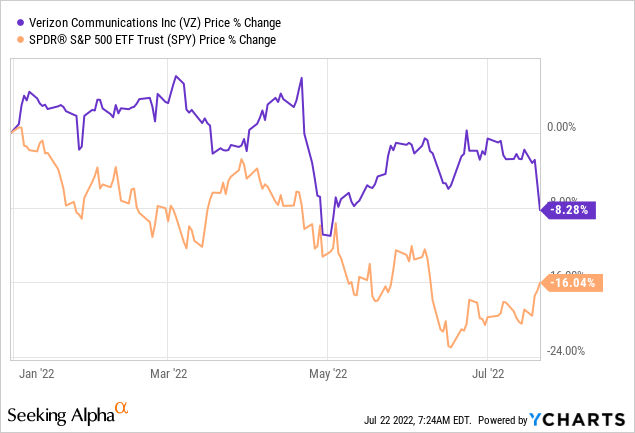
In our opinion, in the current market environment VZ could continue outperforming. Also, after the recent price drop, the firm appears to be attractive from a valuation point as well.
In this article, we will elaborate on two reasons why we believe that VZ could be a good buy today.
Performance during times of low consumer confidence
Consumer confidence is a leading economic indicator, which is often used to predict near-term changes in the spending behavior of the consumer. A low or declining confidence level indicates that people may become reluctant to spend larger amounts of money, as their financial outlook is becoming more uncertain. This could lead to a decreasing demand for durable, discretionary, non-essential goods. While services are one of the last items on the list to be hit by the declining confidence, people may decide to save costs by switching to lower cost alternatives.
In the United States, consumer confidence has been steadily declining in the past months, falling even below 2008-2009 levels. Although consumer spending has remained high in the first half of 2022, we believe that the declining confidence will eventually cause the spending to slow.
U.S. Consumer confidence (Tradingeconomics.com)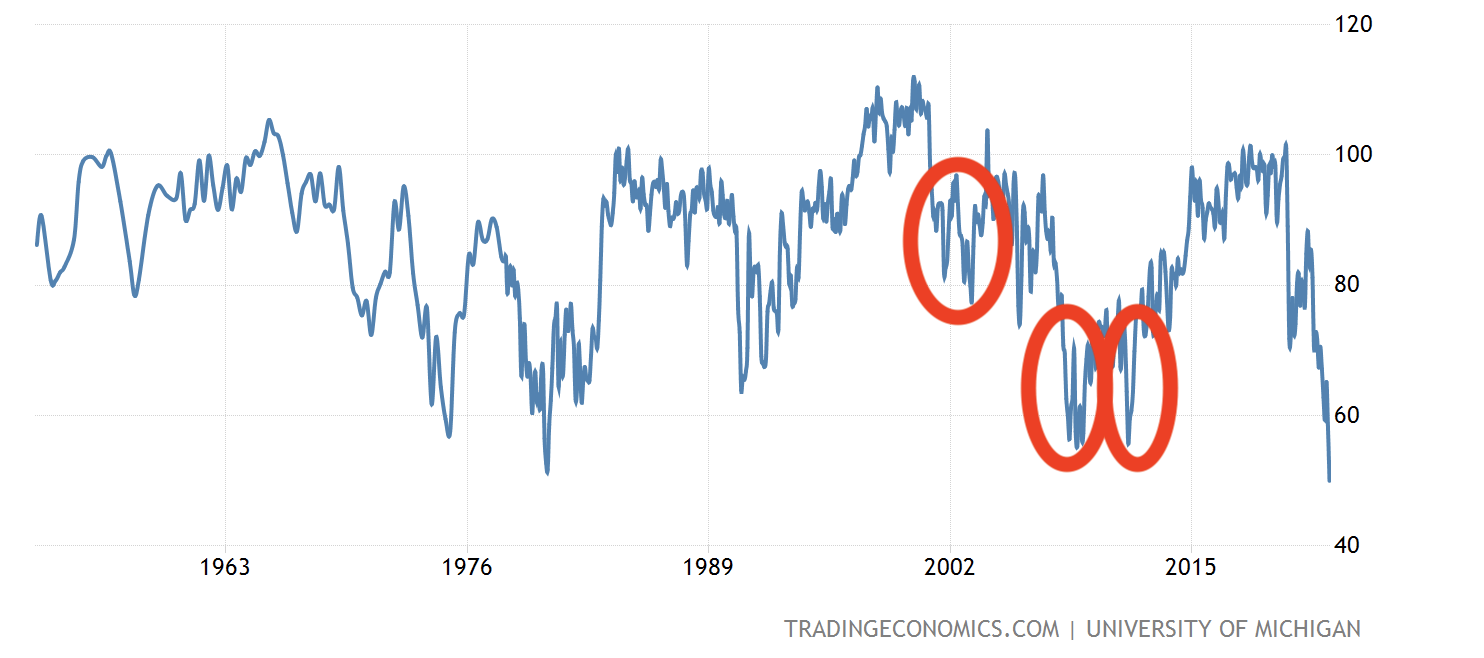
Let us take a look at how Verizon has actually performed in the last 20 years during times characterized by low consumer confidence. These periods are marked by the red circles on the chart above.
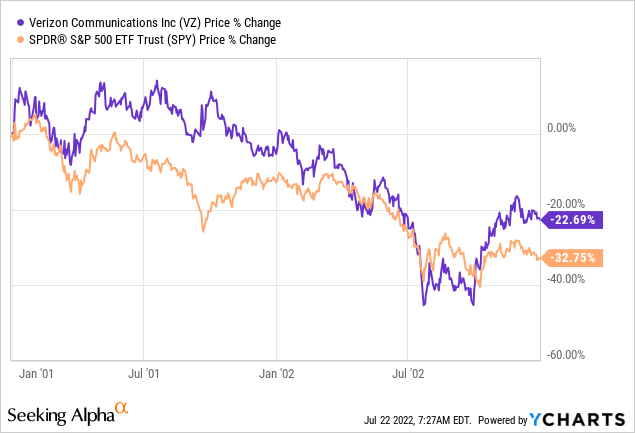
2001-2003
Although between 2001 and 2003 both VZ and SPY have ended the period in the negative territory, VZ has outperformed the broader market by about 10%.
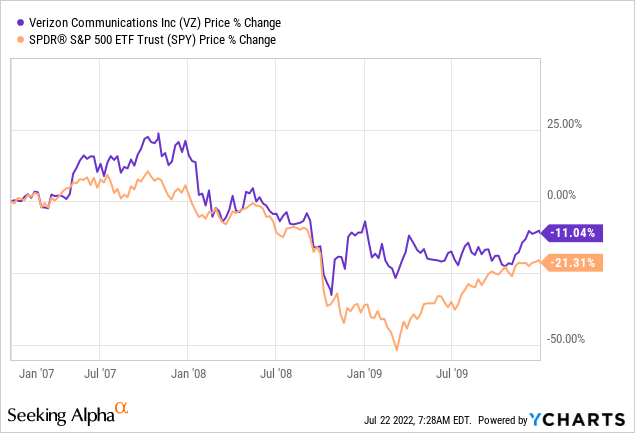
2007-2010
Between 2007 and 2010, a similar trend can be observed. While VZ has lost about 11% of its market value in this 3-year time frame, the broader market has declined by as much as 21%.
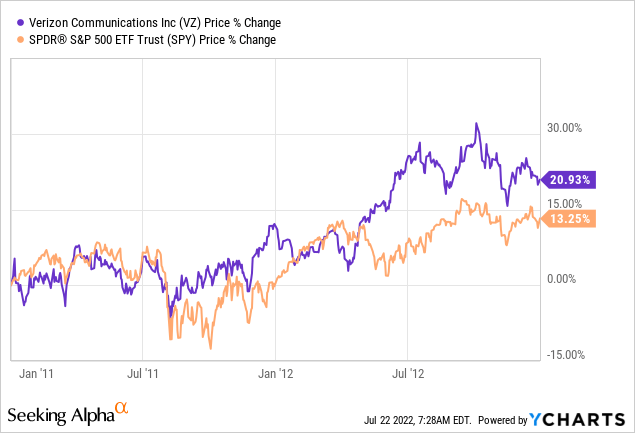
2011-2013
In this period, VZ has once again outperformed the S&P 500, by gaining more than 20%, while the SPY has only gained 13%.
While past performance is not always a reliable indicator of future performance, we believe that during times of low consumer confidence VZ is well-positioned to outperform the broader market.
In the current market environment, despite the lowered guidance, we expect the firm to keep outperforming as it is not directly impacted by the macroeconomic headwinds related to the Russia-Ukraine tension, the strong USD, and COVID-19 related restrictions. Due to inflationary pressures, the firm is also working on implementing price hikes in order to offset rising costs.
Valuation
Let us now take a look at how VZ’s stock appears from a valuation point of view. We will be using the Gordon Growth Model to define a fair value range and a justified P/E multiple range for the stock.
Gordon Growth Model
The Gordon growth model is a simple and oft-used dividend discount model applied to value the equity of dividend-paying companies. The main assumption of this model is that the dividend grows indefinitely at a constant rate. Due to this criterion, the growth model is especially suitable for firms that are:
1.) Paying dividends
2.) In the mature growth phase
3.) Relatively insensitive to the business cycle.
A strong track record of steadily increasing dividend payments at a stable growth rate could also serve as a practical criterion if the trend is expected to continue in the future.
Dividend history (Seekingalpha.com)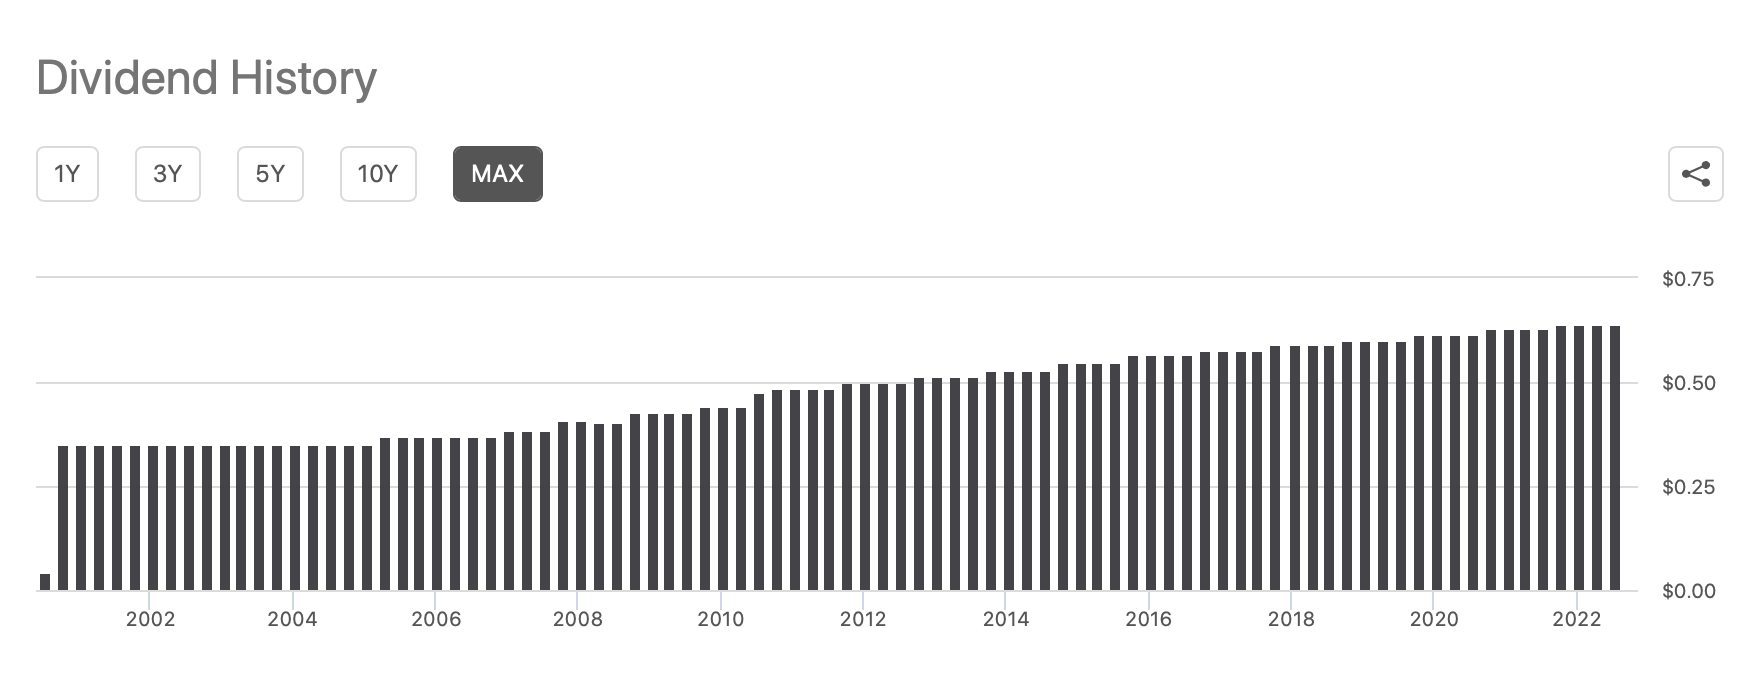
In our opinion, VZ fulfils these criteria. Therefore, the GGM could be applied to value the firm.
To determine the fair value, we have to make two important assumptions:
1.) Required rate of return
When estimating the required rate of return, we often prefer to use the Weighted Average Cost of Capital (WACC) measure.
WACC (Finbox.com)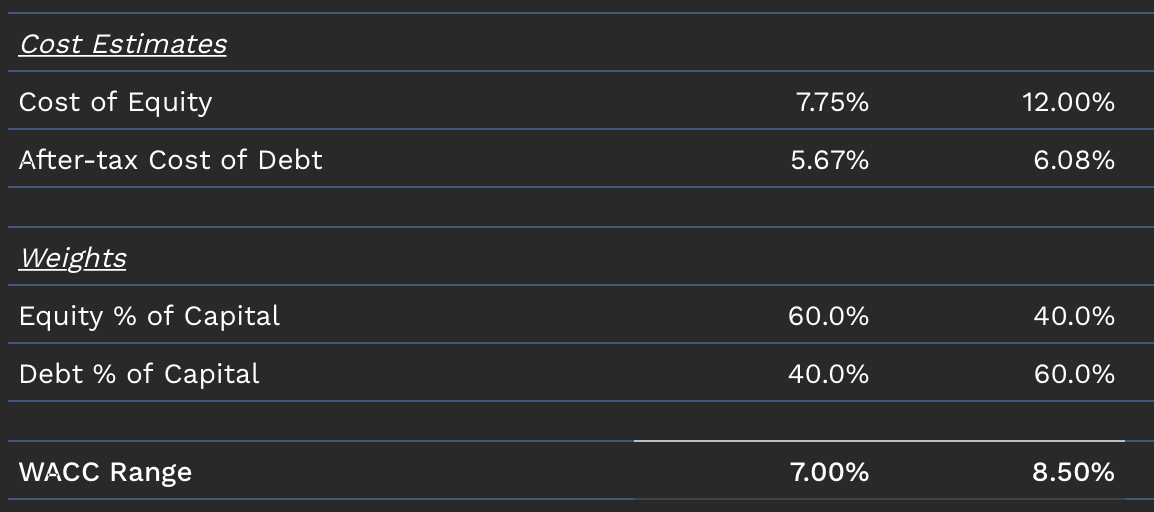
The WACC for VZ is estimated to be in the range of 7% to 8.5%, however, to be on the conservative side of the spectrum, we will be using 8% for our fair value calculations.
2.) Dividend growth rate in perpetuity
VZ has a long history of consistently growing its dividend payments by about 2% to 3% per year. We believe this range is suitable for our evaluation.
Dividend growth (Seekingalpha.com)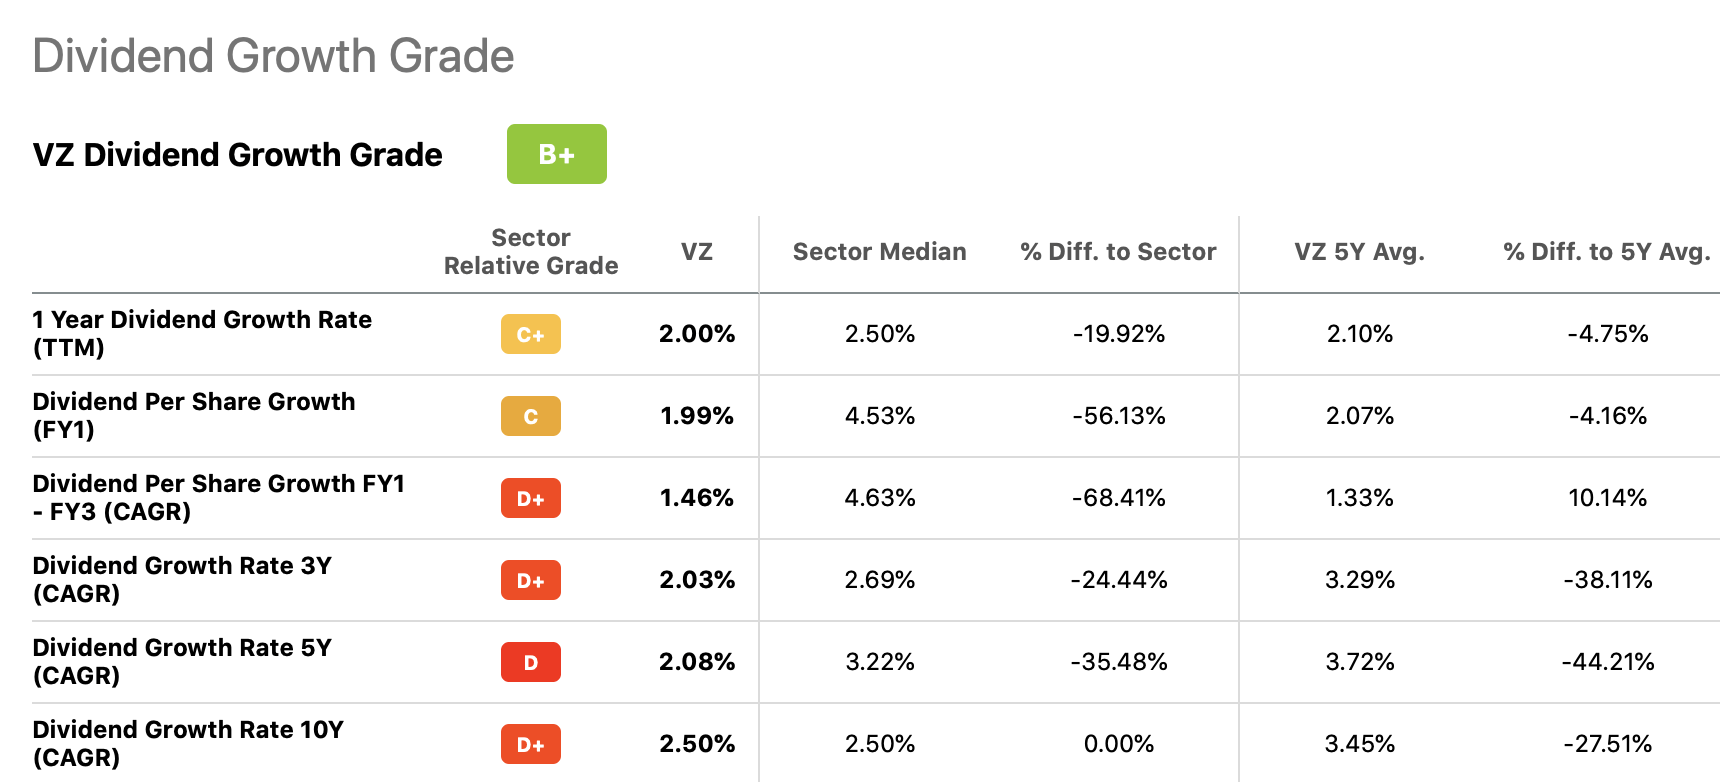
The following table shows the results of our fair value calculation using an 8% required rate of return and the above defined range of constant sustainable dividend growth rate.
Results (Author)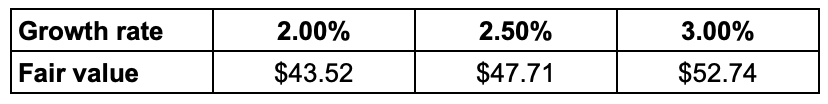
As the stock is trading around $45 per share, we believe that VZ looks attractive from a valuation perspective based on the GGM.
Justified P/E
Let us take a look now at what could be a justified P/E multiples for the stock.
Price multiples are often used separately from present value models. On the other hand, the Gordon Growth Model could be applied to relate fundamentals through a discounted cash flow model. This method makes it possible to determine a so-called justified P/E ratio.
For this calculation, we maintain our required return of 8% and the perpetual dividend growth rate between 2% to 3%. To estimate the justified P/E multiple, however, we need to define a reasonable range of dividend payout ratios.
The following table and chart show VZ’s dividend payout for several historic periods.
Dividend payout (Seekingalpha.com) Payout ratio (Seekingalpha.com)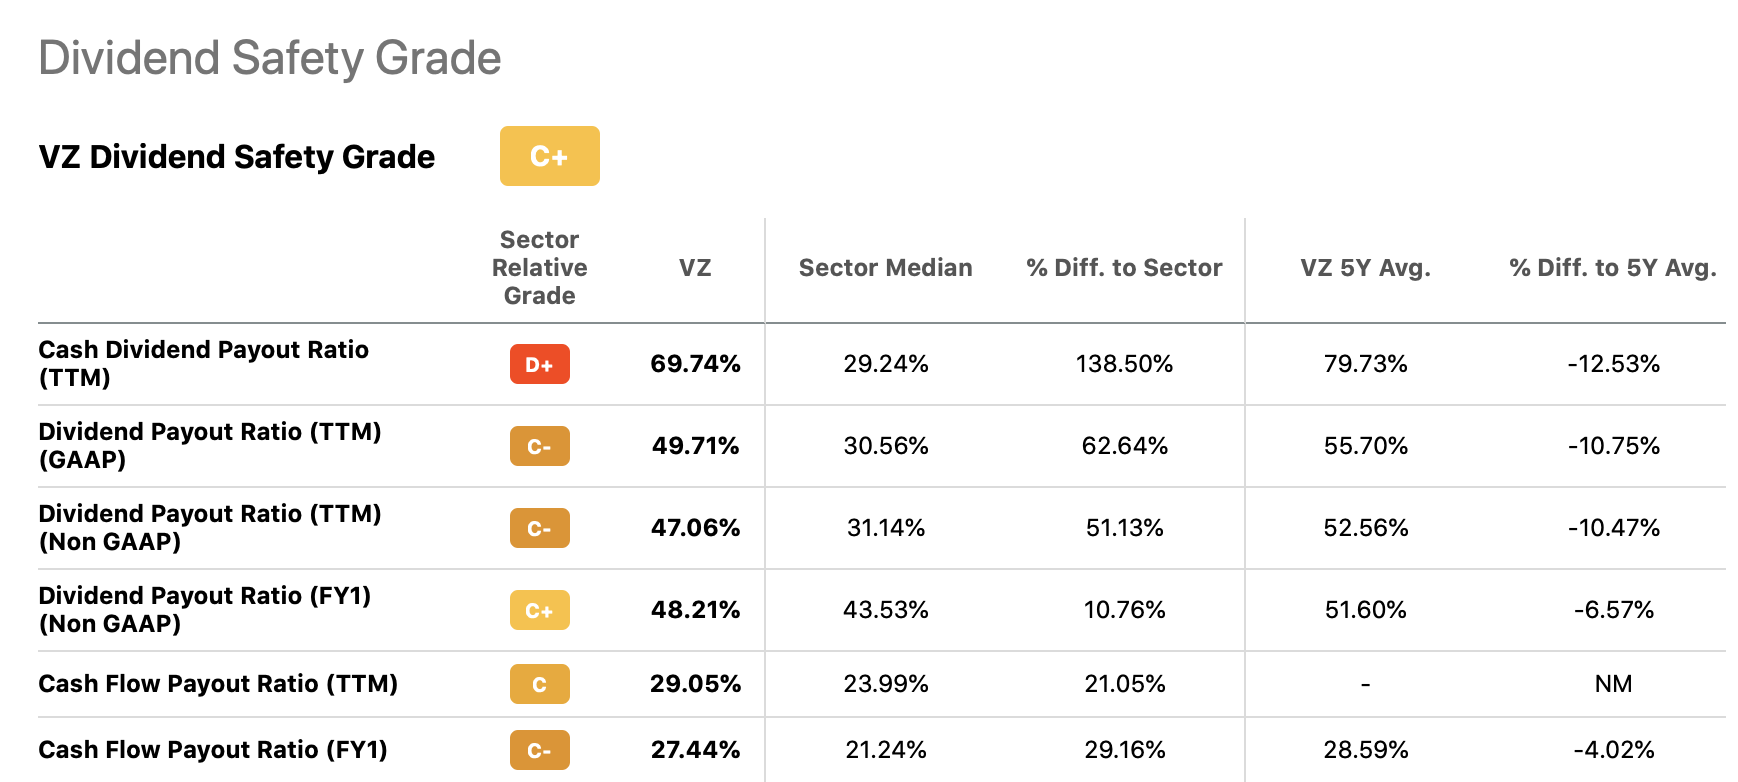
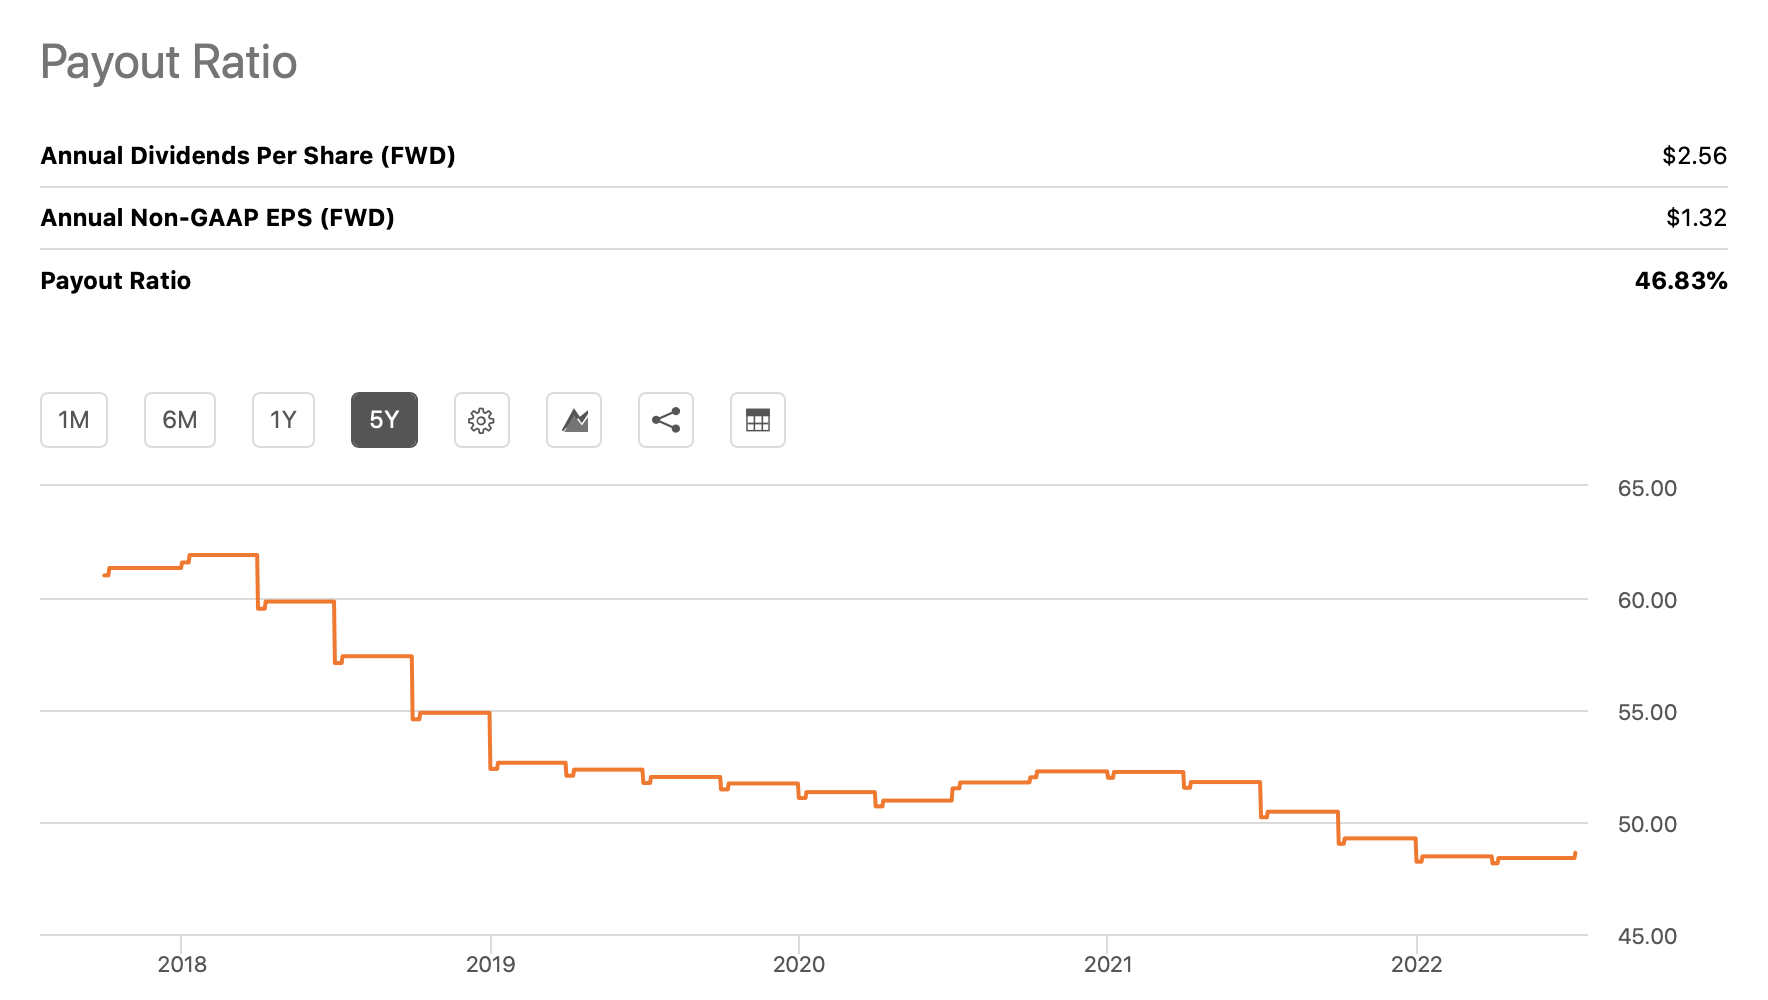
According to this historic information, a range of 45% to 65% appears to be appropriate. By using the defined assumptions and setting them in to the justified P/E formula, we get the following matrix of results.
Results (Author)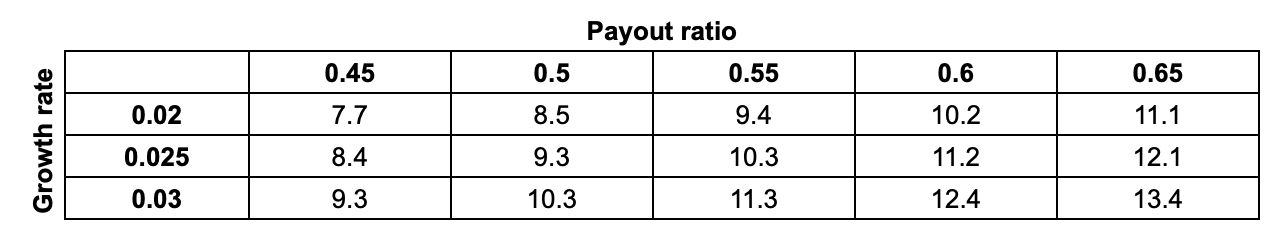
Based on our assumptions, the justified P/E multiple of Verizon is estimated to be in the range of 7.7x to 13.4x, with an average of 10.6x.
As VZ has a P/E GAAP of 9.3 (TTM) and 9.4 (FWD), we believe that the firm is undervalued based on this metric, too.
Valuation (Seekingalpha.com)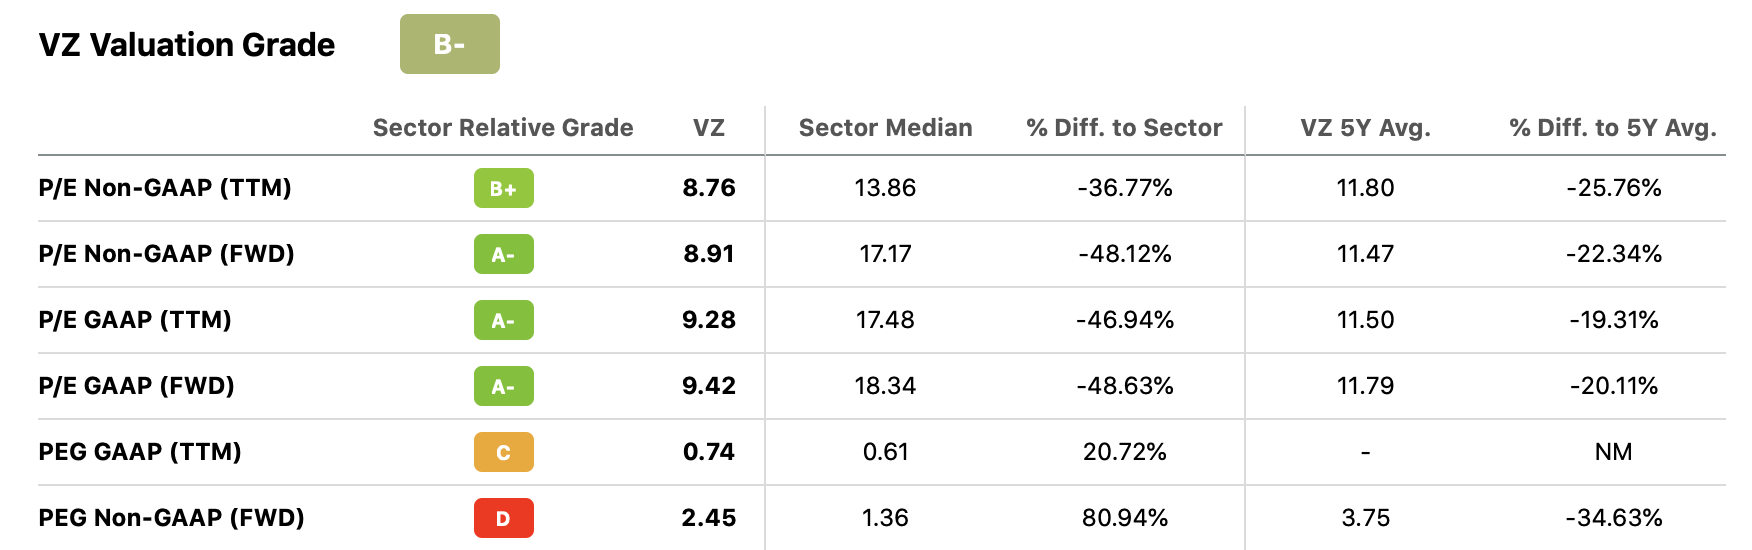
Key takeaways
We believe the share price drop after the weaker than expected guidance for the rest of 2022 creates a great buying opportunity.
In our opinion, based on the stock’s historic performance during times of low consumer confidence, VZ is likely to continue its outperformance in the current market environment.
Based on the Gordon Growth Model, the firm appears to be in the lower half of the calculated fair value range, which could result in further upside potential.
We currently rate VZ as “buy.”
Be the first to comment