

Joe Raedle
Costco (NASDAQ:COST) is a battle-tested company which continues to thrive amidst a tough macro environment and not to mention the fact that it continues to lap the tough comparables of 2021. COST has sustained strong same-store sales growth through what is arguably not the greatest long-term opportunity. In this report, I discuss two reasons to buy the stock and one reason to sell the stock. I conclude with my verdict on the stock at current levels.
COST Stock Price
COST peaked around $612 per share in April but still does not trade far from those levels.
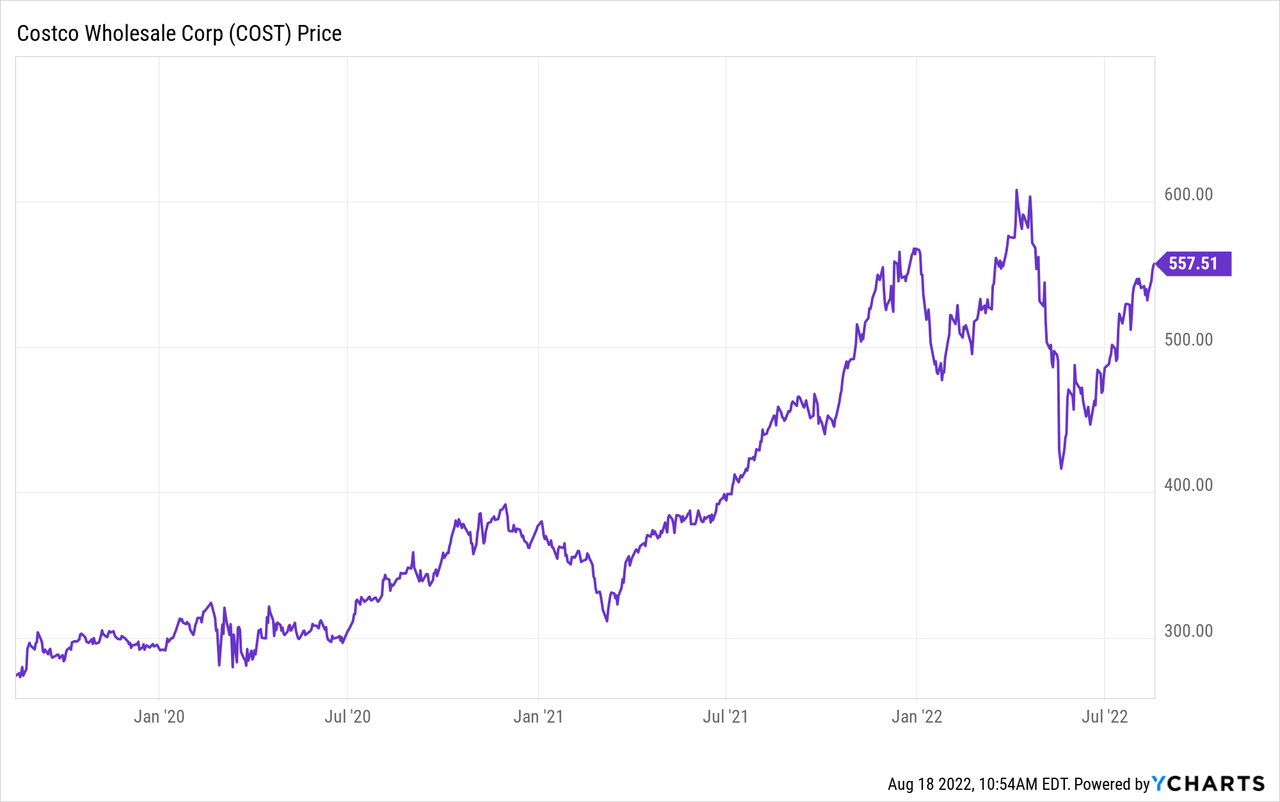
I last covered COST in May, where I discussed why the stock was a buy after crashing due to Target’s (TGT) earnings report. The stock has since jumped 33%, and I continue to see upside from here.
Reason To Buy 1: Strong Same-Store Sales Growth
The first reason to buy the stock is continued strong fundamentals. In the latest quarter, COST showed 10.8% adjusted comparable sales growth.
Fiscal 2022 Q3 Press Release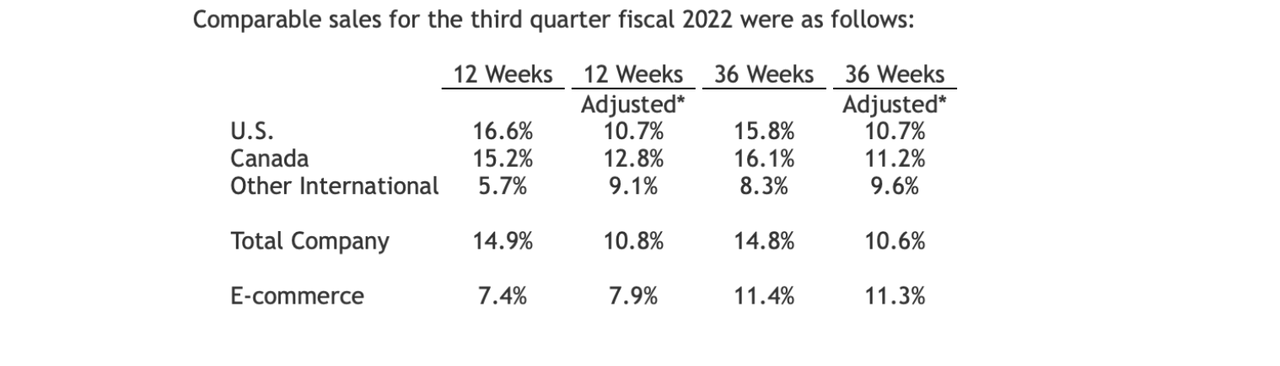
Those numbers are especially impressive considering that most retailers and e-commerce operators are seeing decelerating growth or even declines as they lap tough pandemic comparables. COST’s numbers resemble pre-pandemic growth numbers. The company has seemingly been able to hold onto its pandemic gains and keep growing like it is just business as usual.
The company’s most recent comparable sales release showed 7% growth (excluding impacts from gasoline prices and foreign exchange) in July.
July 2022 Comparable Sales Release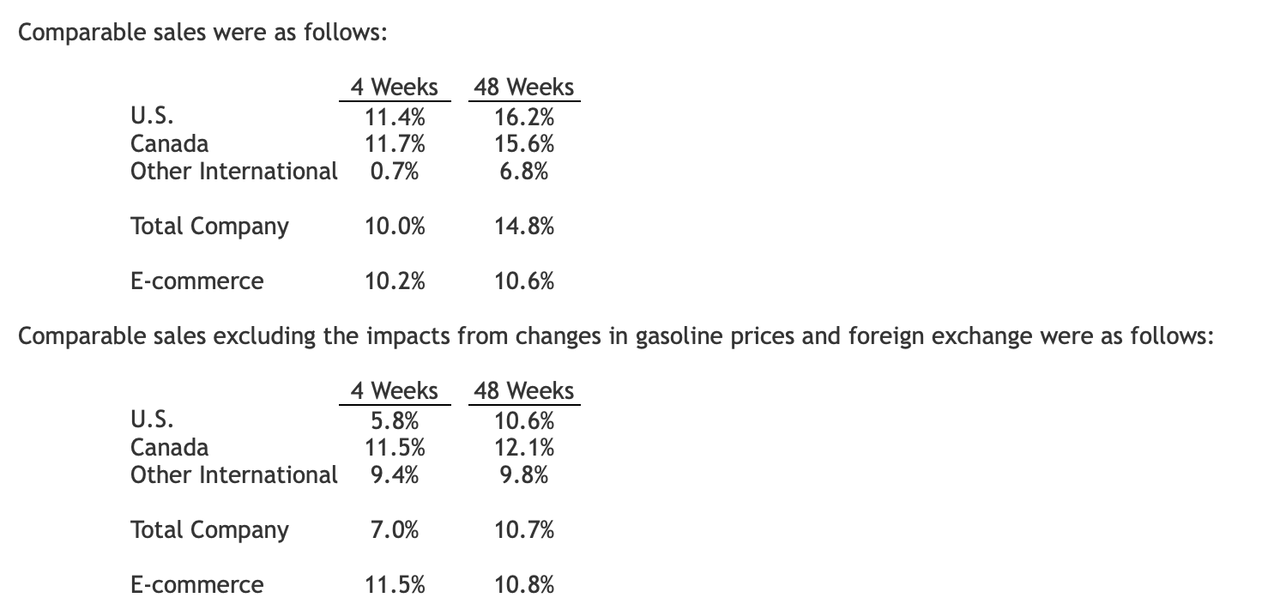
That release gives reason to believe that COST’s next earnings report should show strong comparable sales growth yet again.
Reason To Buy 2: Long-Term Operating Leverage
COST is also a cash flow machine. The company generated $9 billion of operating cash flows in 2021 and is set to grow that number this year. The company might spend around $3.5 billion in capital expenditures this year, leaving enough leftover to fund its dividend and share repurchase program.
Yet these miss the big picture in my opinion. COST generated a slim 2.6% net margin as of the latest quarter. COST’s annual membership fees almost account for the entirety of net income, which has understandably led many investors to believe that COST’s primary profit source comes from membership fees. I view this as a mistake. While COST has historically kept its net margin very low, there is no reason why this must persist in the future. We can see below that COST has been steadily increasing its gross margin over time.
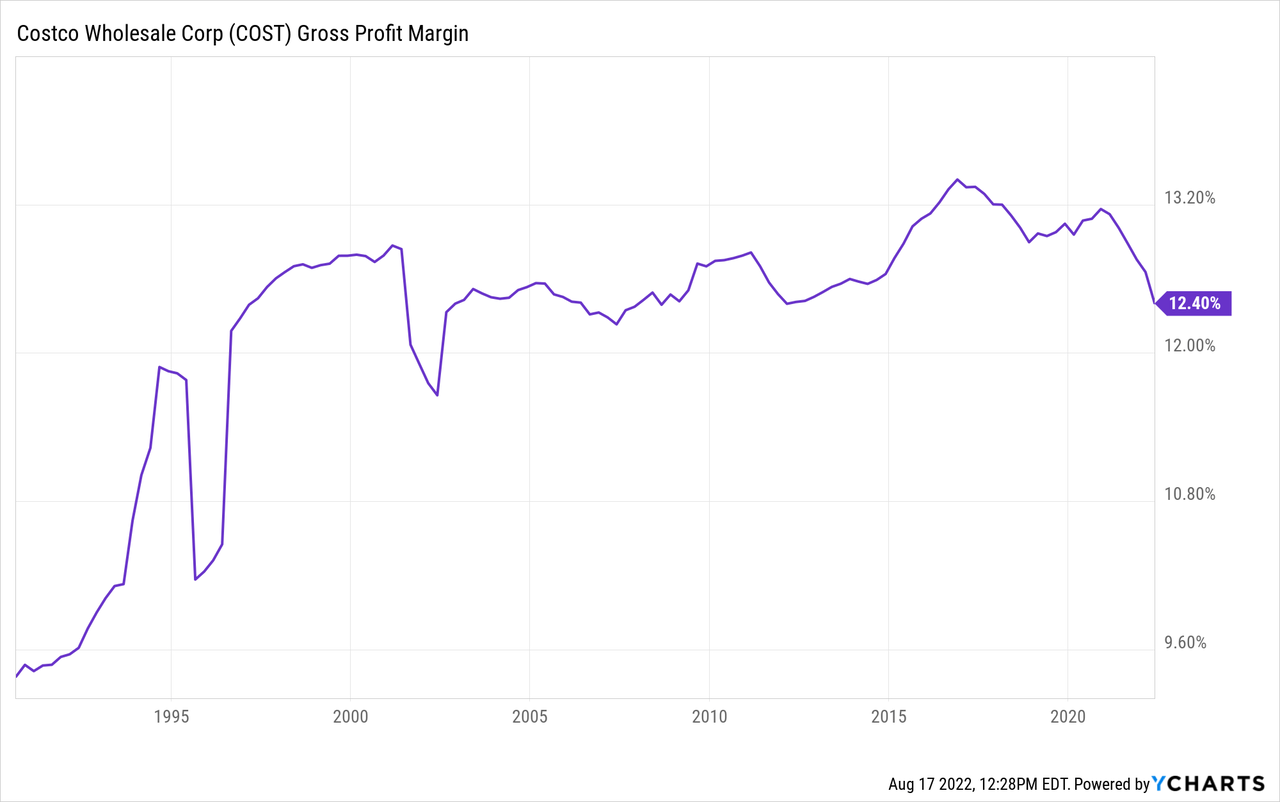
If COST were to increase gross margins by 100 basis points and allow that to flow directly to the bottom line, then net income would increase by approximately 38%. If COST were to increase gross margins by 200 basis points, then net income might increase by 76%. Suddenly this stock which is trading at 43x trailing earnings looks a lot cheaper. The gross margin expansion could come from ongoing efficiencies as well as passing on pricing to both customers and suppliers. The above example showed how even small adjustments to pricing could lead to huge impacts to the bottom line.
Reason To Sell 1: It Doesn’t Matter
One potential reason to sell is that operating leverage can work in both directions. COST’s slim 2.6% net margin could potentially mean that net income could quickly turn negative in the event of a downturn or deteriorating popularity for the business. Net income could theoretically turn negative if revenues declined by only 8% to 10%. Perhaps inflation can also negatively affect COST’s business in the near term if the company is unable to pass on inflationary costs to consumers. While the slim net margin has historically not proven to be an issue for COST due to its resilient business, things can unravel very quickly in bearish scenarios.
Is Costco Stock A Good Long-Term Pick?
Still, though, one mustn’t overestimate the risks here. The fact remains that COST is a free cash flow machine and has a strong balance sheet with $11.8 billion of cash versus $6.5 billion of debt. The company was even profitable during the Great Financial Crisis. This is a name which is showing strong comparable sales growth which, in conjunction with new store openings, should enable the company to sustain robust growth rates for a long time. Then, when the company reaches saturation in which it no longer can win market share, it always has the margin expansion opportunity discussed above.
Is COST Stock A Buy, Sell, Or Hold?
At recent prices, COST is trading at 42x forward earnings. That multiple might not look obviously cheap, especially considering that tech stocks have experienced a sizable valuation reset. Yet we saw above how slight gross margin expansion could lead to dramatic net margin expansion. If we assume that COST can increase its margins by at least 200 basis points over the long term, then the stock is trading at around 24x long-term earnings power. I can see the company sustaining at least 7% comparable sales growth and 3% new store opening growth over the next five years. That might lead to around 10% to 12% annual earnings growth. Placed against that growth rate, the stock trades at around a 2x PEG ratio (using the long-term earnings power). That is an admittedly rich multiple, but COST might also outperform on my projections, and the stock is also trading at a 2.4% earnings yield. Key risks here, besides those stated above, include multiple compression. The stock isn’t cheap, even if it is buyable here. There is no inherent reason why the stock couldn’t re-value downwards to something like 20x earnings – TGT is trading at that multiple. That would suggest a 50% potential downside from multiple compression alone. I rate COST a buy due to the high visibility in the medium and long term.
Be the first to comment