

allanswart/iStock via Getty Images
This dividend exchange-traded fund (“ETF”) review series aims at evaluating products regarding their past performance and their current portfolio quality.
DVYE strategy and portfolio
The iShares Emerging Markets Dividend ETF (NYSEARCA:DVYE) has been tracking the Dow Jones Emerging Markets Select Dividend Index since 02/23/2012. It has a portfolio of 114 stocks (plus cash in various currencies and derivatives), a distribution yield of 7.88% and a total expense ratio of 0.49%. Dividends are paid quarterly.
As described by S&P Dow Jones Indices, the investable universe includes stocks incorporated in emerging markets (S&P Emerging BMI). Chinese companies must be listed in Hong Kong or the U.S.
At every annual reconstitution, eligible stocks must have:
- A positive earnings-per-share ratio (TTM).
- Positive IAD yield and dividends in each of the previous three years.
- At least US$ 250 million in float-adjusted market capitalization.
- At least US$ 2 million in 3-month average daily volume (US$ 500,000 for current constituents).
Then, eligible stocks are ranked by IAD yield. The top 100 are selected as index constituents, with a maximum of 30 stocks by country. Some rules defining a tolerance zone are applied for existing constituents to limit turnover.
Constituent are weighted based on IAD yield, with a maximum weight of 25% by country. A constituent may be excluded between reconstitutions if the company eliminates or drastically cuts its dividend, or if it is affected by a major corporate event (bankruptcy or delisting).
The portfolio is about 52% in mid-cap companies, 31% in large caps and 17% in small caps.
Half of asset value is invested in two countries: China (about 26%) and Brazil (about 24%). Other countries are below 9%. The next chart lists the top 10 countries, representing almost 93% of the portfolio.
DVYE countries (Chart: author; data: Fidelity)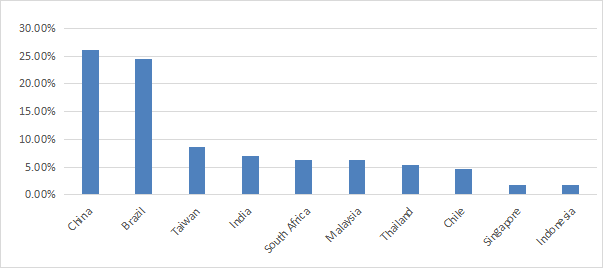
I will use the iShares MSCI Emerging Markets ETF (EEM) as a benchmark for the DVYE stock universe. The three heaviest sectors are materials, real estate and financials, with weights between 13.6% and 16%. Compared to EEM, DVYE underweights technology, consumer discretionary, communication, consumer staples and financials. It overweights all other sectors.
DVYE sectors (Chart: author; data: Fidelity)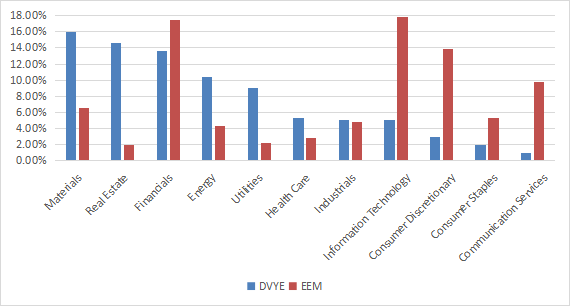
DVYE is much cheaper than EEM regarding the usual valuation ratios:
|
DVYE |
EEM |
|
|
Price / Earnings TTM |
3.12 |
10.78 |
|
Price / Book |
0.6 |
1.61 |
|
Price / Sales |
0.38 |
1.28 |
|
Price / Cash Flow |
2.31 |
7.79 |
The top 15 holdings, listed below, represent 24% of asset value. All holdings are below 3%, so the risk related to individual stocks is low.
|
Name |
Sector |
Weight% |
Location |
Ticker |
|
UNIPAR CARBOCLORO SA PREF B |
Materials |
1.83 |
Brazil |
UNIP6 |
|
RIVERSTONE HOLDINGS LTD |
Health Care |
1.82 |
Singapore |
AP4 |
|
EXXARO RESOURCES LTD |
Energy |
1.76 |
South Africa |
EXX |
|
LOGAN GROUP COMPANY LTD |
Real Estate |
1.75 |
China |
3380 |
|
COLBUN MACHICURA SA |
Utilities |
1.72 |
Chile |
COLBUN |
|
EMPRESAS CMPC SA |
Materials |
1.63 |
Chile |
CMPC |
|
KUMBA IRON ORE LTD |
Materials |
1.56 |
South Africa |
KIO |
|
METALURGICA GERDAU PREF SA |
Materials |
1.56 |
Brazil |
GOAU4 |
|
CPFL ENERGIA SA |
Utilities |
1.54 |
Brazil |
CPFE3 |
|
QUALICORP SA |
Health Care |
1.53 |
Brazil |
QUAL3 |
|
STAR BULK CARRIERS CORP |
Industrials |
1.48 |
Greece |
SBLK |
|
SRI TRANG-AGRO INDUSTRY |
Cons. Discretionary |
1.47 |
Thailand |
STA.R |
|
CIA VALE DO RIO DOCE SH |
Materials |
1.47 |
Brazil |
VALE3 |
|
TIMES CHINA HOLDINGS LTD |
Real Estate |
1.46 |
China |
1233 |
|
LONKING HOLDINGS LTD |
Industrials |
1.46 |
China |
3339 |
Past performance compared to competitors
The next table compares DVYE performance since inception with EEM and some competitors:
- The WisdomTree Emerging Markets High Dividend ETF (DEM), reviewed here.
- The WisdomTree Emerging Markets SmallCap Dividend ETF (DGS), reviewed here.
- the First Trust Dow Jones Global Select Dividend ETF (FGD), reviewed here.
|
Since 3/2012 |
Total Return |
Annual.Return |
Drawdown |
Sharpe |
Volatility |
|
DVYE |
-18.83% |
-1.99% |
-47.55% |
-0.03 |
18.17% |
|
EEM |
11.78% |
1.08% |
-37.39% |
0.13 |
16.62% |
|
DEM |
-1.02% |
-0.10% |
-45.15% |
0.06 |
17.21% |
|
DGS |
31.53% |
2.68% |
-43.07% |
0.22 |
16.86% |
|
FGD |
53.98% |
4.26% |
-43.26% |
0.31 |
16.60% |
Data calculated with Portfolio123
As a reference, SPY has returned 244.6% in the same time (12.7% annualized). DVYE has lost almost 19% in a decade. It includes dividends and it is the worst performance of this list.
In fact, DVYE share price has lost 53% since inception, as shown on the next chart.
DVYE share price (TradingView on Seeking Alpha)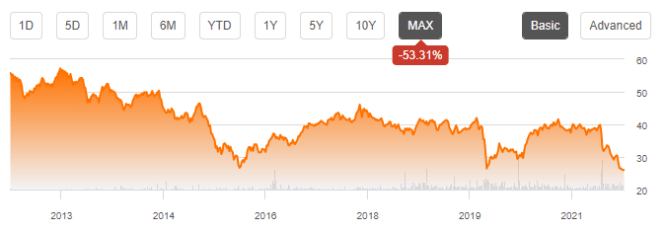
The annual sum of distributions went up from about $2.24 in 2013 to $2.81 in 2021. The small gain in income stream is far from offsetting the huge capital loss, especially after accounting for the tax paid on distributions and inflation.
This issue is not specific to DVYE: securities with yields above 6% suffer from capital decay, on average (there are rare exceptions). The 10-year average annualized return including dividends of all ETFs with a yield superior to 6% is 4.5%…for an average yield of 8.8%!
DVYE might be used as an instrument for swing trading or tactical allocation, but it should not be part of a sustainable retirement plan. This is true for a number of high-yield instruments, not only this one.
Takeaway
DVYE has a portfolio of 100+ dividend stocks from emerging markets. About 44% of asset value is concentrated in three sectors: materials, real estate and financials. I see two major points of concern in this fund. First, geopolitical and regulatory risks related to China: over one third of asset value is in China and Taiwan. Second, capital decay since inception has resulted in a -19% total return. The share price has lost more than half of its value.
I think DVYE might be used for trading or tactical allocation, but not as a sustainable retirement investment. DVYE is not unique in this regard: many high-yield instruments have been suffering significant capital decay. For investors looking for a global ex-U.S. dividend ETF, the Avantis International Small Cap Value ETF (AVDV), reviewed here, looks like a better choice. It has a more attractive profile in countries and sectors, and filters stocks on profitability to avoid the most obvious high-yield traps. For transparency, a dividend-oriented part of my equity investments is split between a passive ETF allocation and my actively managed Stability portfolio (14 stocks), disclosed and updated in Quantitative Risk & Value.
Be the first to comment