

Viktor_Gladkov
The 2022 bear market is proving to be a frustrating time for many investors and not just because it’s the 11th most volatile market in history.
Charlie Bilello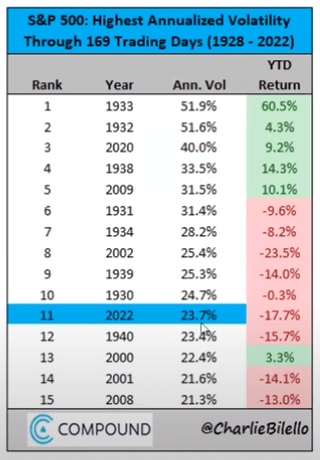
Permabears like John Hussman, Michael Burry, Jeremy Grantham, and Robert Kiyosaki have spent the last 14 years predicting major market crashes, ranging from 50% to 90%.
And 2022 should be the perfect time for the four horsemen of the market apocalypse to be proven right.
- The Russian invasion of Ukraine
- Chinese lockdowns
- soaring interest rates
- the highest inflation in 41 years
- the most hawkish Fed in 41 years
- the fastest quantitative tightening in history
- the worst bond bear market in history
After a decade of “buy the dip” and “free money forever” mentality, the Fed put is dead (for now) and Fed Presidents are actively cheering falling stocks.
And after all this, so far, the market is down 24% at its peak and just rallied 4% in the last week.
- September is historically the worst month for stocks
- yet we’re rallying
- despite QT doubling this month
YCharts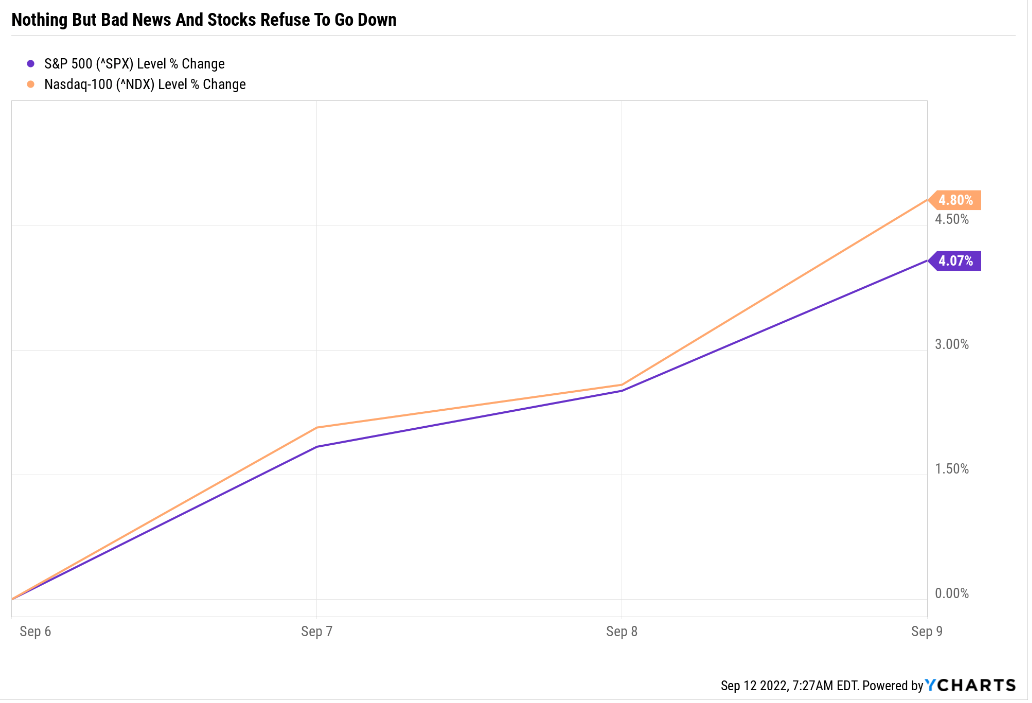
Stocks just roared 4% higher in the last week and tech stocks 5%.
That’s despite long-term rates rising 0.12% and approaching their June peak.
Value hunters are starting to despair at the lack of despair in the stock market.
Well, the bear market isn’t over yet.
Daily Shot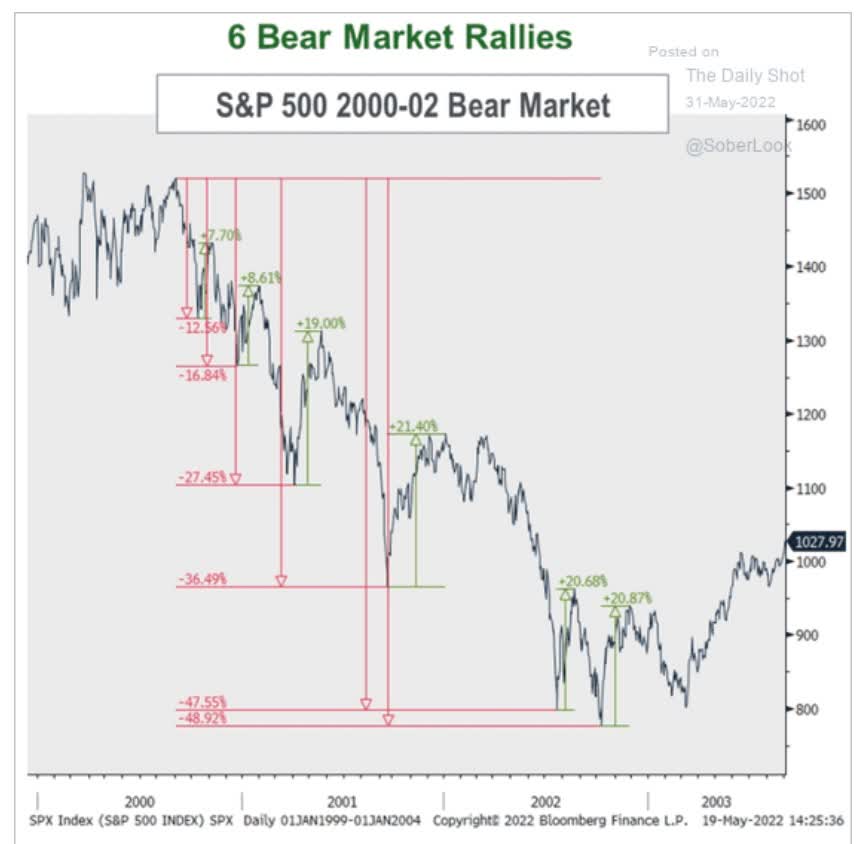
Bear market rallies as strong as 21% are common in long bear markets, and we probably have a long way to go until new record highs.
Morgan Stanley is confident that earnings estimates will either come down a lot or companies will miss earnings by a lot in the coming quarters.
Fundamentally and historically speaking that makes sense. Morgan Stanley’s bearish call that stocks will fall “at least to 3,400” before finally bottoming and that’s if we avoid a recession.
(Source: Dividend Kings S&P 500 Valuation & Total Return Tool)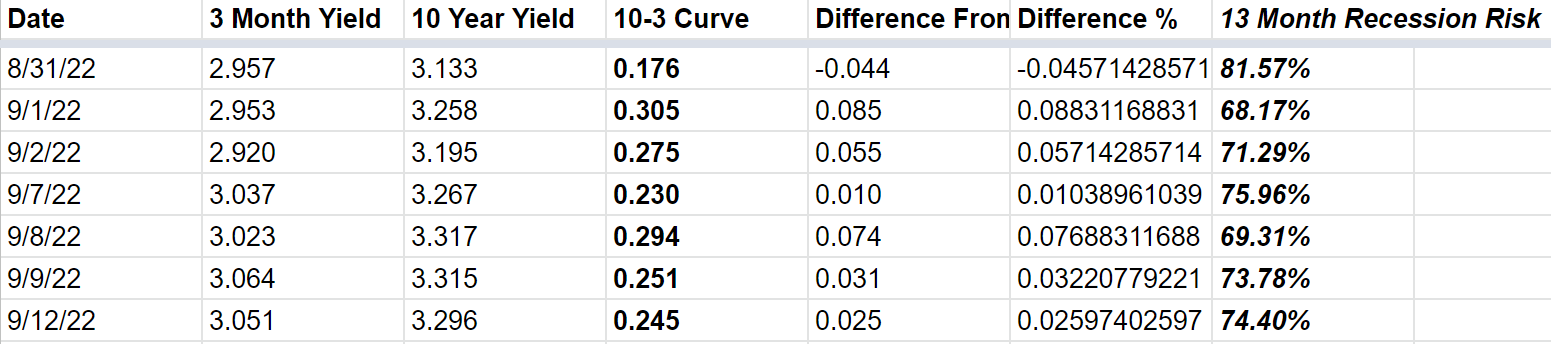
And the probability of a soft landing that avoids recession is 26% according to the bond market, which puts the odds of a recession beginning within 13 months at 74%.
What if we get a mild recession? Then Morgan Stanley, Bank of America, Goldman Sachs, Deutsche Bank, UBS, Wells Fargo, and Societe Generale, all part of the blue-chip consensus, agree that stocks likely bottom at -35% to -40% from all-time highs.
- blue-chip consensus is the 16 most accurate economic teams tracked by Bloomberg
In other words, the 2022 bear market is far from over.
- the first half of 2022: inflation fear
- Q3 2022: hawkish Fed fears
- Q4: slowing earnings fears
- Q1 and Q2 recession fears (negative earnings growth)
Wells Fargo thinks that the economic slowdown might not even begin until next year, and Deutsche Bank thinks the 2023 recession won’t begin until Q3.
What does that mean for investors?
S&P Bear Market Watch
| All-Time High | 4,818.62 |
| Current | $4,067.36 |
| Distance From High | 15.59% |
| Pullback Level | 4577.69 |
| Correction Level | 4336.76 |
| -15% Correction Level (Historically Average Correction Bottom) | 4095.83 |
| Bear Market Level (-20%) | 3854.90 |
| -25% Bear Market | 3613.97 |
| -30% Bear Market | 3373.03 |
| -35% Bear Market | 3132.10 |
| -40% Bear Market | 2891.17 |
| Distance To Pullback | -10.6% |
| Distance To Correction | -6.6% |
| Distance To 15% Correction | -0.7% |
| Distance To Bear Market | 5.22% |
| Distance To -25% Bear Market | 11.1% |
| Distance To -30% Bear Market | 17.1% |
| Distance To -35% Bear Market (Average Historical Recessionary Bear Market Low -36%) | 23.0% |
| Distance To -40% Bear Market | 28.9% |
| Decline To Historical Fair Value | 1.9% |
(Source: Dividend Kings S&P 500 Valuation & Total Return Tool)
That stocks COULD still fall 23% to 29% from here, BUT they might not, and even if they do, it might not happen until the 1st half of 2023 (some analysts think Q4 of 2023).
Ideally, you would just buy blue-chips as part of a diversified and prudently risk-managed portfolio, rebalance annually, and check in on stocks once per year.
But let’s be realistic, if you didn’t love watching the markets in the short-term, you wouldn’t be on Seeking Alpha.
That’s why today I wanted to point out why Magellan Midstream Partners (MMP) (uses a K1 tax form), and Merck (MRK), are two perfect high-yield Ultra SWANs (sleep well at night) choices for these uncertain times.
YCharts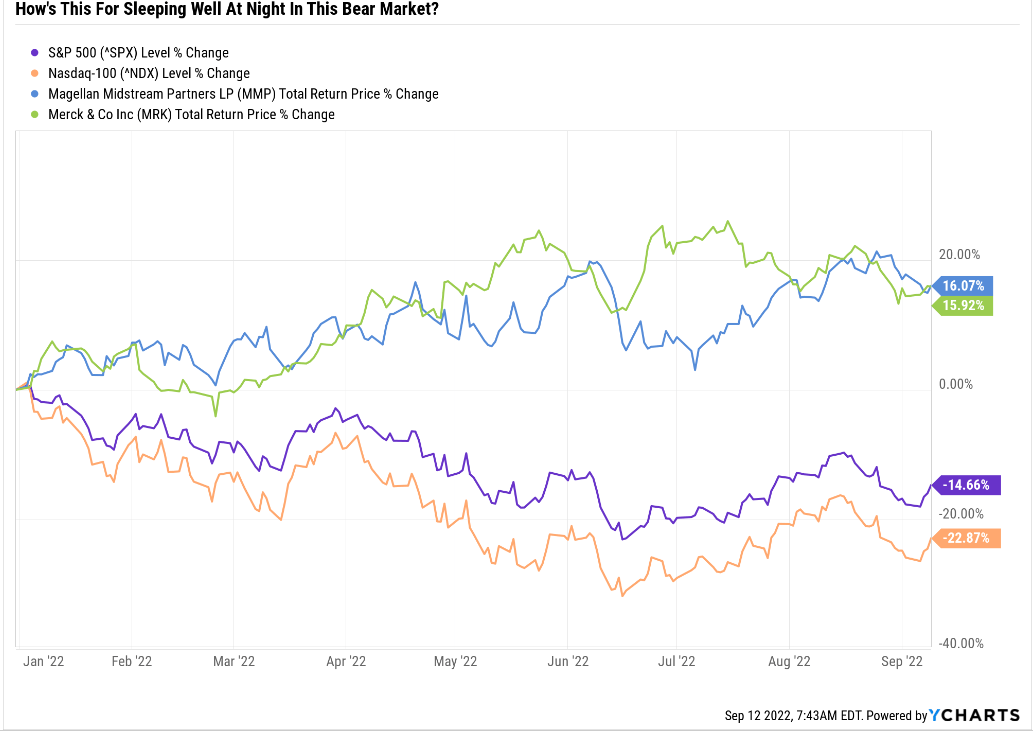
And it’s not just because they are both up 16%, beating the market by 30% in the 11th most volatile market in history.
Let me show you why MMP and MRK literally have Buffett-like return potential in the short-term, and could help you retire in safety and splendor in the coming years and decades.
Magellan Midstream Partners: The Ultra SWAN King Of Ultra-High Yield
Further reading
- 8% Yielding Magellan Midstream Can Help You Retire In Safety And Splendor
- full deep dive on MMP’s investment thesis, growth outlook, risk profile, valuation, and total return potential
Investment Thesis Summary
Magellan’s refined product pipelines are high-quality assets that have contributed to earnings stability as well as steady increases in distributions over time. The pipelines connect refineries to end markets such as gas stations and railroads. As both supply and demand are remarkably steady over time, Magellan has been able to extract modest inflation-linked price increases…
In 2022, our focus remains on capital allocation. Growth spending is expected to be minimal. With a newly expanded $1.5 billion unit buyback in place, the partnership has already bought back over $1 billion in units since 2020. With $447 million in completed asset sales as of June 2022, we expect more buybacks in the second half of the year. We estimate debt/EBITDA will remain below 3.5 times, suggesting sizable capacity for capital return while still keeping leverage at reasonable levels. – Morningstar
Reasons To Potentially Buy Magellan Midstream Partners Today
| Metric | Magellan Midstream Partners |
| Quality | 83% 13/13 Ultra SWAN (Sleep Well At Night) Midstream |
| Risk Rating | Medium |
| DK Master List Quality Ranking (Out Of 500 Companies) | 194 |
| Quality Percentile | 62% |
| Dividend Growth Streak (Years) | 20 |
| Dividend Yield | 8.2% |
| Dividend Safety Score | 85% very safe |
| Average Recession Dividend Cut Risk | 0.5% |
| Severe Recession Dividend Cut Risk | 1.8% |
| S&P Credit Rating |
BBB+ Stable Outlook |
| 30-Year Bankruptcy Risk | 5% |
| Consensus LT Risk-Management Industry Percentile | 49% Average |
| Fair Value | $65.07 |
| Current Price | $50.68 |
| Discount To Fair Value | 22% |
| DK Rating |
Potentially Strong Buy |
| P/Cash Flow | 9.3 |
| Growth Priced In | 1.6% |
| Historical PE Range | 11.5 to 13.5 |
| LT Growth Consensus/Management Guidance | 5.4% |
| 5-year consensus total return potential |
11% to 20% CAGR |
| Base Case 5-year consensus return potential |
16% CAGR (3X better than the S&P 500) |
| Consensus 12-month total return forecast | 18% |
| Fundamentally Justified 12-Month Return Potential | 37% |
| LT Consensus Total Return Potential | 13.6% |
| Inflation-Adjusted Consensus LT Return Potential | 11.4% |
| Consensus 10-Year Inflation-Adjusted Total Return Potential (Ignoring Valuation) | 2.94 |
| LT Risk-Adjusted Expected Return | 9.04% |
| LT Risk-And Inflation-Adjusted Return Potential | 6.82% |
| Conservative Years To Double | 10.55 |
(Source: Dividend Kings Zen Research Terminal)
Magellan 2024 Consensus Total Return Potential
(Source: FAST Graphs, FactSet)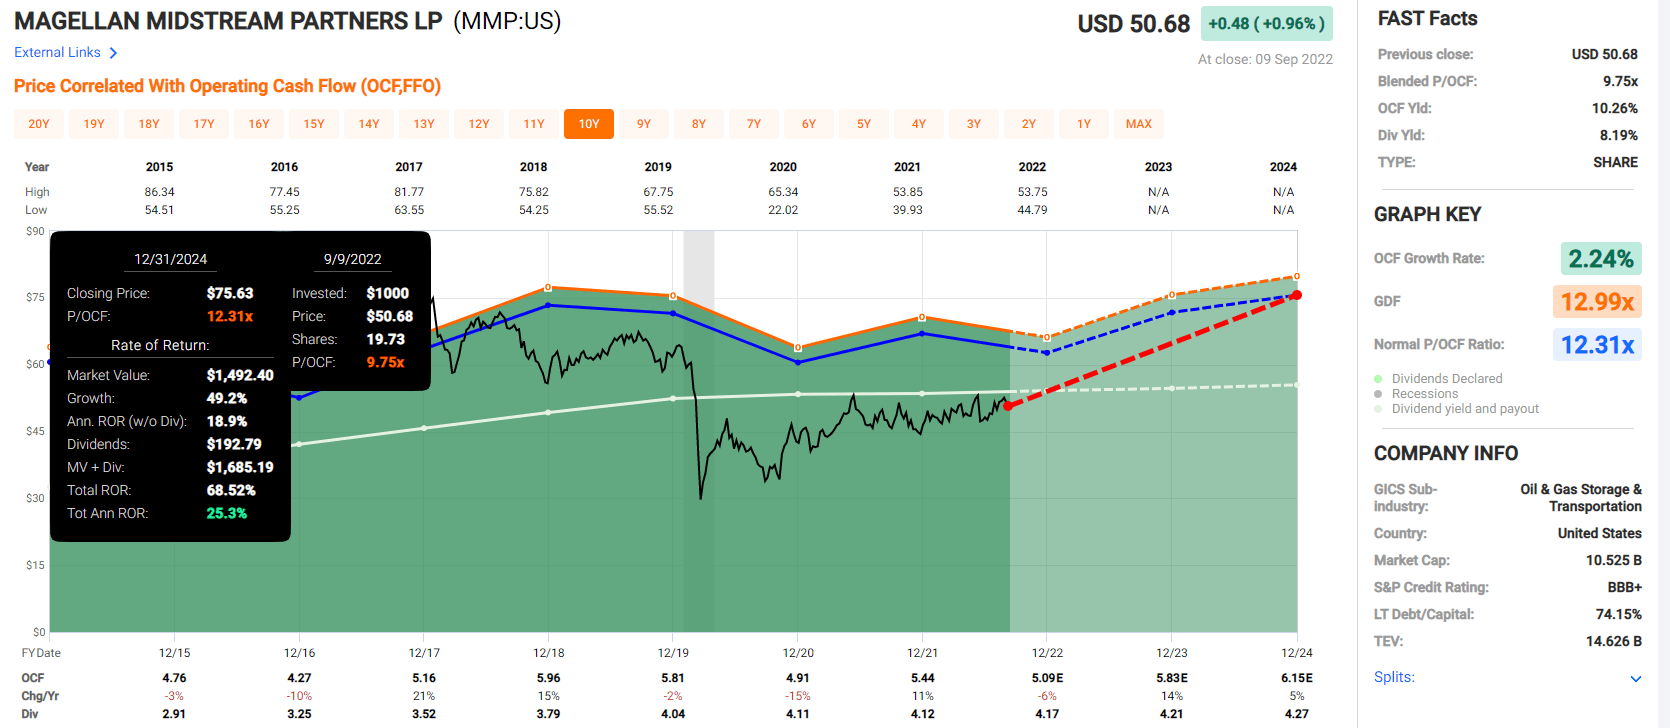
Magellan’s incredible outperformance in 2022 could be the beginning of a multi-year period of Buffett-like returns from this blue-chip bargain hiding in plain sight.
Magellan 2027 Consensus Total Return Potential
(Source: FAST Graphs, FactSet)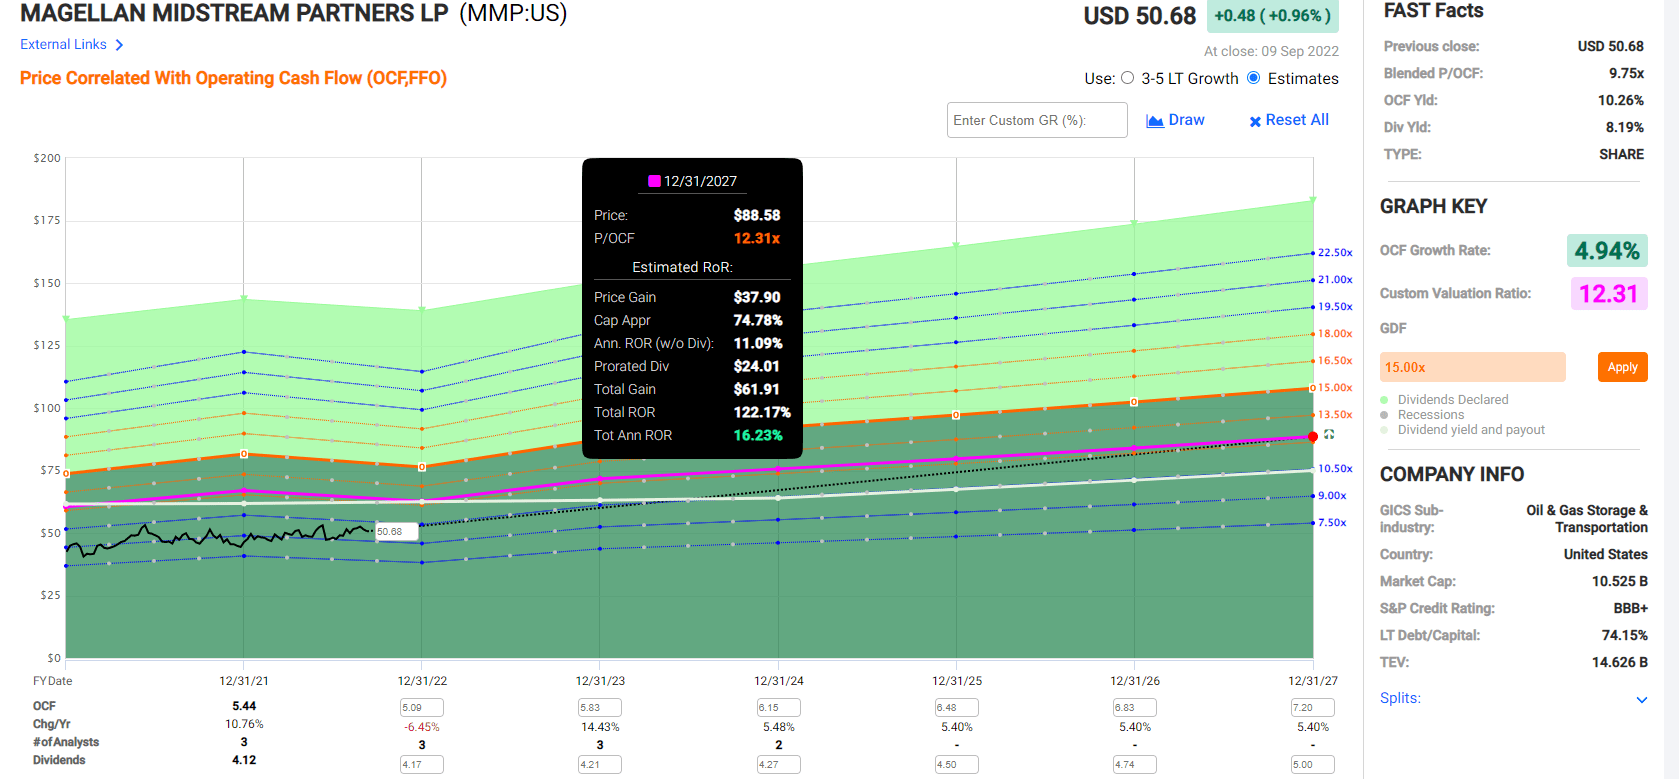
If MMP grows as expected and returns to historical mid-range market-determined fair value by the end of 2027, investors could enjoy 122% total returns or 16% annually.
Now compare that to the S&P 500.
S&P 500 2024 Consensus Total Return Potential
(Source: FAST Graphs, FactSet)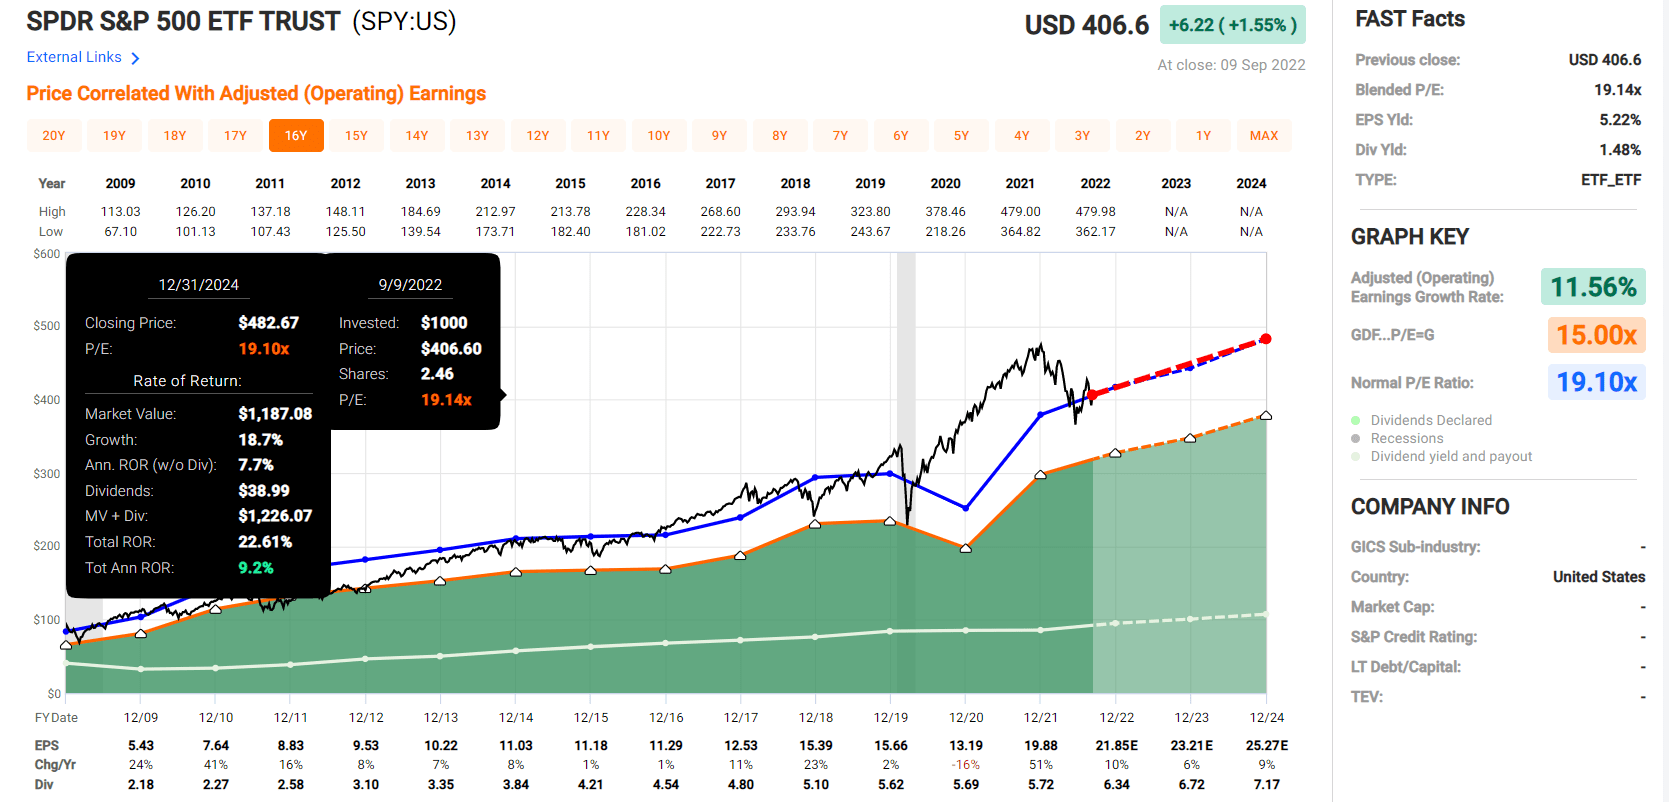
Analysts expect the S&P 500 to deliver 9% annual returns through 2024 potentially.
S&P 500 2027 Consensus Total Return Potential
| Year | Upside Potential By End of That Year | Consensus CAGR Return Potential By End of That Year | Probability-Weighted Return (Annualized) |
Inflation And Risk-Adjusted Expected Returns |
| 2027 | 48.66% | 8.25% | 6.19% | 3.79% |
(Source: DK S&P 500 Valuation & Total Return Tool)
Over the next five years, analysts expect 9% annual returns from the S&P 500.
- MMP could outperform the S&P 500 by almost 3X
But I don’t care about just the next few years; I’m trying to help you achieve life-changing wealth and income.
| Investment Strategy | Yield | LT Consensus Growth | LT Consensus Total Return Potential | Long-Term Risk-Adjusted Expected Return | Long-Term Inflation And Risk-Adjusted Expected Returns | Years To Double Your Inflation & Risk-Adjusted Wealth |
10-Year Inflation And Risk-Adjusted Expected Return |
| Magellan Midstream Partners (Uses K-1 Tax Form) | 8.2% | 5.4% | 13.6% | 9.5% | 7.2% | 10.0 | 2.01 |
| Dividend Aristocrats | 2.4% | 8.6% | 11.0% | 7.7% | 5.4% | 13.4 | 1.69 |
| S&P 500 | 1.7% | 8.5% | 10.2% | 7.1% | 4.9% | 14.8 | 1.61 |
| Nasdaq | 0.9% | 11.8% | 12.7% | 8.9% | 6.6% | 10.9 | 1.89 |
(Source: DK Research Terminal, Morningstar, FactSet, YCharts)
Analysts expect MMP to deliver 13.6% long-term total returns, which is more than the market, aristocrats, or even the Nasdaq.
- Nasdaq beating return potential but with more than 8X the yield
Inflation-Adjusted Consensus Total Return Potential: $1,000 Initial Investment
| Time Frame (Years) | 7.9% CAGR Inflation-Adjusted S&P 500 Consensus | 8.7% Inflation-Adjusted Dividend Aristocrats Consensus | 11.3% CAGR Inflation-Adjusted MMP Consensus | Difference Between Inflation-Adjusted MMP Vs. S&P Consensus |
| 5 | $1,461.18 | $1,516.17 | $1,708.72 | $247.54 |
| 10 | $2,135.06 | $2,298.77 | $2,919.72 | $784.67 |
| 15 | $3,119.71 | $3,485.33 | $4,988.99 | $1,869.28 |
| 20 | $4,558.47 | $5,284.36 | $8,524.79 | $3,966.32 |
| 25 | $6,660.75 | $8,012.00 | $14,566.48 | $7,905.72 |
| 30 (retiree/bond market time frame) | $9,732.58 | $12,147.56 | $24,890.03 | $15,157.45 |
(Source: DK Research Terminal, FactSet)
Over the next 30 years, analysts expect the market to deliver nearly 10X inflation-adjusted returns and the dividend aristocrats 12X.
But the bond market is confident that MMP will still be growing steadily 30 years from now, and analysts think it could deliver 25X real returns.
| Time Frame (Years) | Ratio Dividend Aristocrats/S&P Consensus | Ratio Inflation And MMP Consensus vs. S&P consensus |
| 5 | 1.04 | 1.17 |
| 10 | 1.08 | 1.37 |
| 15 | 1.12 | 1.60 |
| 20 | 1.16 | 1.87 |
| 25 | 1.20 | 2.19 |
| 30 | 1.25 | 2.56 |
(Source: DK Research Terminal, FactSet)
That’s 2.6X the return potential of the S&P 500 and 2X more than the aristocrats, but with 5X higher very safe yield.
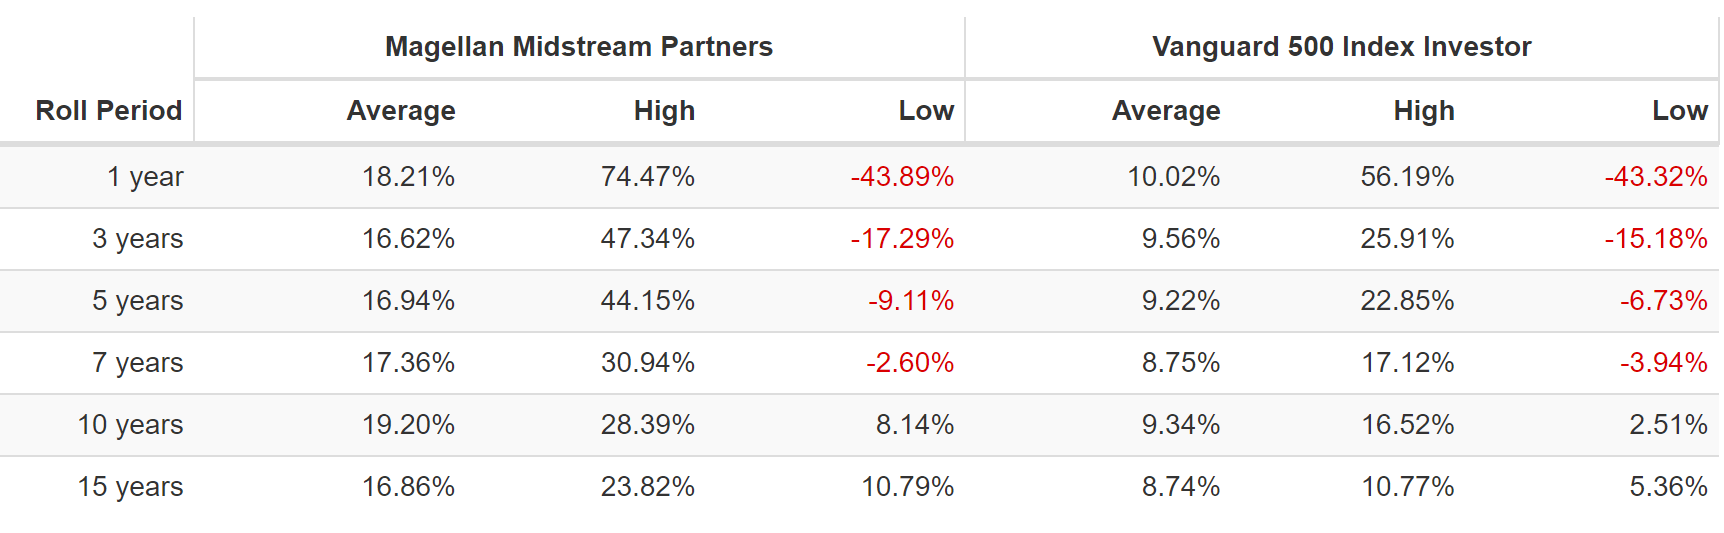
Think it’s impossible for MMP to deliver nearly 14% long-term returns?
Historical Returns Since April 2001
(Source: Portfolio Visualizer Premium) (Source: Portfolio Visualizer Premium)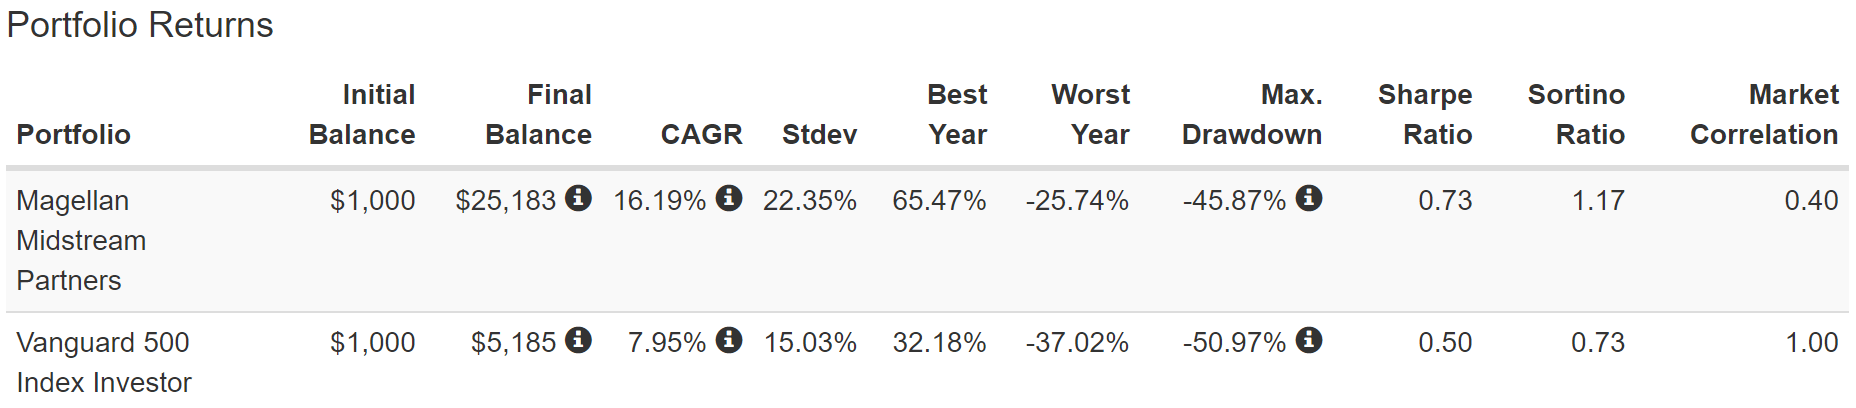
Magellan Investment Decision Score
DK Dividend Kings Automated Investment Decision Tool
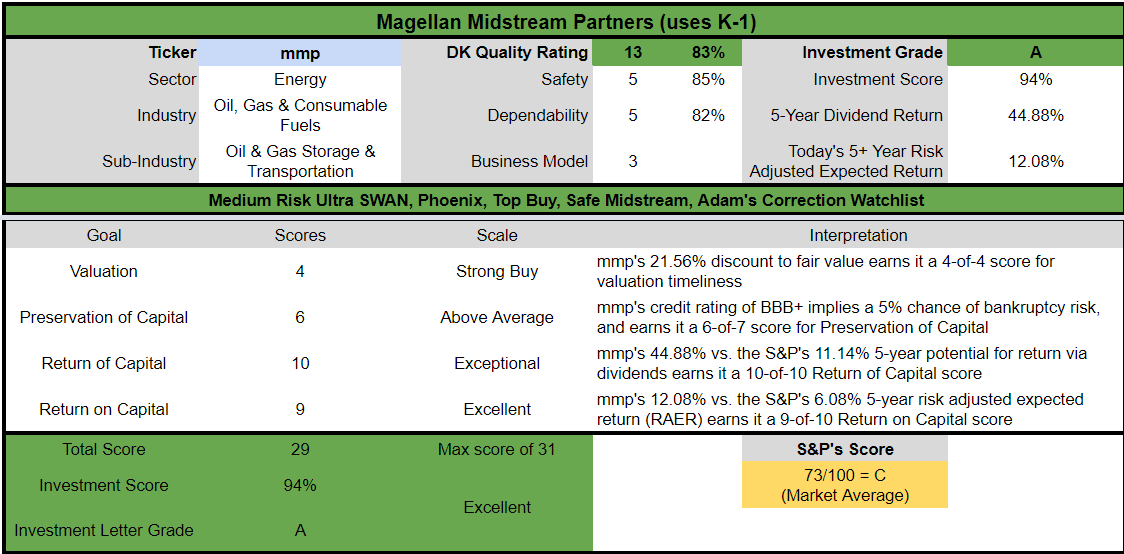
MMP is a reasonable ultra-high-yield Ultra SWAN choice for anyone comfortable with its risk profile.
- 22% discount vs. 2% market premium = 24% better valuation
- 8.2% yield vs. 1.6% yield (5.3X the yield and a much safer yield at that)
- 35% higher consensus annual long-term return potential
- 2X better risk-adjusted expected return over the next five years
- 4X more income over the next five years
Merck: The King of Cancer Drugs
Further Reading
Investment Thesis Summary
Merck’s combination of a wide lineup of high-margin drugs and a pipeline of new drugs should ensure strong returns on invested capital over the long term. Further, following the divestment of the Organon business in June 2021, the remaining portfolio at Merck holds a higher percentage of drugs with strong patent protection. On the pipeline front, after several years of only moderate research and development productivity, Merck’s drug development strategy is yielding important new drugs.
Merck’s new products have mitigated the generic competition, offsetting the recent major patent losses. In particular, Keytruda for cancer represents a key blockbuster with multi-billion-dollar potential: It holds a first-mover advantage in one of the largest cancer indications of non-small cell lung cancer with excellent clinical data. Also, we expect new cancer drug combinations will further propel Merck’s overall drug sales. – Morningstar
Merck is flying high on cancer drugs, the fastest growing and highest margin part of the industry.
FactSet Research Terminal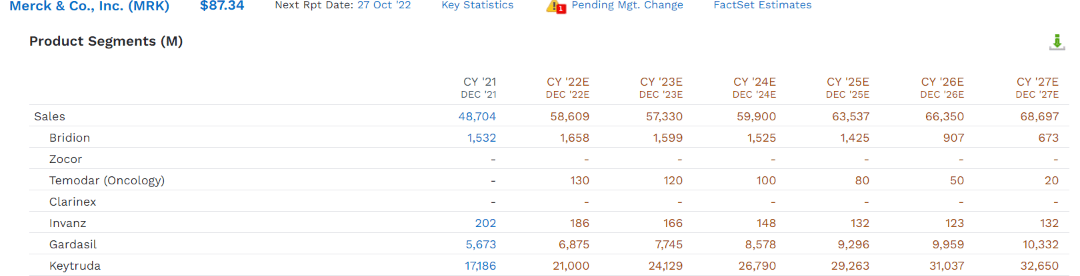
Keytruda patents begin to expire in 2028 in the EU and in 2036 in the US. By 2027 analysts expect almost $33 billion in Keytruda sales.
If analysts are right, then Keytruda is going to be the best-selling drug in history.
Keytruda: On Its Way To The Best-Selling Drug In History
| Year |
Keytruda Sales (Millions) |
| 2014 | $53 |
| 2015 | $566 |
| 2016 | $1,402 |
| 2017 | $3,809 |
| 2018 | $7,171 |
| 2019 | $11,084 |
| 2020 | $14,380 |
| 2021 | $17,186 |
| 2022 | $21,000 |
| 2023 | $24,129 |
| 2024 | $26,790 |
| 2025 | $29,263 |
| 2026 | $31,037 |
| 2027 | $32,650 |
| Total | $220,520 |
(Source: FactSet Research Terminal)
Pfizer’s Lipitor achieved $97 billion in sales before it hit its patent cliff, AbbVie’s Humira, $76 billion.
Keytruda still has plenty of patent runway to go and is expected to reach $221 billion in cumulative sales before it starts hitting its patent cliff.
- US patent protection until 2036
- US is 46% of MRK sales (likely a similar amount of Keytruda sales)
Suppose AbbVie’s Humira patent cliff is any indication (also a blockbuster immunology drug). In that case, MRK’s peak Keytruda sales might not arrive until 2035 and allow Keytruda to potentially achieve nearly $500 billion in cumulative lifetime sales.
But of course, MRK is not resting on its laurels with Keytruda, but investing heavily into other blockbusters.
That includes buying Acceleron Pharma to gain Sotatercept, a cardiovascular drug that analysts think could potentially reach $10 billion+ in annual peak sales.
| Metric | Merck |
| Quality | 91% 13/13 Ultra SWAN (Sleep Well At Night) Drug Giant |
| Risk Rating | Very Low Risk |
| DK Master List Quality Ranking (Out Of 500 Companies) | 66 |
| Quality Percentile | 87% |
| Dividend Growth Streak (Years) | 10 |
| Dividend Yield | 3.20% |
| Dividend Safety Score | 94% very safe |
| Average Recession Dividend Cut Risk | 0.5% |
| Severe Recession Dividend Cut Risk | 1.3% |
| S&P Credit Rating |
A+ Stable Outlook |
| 30-Year Bankruptcy Risk | 0.6% |
| Consensus LT Risk-Management Industry Percentile | 82% Very Good |
| Fair Value | $102.61 |
| Current Price | $87.34 |
| Discount To Fair Value | 15% |
| DK Rating |
Potentially Strong Buy |
| PE | 11.8 |
| Cash-Adjusted PE | 9.9 |
| Growth Priced In | 2.80% |
| Historical PE Range | 13.5 to 16 |
| LT Growth Consensus/Management Guidance | 14.0% |
| PEG Ratio | 0.70 (Growth at A Wonderful Price) |
| 5-year consensus total return potential |
12% to 16% CAGR |
| Base Case 5-year consensus return potential |
15% CAGR (2X better than the S&P 500) |
| Consensus 12-month total return forecast | 6% |
| Fundamentally Justified 12-Month Return Potential | 21% |
| LT Consensus Total Return Potential | 17.2% |
| Inflation-Adjusted Consensus LT Return Potential | 15.0% |
| Consensus 10-Year Inflation-Adjusted Total Return Potential (Ignoring Valuation) | 4.04 |
| LT Risk-Adjusted Expected Return | 11.97% |
| LT Risk-And Inflation-Adjusted Return Potential | 9.75% |
| Conservative Years To Double | 7.39 |
(Source: Dividend Kings Zen Research Terminal)
I fully expect MRK’s growth outlook to dim in the coming years.
- Moody’s estimates Pharma is growing 4% as an industry
But MRK’s risk and inflation-adjusted return potential of nearly 10% is one of the best of any big drug maker and is better than the S&P 500 and dividend aristocrats.
| Investment Strategy | Yield | LT Consensus Growth | LT Consensus Total Return Potential | Long-Term Risk-Adjusted Expected Return | Long-Term Inflation And Risk-Adjusted Expected Returns | Years To Double Your Inflation & Risk-Adjusted Wealth |
10-Year Inflation And Risk-Adjusted Expected Return |
| Merck | 3.2% | 14.0% | 17.2% | 12.0% | 9.8% | 7.4 | 2.54 |
| Dividend Aristocrats | 2.4% | 8.6% | 11.0% | 7.7% | 5.4% | 13.4 | 1.69 |
| S&P 500 | 1.7% | 8.5% | 10.2% | 7.1% | 4.9% | 14.8 | 1.61 |
| Nasdaq | 0.9% | 11.8% | 12.7% | 8.9% | 6.6% | 10.9 | 1.89 |
(Source: DK Research Terminal, Morningstar, FactSet, YCharts)
Inflation-Adjusted Consensus Total Return Potential: $1,000 Initial Investment
| Time Frame (Years) | 7.9% CAGR Inflation-Adjusted S&P 500 Consensus | 8.7% Inflation-Adjusted Dividend Aristocrats Consensus | 9.8% CAGR Inflation And Risk-Adjusted MRK Consensus | Difference Between Inflation And Risk-Adjusted MRK Consensus Vs. S&P Consensus |
| 5 | $1,461.18 | $1,516.17 | $1,592.29 | $131.11 |
| 10 | $2,135.06 | $2,298.77 | $2,535.39 | $400.34 |
| 15 | $3,119.71 | $3,485.33 | $4,037.09 | $917.38 |
| 20 | $4,558.47 | $5,284.36 | $6,428.22 | $1,869.75 |
| 25 | $6,660.75 | $8,012.00 | $10,235.60 | $3,574.84 |
| 30 | $9,732.58 | $12,147.56 | $16,298.06 | $6,565.47 |
(Source: DK Research Terminal, FactSet)
Adjusting for MRK’s future downward earnings growth revisions, we can realistically expect about 16X inflation-adjusted returns from MRK, potentially significantly more than from the S&P 500 or dividend aristocrats.
| Time Frame (Years) | Ratio Dividend Aristocrats/S&P Consensus | Ratio Inflation And Inflation And Risk-Adjusted MRK Consensus vs. S&P consensus |
| 5 | 1.04 | 1.09 |
| 10 | 1.08 | 1.19 |
| 15 | 1.12 | 1.29 |
| 20 | 1.16 | 1.41 |
| 25 | 1.20 | 1.54 |
| 30 | 1.25 | 1.67 |
(Source: DK Research Terminal, FactSet)
But you don’t have to wait for decades to achieve great returns with Merck.
Merck 2024 Consensus Total Return Potential
(Source: FAST Graphs, FactSet Research)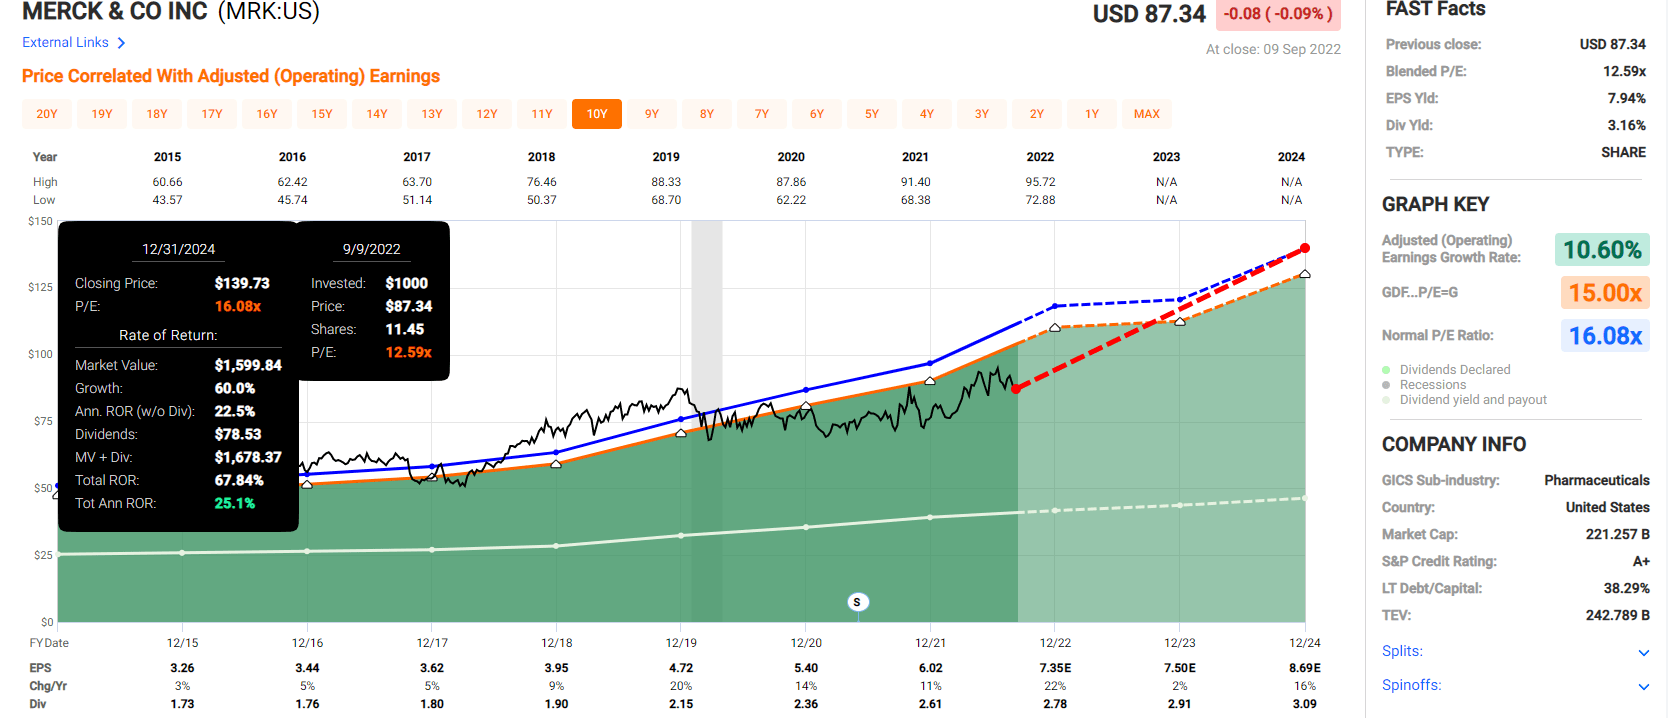
Merck 2027 Consensus Total Return Potential
(Source: FAST Graphs, FactSet Research)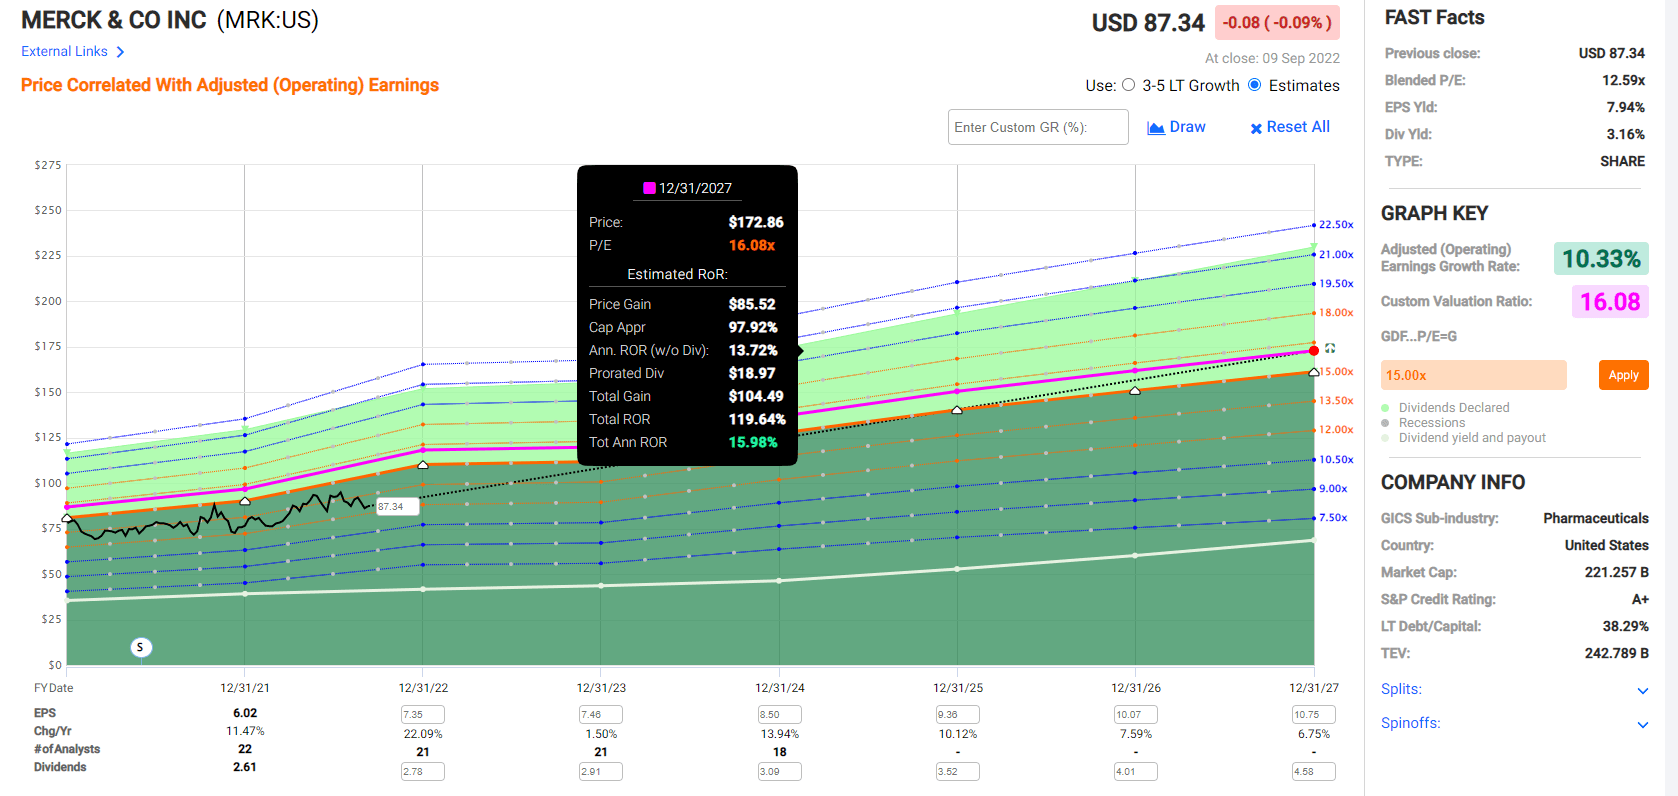
If MRK grows as expected over the next three years, it could deliver 25% annual returns, Buffett-like return potential from a blue-chip bargain hiding in plain sight.
Through 2027 analysts expect about 120% annual returns, or 16% CAGR, nearly 3X more than the S&P 500.
Merck Investment Decision Score
DK Dividend Kings Automated Investment Decision Tool
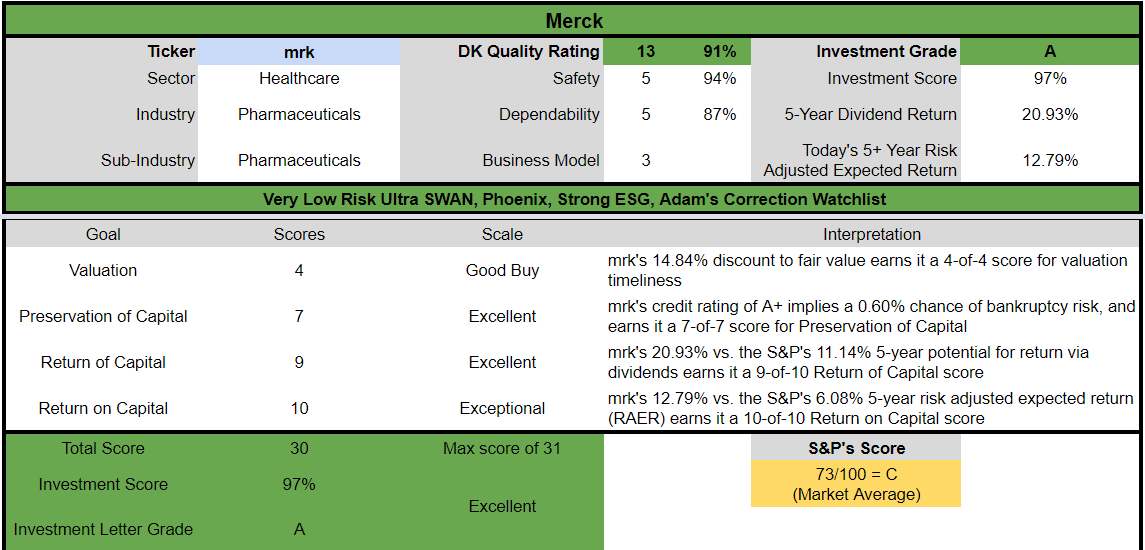
MRK is a reasonable high-yield Ultra SWAN choice for anyone comfortable with its risk profile.
- 15% discount vs. 2% market premium = 17% better valuation
- 3.2% yield vs. 1.6% yield (2X the yield and a much safer yield at that)
- 70% higher consensus annual long-term return potential
- 2X better risk-adjusted expected return over the next five years
- 2X more income over the next five years
Bottom Line: Magellan And Merck Are Perfect Ultra SWANs For Uncertain Times
Am I claiming that stocks will fall 30% more? No, I’m saying that if we get a recession, then a 29% further decline wouldn’t be a surprise.
Am I claiming that MRK and MMP are going to keep going up even if the market falls a lot more? No, I’m saying that they are both recession-resistant businesses that can help you sleep well at night thanks to very safe, generous, and steadily growing income in all market and economic conditions.
Michael Batnick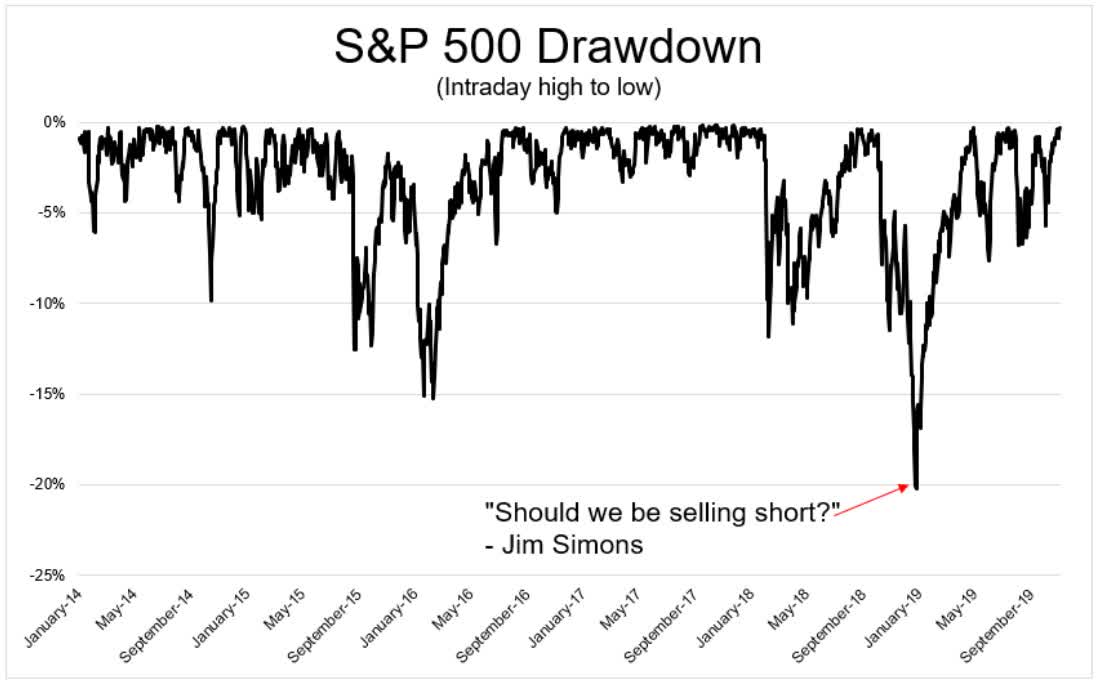
Back in the 2018 bear market Jim Simons almost shorted the market by the billions.
Who is Jim Simons? Only the single greatest quant trader in the history of trading.
Ben Carlson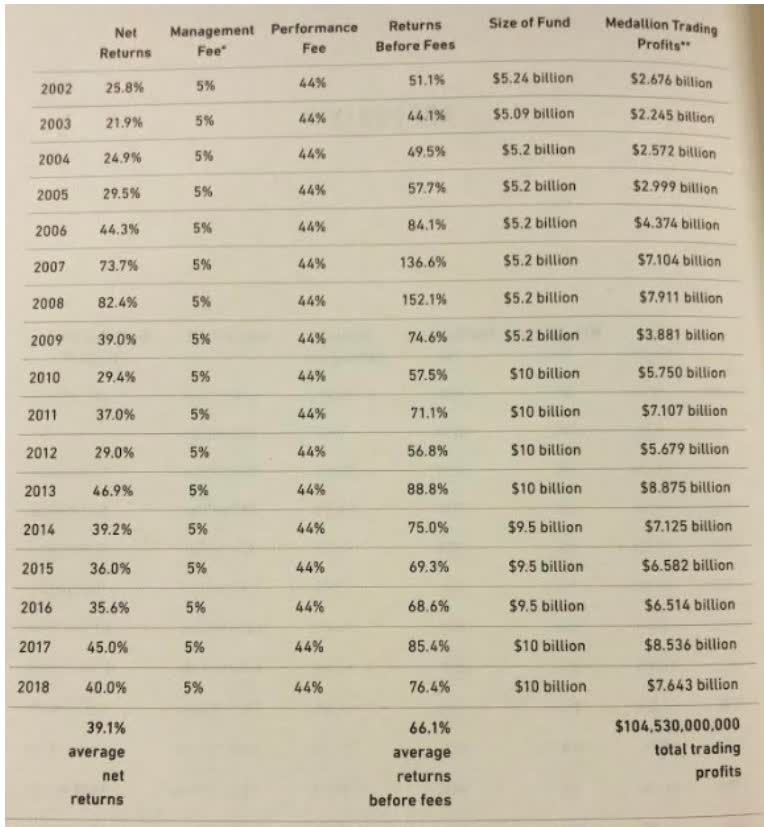
If the greatest trader of all time can’t time bear market bottoms, why should you even try?
- Renaissance Tech’s performance is from making millions of daily trades
- and locking in 1% gains or losses on each one
- and being right 52% of the time
- No traditional market timing
- No “all in or all out” bets on what stocks will do next
The answer is simple. You shouldn’t.
Charlie Bilello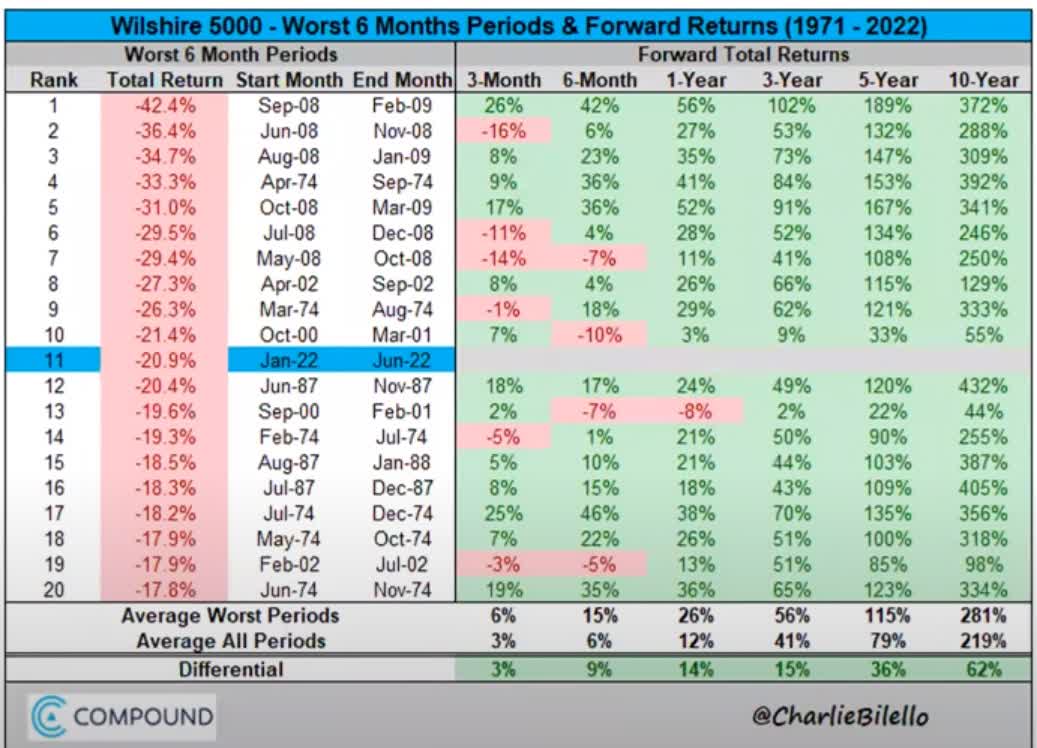
The average 10-year return after an 18+% six-month decline is 281%, almost a 4X return.
Charlie Bilello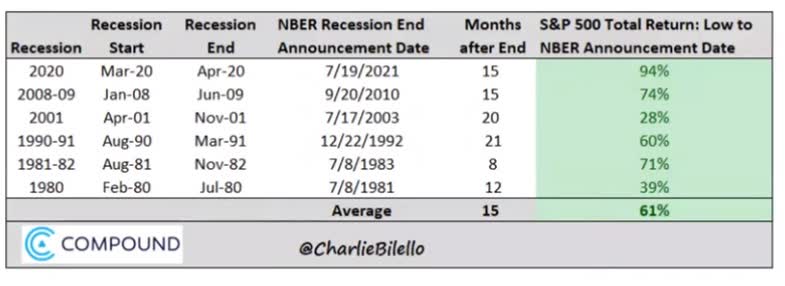
If you wait until recessions are over, you miss out on an average 61% market rally.
Do you really think that someone sitting 100% in cash through a bear market is going to start buying blue-chips after stocks are up 61%?
- cash is very addictive
- and guaranteed to lose value over time to inflation
What’s the smart long-term investor to do? Simple, regret minimization.
Charlie Bilello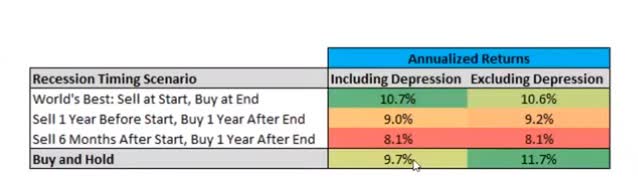
Do you know what avoiding recessions entirely would have done since 1926 (ignoring the Great Depression)? It would have LOWERED your returns compared to buy-and-hold investing.
And that’s if you could perfectly time recessions, which no one can.
Vanguard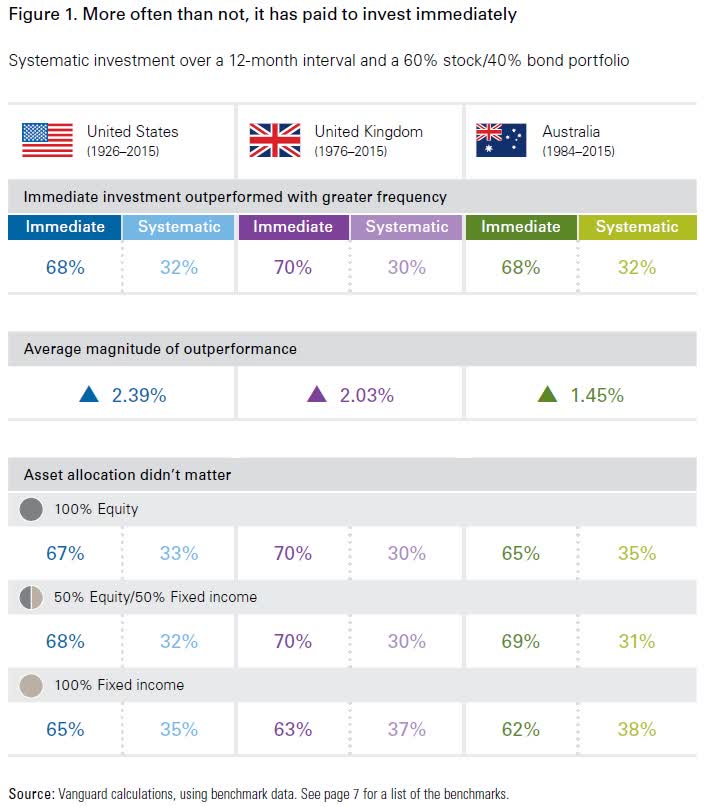
A study from Vanguard looking at 160 years of market history in the US, UK, and Australia found that being fully invested at all times was the optimal call 70% of the time.
- 2.3% better annual returns = 2X more money after 30 years
30% of the time bear markets make it worth having some dry powder to buy the amazing blue-chip bargains.
But guess what? We’re in a bear market now, 16% off the highs, so here are the three things prudent investors can do.
- trust your portfolio’s risk management (stay invested in blue-chips)
- be putting savings to work steadily (time in the market, not market timing)
- keep a bit of cash for an emotional cushion (if stocks fall further, you have a correction bucket to tap into)
It’s OK to be bearish, as long as you remain a fully invested bear.
- from March 2009 to January 2022 stocks went up 8X
- and the entire time, there were lots of investors who didn’t believe the rally could last
- fully invested bears were dragged to incredible profits kicking and screaming the entire way
Magellan Midstream and Merck represent two great defensive high-yield Ultra SWANs (sleep well at night) recommendations for these uncertain times.
If June 16th was the bottom, then they are likely to go up.
If it wasn’t, they are likely to fall less.
Most importantly, they offer generous, very safe, and steadily growing payouts you can trust in all economic and market conditions.
Worried about a 2023 recession that the bond market says is 74% likely?
MMP kept growing its payout when oil hit -$38 and the economy was shut down by government mandate.
Merck hasn’t cut its dividend in at least 37 years, through four recessions, the Pandemic, the Financial Crisis, dozens of bear markets, corrections, and pullbacks.
Unless you think an economic apocalypse is headed our way (it’s not), anyone buying MMP or MRK today has nothing to fear from the Fed, interest rates, or the economy in 2023.
What happens with the stock market over one, two, or even three years is mostly luck.
What happens over 20 to 30 years is fundamentals-driven destiny.
If you want to sleep well at night in this bear market, consider MMP and MRK.
If you want to enjoy generous, safe, and steadily growing yield in all economic and market conditions, MMP and MRK could be what you’re looking for.
And if you want to make your own luck on Wall Street, and retire in safety and splendor, then bear market blue-chip bargains like these are how you can do it.
Be the first to comment