

herkisi
This article was published on Dividend Kings on Tuesday, December 12th.
—————————————————————————————
It’s been a wild 2022 with some ferocious sell-offs as strong as 9% in a single month. That kind of bear market is a gift for long-term income blue-chip investors. Why?
Ben Carlson 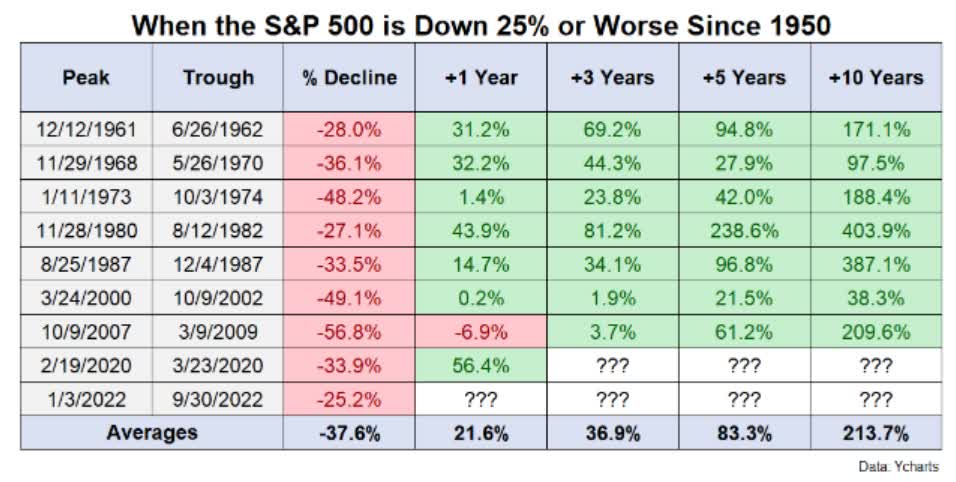
Because even though stocks tend to keep falling (17% on average) after falling 25%, within 12 months, they average a 22% gain. And within 10 years, they historically more than triple.
In other words, buying in bear markets like this can turbocharge your long-term returns, and this is just the S&P 500! Individual blue chips can deliver much better returns from bear market lows, up to 4X to 16X, depending on what bargains you buy.
But how can you find these incredible market-crushing blue-chip bargain opportunities? This is where the Dividend Kings Automated Investment Decision Tool comes in.
How To Easily Tell Whether A Blue-Chip Bargain Is A Superior Buy To The Market
There are four key priorities that successful long-term investors focus on to achieve superior results.
DK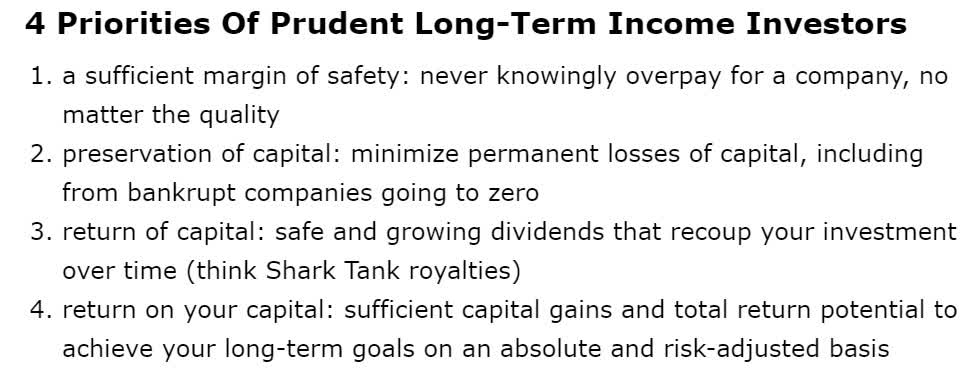
OK, that’s all nice and good, but how can you quickly and easily compare a blue-chip’s investment opportunity against the market?
Let me show you how the Dividend Kings Automated Investment Decision Tool can help answer that.
Like all our tools, it runs off the DK 500 Master List.
The Dividend Kings 500 Master List includes some of the world’s best companies, including:
- every dividend champion (25+ year dividend growth streaks, including foreign aristocrats)
- every dividend aristocrat
- every dividend king (50+ year dividend growth streaks)
- every Ultra SWAN (as close to perfect quality companies as exist)
- the 20% highest quality REITs according to iREIT
- 40 of the world’s best growth blue-chips
The power of the Automated Investment Decision Tool is that in just seconds, you can see how any company compares to the S&P 500 on the top four priorities of successful long-term investors.
Once you go to “file” and “make a copy,” you get a personalized version of this tool that lets you sort by any column.
31 Perfect 100% A+ Exceptional Investment Opportunities For 2023
Dividend Kings Automated Investment Decision Tool
An 100% A+ exceptional opportunity means a company is as close to a perfect investment opportunity compared to the S&P 500 as exists on Wall Street.
Today I wanted to share why Stanley Black & Decker (SWK) and Manulife Financial (MFC) are two such perfect high-yield blue-chip bargains for 2023…and far beyond.
Stanley Black & Decker: A Turnaround Dividend King Bargain That Could Change Your Life
Further Reading
- Stanley Black & Decker Is A Buffett-Style “Fat Pitch” Dividend Aristocrat Bargain
- full deep dive on the investment thesis, growth outlook, and risk profile
Don’t get me wrong, SWK is not a company without risks.
The Worst Bear Market In 37 Years
FAST Graphs, FactSet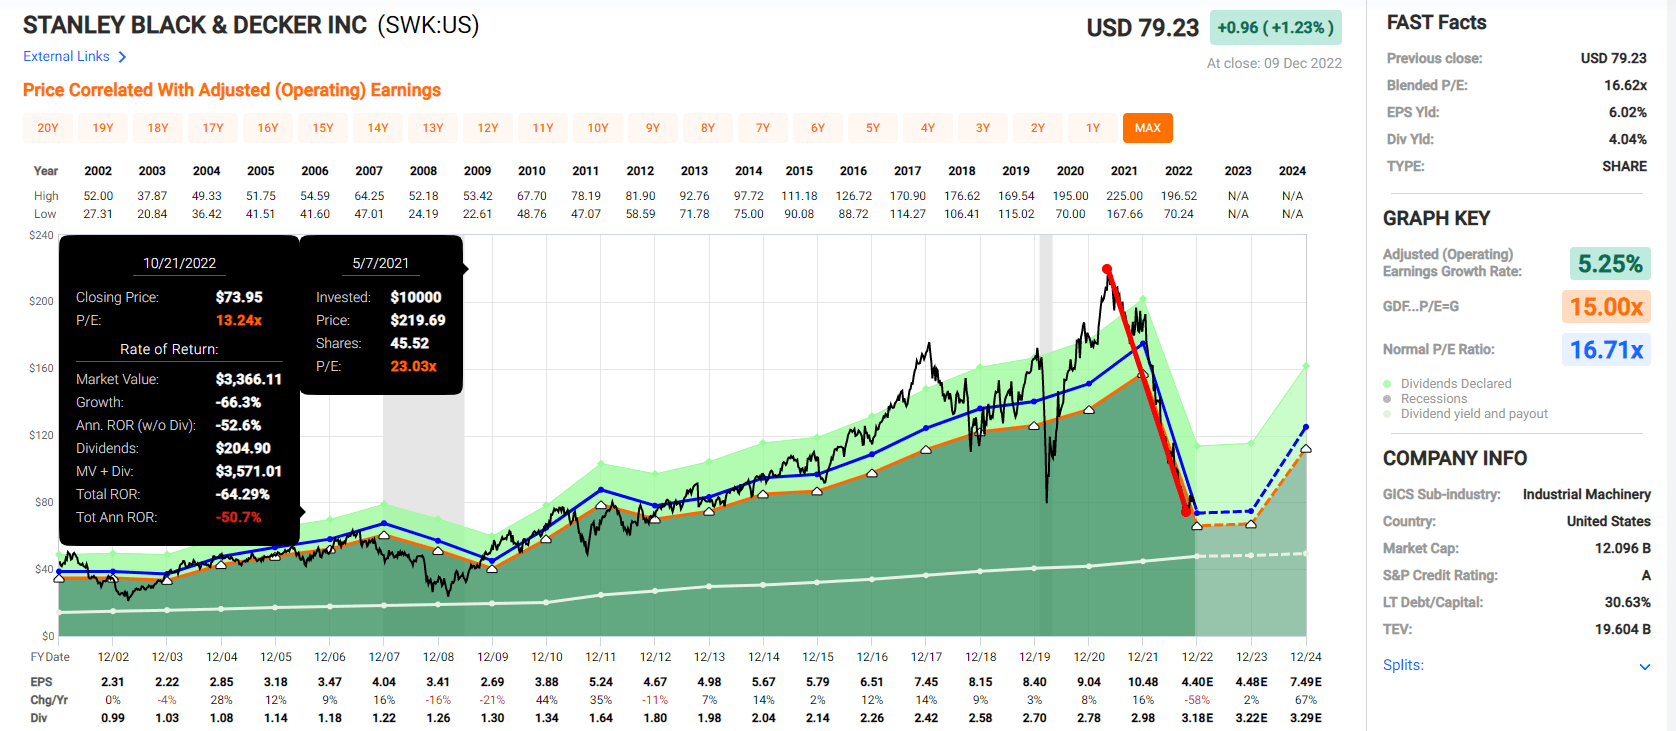
SWK is a speculative blue-chip dividend king because its worst bear market in 37 years has been triggered by the worst earnings collapse in four decades.
- almost twice as bad as the Great Recession
Speculative blue-chips have a 2.5% OR LESS max risk cap recommendation. In this case, because SWK is going through a significant turnaround.
What on earth caused a 58% collapse in earnings? It was a perfect storm of factors, including:
- pull forward demand for tools caused by $10 trillion in stimulus and an epic housing bubble
- historic supply chain disruption due to the Pandemic and China’s lockdowns
- a mild 2023 recession triggered by the most aggressive Fed hiking cycle in 40 years
SWK’s turnaround isn’t expected to be quick; it’s not expected to kick in until 2024.
But here’s why I’m confident that SWK is one turnaround story most analysts and I think will succeed magnificently.
Why I’m Bullish On Stanley, And You Should Be Too
First, let me show you why it’s potentially worth investing up to 2.5% of your portfolio in SWK today.
Rolling Returns Since 1985
Portfolio Visualizer Premium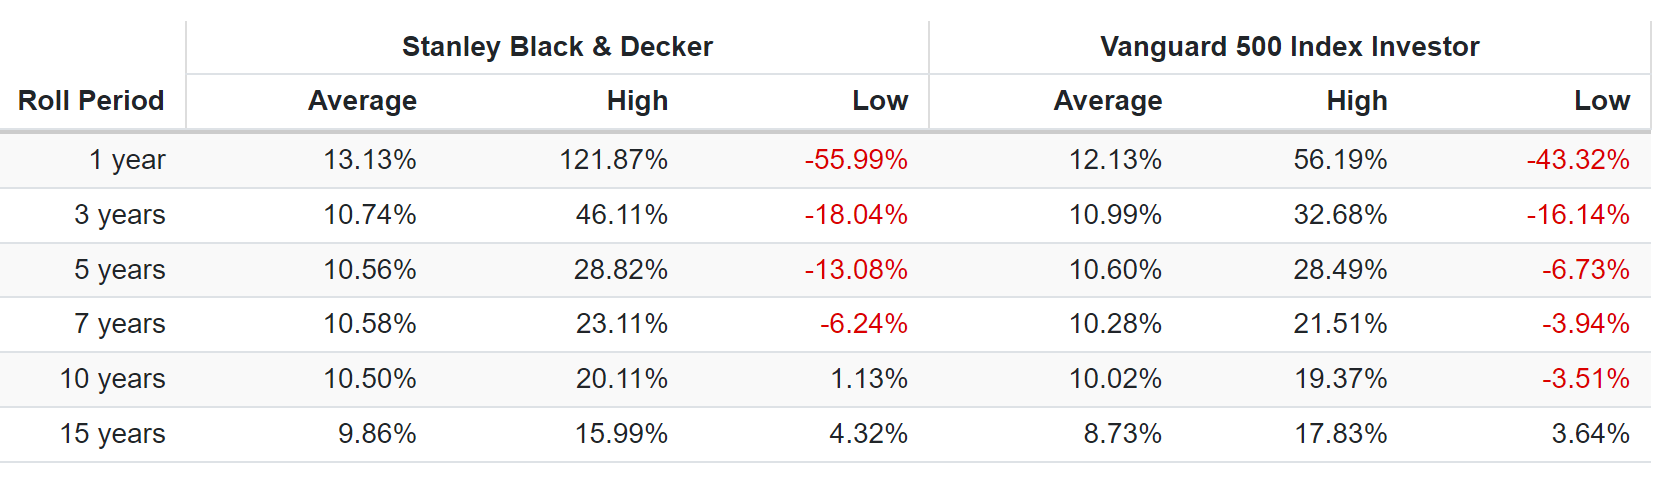
This is the worst bear market in the last 37 years, and from previous bear market lows, it’s delivered some truly exceptional Buffett-like returns.
- up to 122% over the next year
- up to 46% annual returns over the next three years = 3.1X
- up to 29% annual returns over the next five years = 3.6X
- up to 23% annual returns over the next seven years = 4.3X
- up to 20% annual returns over the next decade = 6.2X
But Stanley isn’t just any blue-chip; it’s a dividend king with a 55-year dividend growth streak.
That means it’s been raising its dividend every year since 1967 through:
- nine recessions
- two economic crises
- inflation as high as 15%
- interest rates as high as 20%
- 10-Year US treasury yields as high as 16%
- 30-year mortgage rates as high as 16%
- 13 bear markets
- 22 corrections
- 110 market pullbacks
And that’s just the dividend growth streak!
SWK was founded in 1843 in New Britain, Connecticut. Since then, it’s survived and thrived, during which it has paid uninterrupted dividends for 145 consecutive years through
- 43 US recessions
- eight depressions
- inflation ranging from -3% to 22%
- interest rates ranging from 0.0% to 20%
- 10-year US Treasury yields ranging from 0.5% to 16%
- dozens of bear markets
- 28 stock market corrections (since WWII alone)
- over 100 market pullbacks
SWK is almost certainly going to outlive us all.
- The ultimate “buy and hold forever and leave to your children” dividend blue-chip
Stanley’s Turnaround Plan Is Solid
Investor Presentation
SWK’s turnaround plan is focused on fixing its largest problem, which is its supply chain. It’s also planning on cutting $2 billion in costs over the next three years and investing $400 million into top growth opportunities like electrification.
That’s why management is confident it can boost margins while growing 2.5X faster than its industry as a whole. An industry that Morgan Stanley thinks will benefit from such secular megatrends as:
- a 20-year boom in housing (due to insufficient supply + 150 million Millennials and Gen Zers starting families)
- a global infrastructure boom (Bloomberg estimates a $120 trillion growth market through 2050)
- the rise of electric cars
How on earth does SWK profit from EVs? Because it doesn’t just make power tools, it makes industrial components as well.
Investor Presentation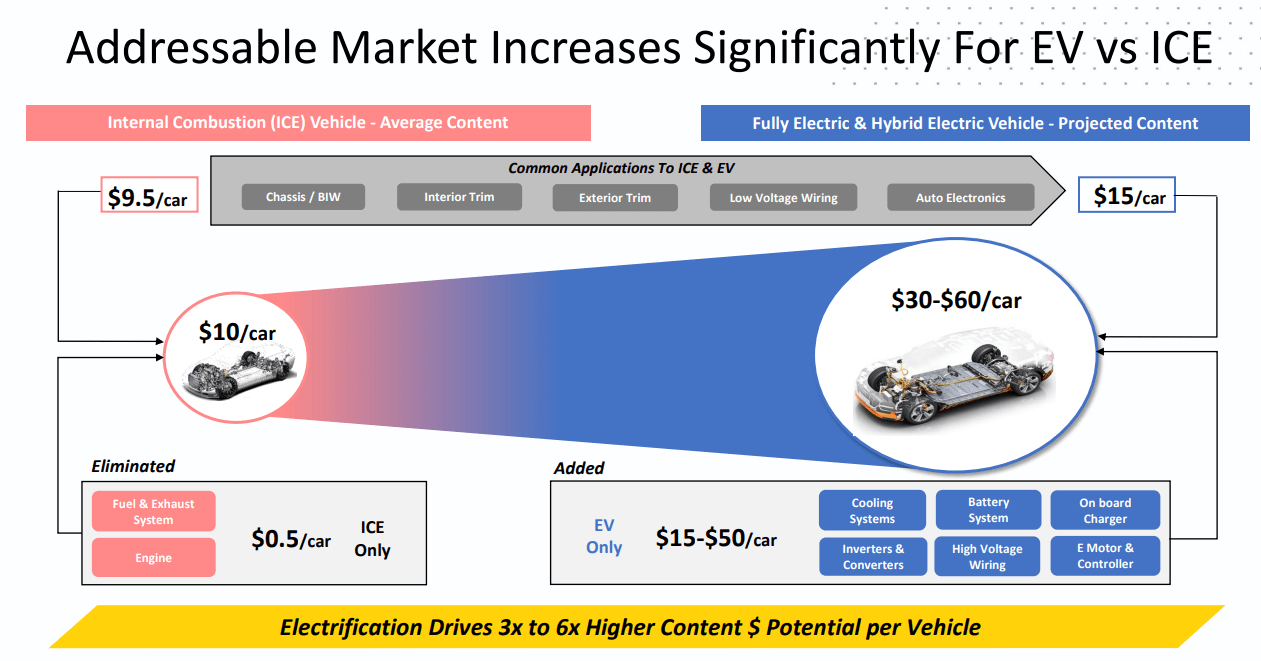
Today’s average gasoline-powered car has $10 in SWK components in it. But the average EV? $30 to $60 worth of components, a 4.5X growth opportunity for this dividend king.
That cost-cutting plan could deliver $1 billion in annualized cost savings by 2023. For context, SWK’s 2021 record net income was just $1.7 billion.
Investor Presentation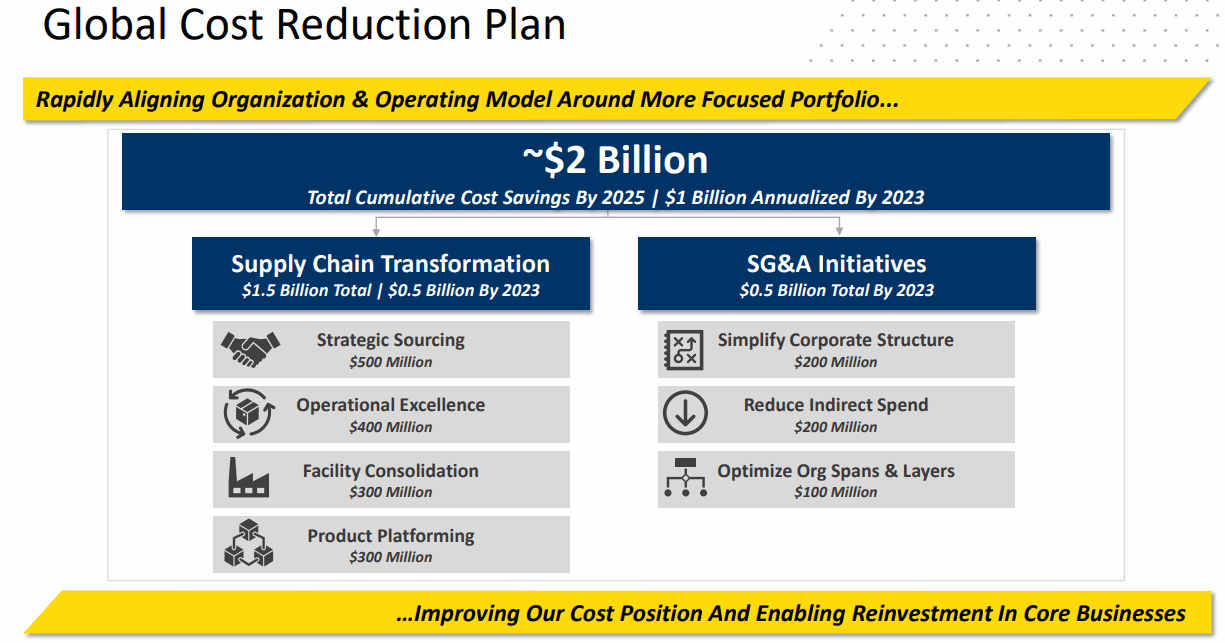
That cost-cutting plan is on track to deliver $1 billion in annualized cost savings by 2023. For context, SWK’s 2021 record net income was just $1.7 billion.
In 2022 alone, management is on track to deliver $175 million in cost savings, ramping up quickly next year and in 2024.
Management plans to take 50% of its free cash flow each year and reinvest into smart M&A to enhance its already incredible brands. It plans to use the other 50% to pay that legendary stable growing dividend and pursue opportunistic buybacks at some of the best valuations in history.
Why I’m Confident Stanley’s Turnaround Will Work
OK, that sounds wonderful, but what evidence is there that SWK can pull off this turnaround? After all, didn’t GE also claim confidence in its turnaround plans before it cut its dividend five times and fell 70% from its record highs?
Investor Presentation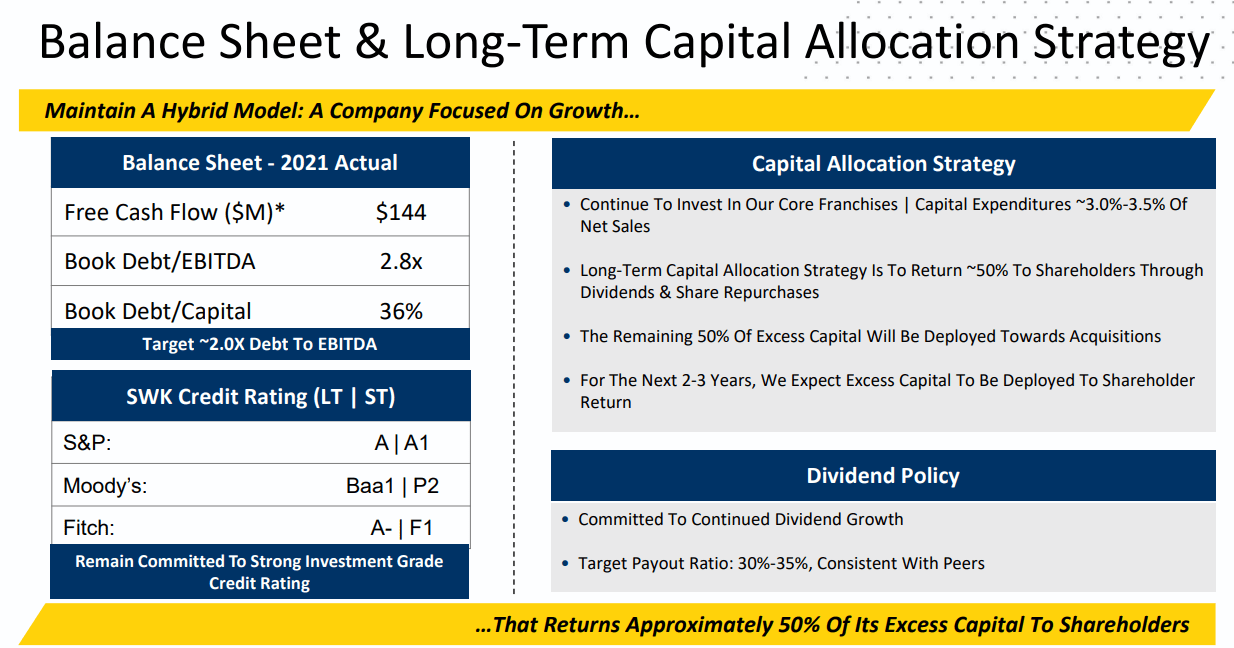
For one thing, SWK’s balance sheet remains strong. Even with a severe collapse in cash flow this year, its leverage ratio is still 2.8X, below the 3.0X that rating agencies consider safe for industrials.
That’s why the rating agencies aren’t overly concerned about its turnaround efforts.
Stanley Black & Decker Credit Ratings
| Rating Agency | Credit Rating | 30-Year Default/Bankruptcy Risk | Chance of Losing 100% Of Your Investment 1 In |
| S&P | A Stable Outlook | 0.66% | 151.5 |
| Fitch | A- Negative Outlook | 2.50% | 40.0 |
| Moody’s | Baa1 (BBB+ Equivalent) Negative Outlook | 5% | NA |
| Consensus | A- Negative Outlook | 2.72% | 36.8 |
(Source: S&P, Fitch, Moody’s)
A negative outlook means a 33% chance that the rating will get downgraded, in this case to between BBB and BBB+ for Fitch and Moody’s. S&P doesn’t even have SWK on a negative outlook and last reviewed it on October 6th, 2022.
In other words, the rating agencies are approximately 97% confident that SWK’s turnaround will work, at least from the perspective of bond investors worried about getting paid on its debt.
FactSet Research Terminal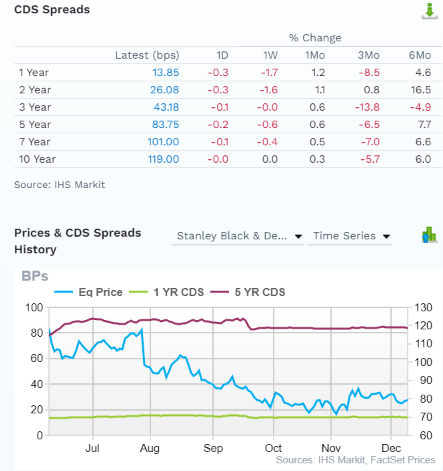
The bond market is also confident in SWK’s prospects, as you can see by its credit default swaps. These are real-time fundamental risk assessments courtesy of insurance policies bond investors take against short to medium-term default.
Note how SWK’s five-year default risk has been relatively steady at 0.84% for the last six months while the share price has collapsed.
- The “smart money” on Wall Street isn’t worried about SWK’s turnaround prospects
Stanley’s Long-Term Risk Management Is Exceptional
DK uses S&P Global’s global long-term risk-management ratings for our risk rating.
- S&P has spent over 20 years perfecting their risk model
- which is based on over 30 major risk categories, over 130 subcategories, and 1,000 individual metrics
- 50% of metrics are industry specific
- this risk rating has been included in every credit rating for decades
The DK risk rating is based on the global percentile of how a company’s risk management compares to 8,000 S&P-rated companies covering 90% of the world’s market cap.
SWK scores 98th Percentile On Global Long-Term Risk Management
S&P’s risk management scores factor in things like:
- supply chain management
- crisis management
- cyber-security
- privacy protection
- efficiency
- R&D efficiency
- innovation management
- labor relations
- talent retention
- worker training/skills improvement
- occupational health & safety
- customer relationship management
- business ethics
- climate strategy adaptation
- sustainable agricultural practices
- corporate governance
- brand management
| Classification | S&P LT Risk-Management Global Percentile |
Risk-Management Interpretation |
Risk-Management Rating |
| BTI, ILMN, SIEGY, SPGI, WM, CI, CSCO, WMB, SAP, CL | 100 | Exceptional (Top 80 companies in the world) | Very Low Risk |
| Stanley Black & Decker | 98 |
Exceptional |
Low Risk (Very Low Risk Once The Turnaround Succeeds) |
| Strong ESG Stocks | 86 |
Very Good |
Very Low Risk |
| Foreign Dividend Stocks | 77 |
Good, Bordering On Very Good |
Low Risk |
| Ultra SWANs | 74 | Good | Low Risk |
| Dividend Aristocrats | 67 | Above-Average (Bordering On Good) | Low Risk |
| Low Volatility Stocks | 65 | Above-Average | Low Risk |
| Master List average | 61 | Above-Average | Low Risk |
| Dividend Kings | 60 | Above-Average | Low Risk |
| Hyper-Growth stocks | 59 | Average, Bordering On Above-Average | Medium Risk |
| Dividend Champions | 55 | Average | Medium Risk |
| Monthly Dividend Stocks | 41 | Average | Medium Risk |
(Source: DK Research Terminal)
S&P considers SWK’s long-term risk management to be exceptional, better than all but 160 companies it rates in the world. That’s why S&P is so confident the turnaround will succeed.
FactSet Research Terminal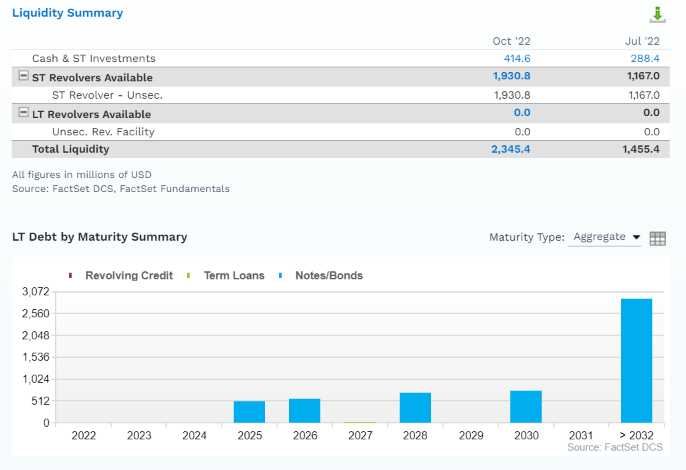
SWK has almost $2.4 billion in liquidity right now and no bonds maturing until 2025, long after the recession is over. In fact, SWK’s $3 billion in cost savings by 2025 alone are enough to pay off all its bonds maturing through 2030 and then some.
FactSet Research Terminal
SWK’s free cash flow is expected to be -$1.1 billion in 2022, the turnaround year, and then recover to $1.1 billion to $1.5 billion starting in 2023.
- more than enough to service its debt, pay dividends, and buyback stock
In fact, in 2022 alone, SWK is expected to buy back $2.3 billion in shares at some of the best valuations in its history. And it’s expected to buy back another $1.1 billion in the next two years.
How much is $3.4 billion in potential buybacks for a company of SWK’s size?
At current valuations, it’s enough to repurchase about 25% of shares.
- 9% in 2023 and 2024 alone
Ok, so maybe SWK’s turnaround plan is sound, and management, rating agencies, and the bond market are confident it will succeed. But what about the long-term growth prospects?
Consensus Long-Term Return Potential (Ignoring Valuation)
| Investment Strategy | Yield | LT Consensus Growth | LT Consensus Total Return Potential | Long-Term Risk-Adjusted Expected Return | Long-Term Inflation And Risk-Adjusted Expected Returns | Years To Double Your Inflation & Risk-Adjusted Wealth |
10-Year Inflation And Risk-Adjusted Expected Return |
| Stanley Black & Decker | 4.0% | 13.3% | 17.3% | 12.1% | 9.7% | 7.4 | 2.53 |
| Nasdaq | 0.8% | 11.8% | 12.6% | 8.8% | 6.4% | 11.2 | 1.87 |
| Safe Midstream | 5.9% | 6.4% | 12.3% | 8.6% | 6.2% | 11.6 | 1.83 |
| Schwab US Dividend Equity ETF | 3.5% | 8.5% | 12.0% | 8.4% | 6.0% | 12.1 | 1.78 |
| Dividend Aristocrats | 1.9% | 8.5% | 10.4% | 7.3% | 4.9% | 14.8 | 1.61 |
| S&P 500 | 1.7% | 8.5% | 10.2% | 7.1% | 4.7% | 15.2 | 1.59 |
| REITs | 3.9% | 6.1% | 10.0% | 7.0% | 4.6% | 15.7 | 1.57 |
| 60/40 Retirement Portfolio | 2.1% | 5.1% | 7.2% | 5.0% | 2.6% | 27.3 | 1.30 |
(Source: DK Research Terminal, FactSet, Morningstar, YCharts)
SWK not only offers a very safe 4.0% yield that’s far more than almost any other high-yield blue-chip strategy, but its consensus long-term return potential is a spectacular 17% after its worst bear market in 37 years.
Reasons To Potentially Buy Stanley Black & Decker Today
| Metric | Stanley Black & Decker |
| Quality | 86% 12/13 Speculative Blue-Chip Quality Dividend King |
| Risk Rating | Low Risk |
| DK Master List Quality Ranking (Out Of 500 Companies) | 205 |
| DK Master List Quality Percentile | 59% |
| Dividend Growth Streak (Years) | 55 |
| Dividend Yield | 4.00% |
| Dividend Safety Score | 89% |
| Average Recession Dividend Cut Risk | 0.5% |
| Severe Recession Dividend Cut Risk | 1.60% |
| S&P Credit Rating |
A Stable Outlook |
| 30-Year Bankruptcy Risk | 0.66% |
| LT S&P Risk-Management Global Percentile |
98% Very Good, Low Risk |
| Fair Value | $112.45 |
| Current Price | $79.23 |
| Discount To Fair Value | 30% |
| DK Rating |
Potential Strong Speculative Buy |
| PE | 17.9 |
| Cash-Adjusted PE | 12.6 |
| Growth Priced In | 8.2% |
| Historical PE | 16.5 to 18.5 |
| LT Growth Consensus/Management Guidance | 13.3% |
| 5-year consensus total return potential |
18% to 22% CAGR |
| Base Case 5-year consensus return potential |
20% CAGR (4X S&P 500) |
| Consensus 12-month total return forecast | 11.0% |
| Fundamentally Justified 12-Month Return Potential | 46% |
| LT Consensus Total Return Potential | 17.3% |
| Inflation-Adjusted Consensus LT Return Potential | 15.0% |
| Consensus 10-Year Inflation-Adjusted Total Return Potential (Ignoring Valuation) | 4.04 |
| LT Risk-Adjusted Expected Return | 12.03% |
| LT Risk-And Inflation-Adjusted Return Potential | 9.70% |
| Conservative Years To Double | 7.4 vs. 15.0 S&P 500 |
(Source: DK Zen Research Terminal)
SWK is trading at 17.9X this year’s trough earnings and just 12.6X cash-adjusted earnings. It has the potential to deliver Buffett-like returns for the next five years or longer.
In fact, it could potentially double your money, adjusted for risk and inflation, twice as fast as the S&P 500.
Stanley Black & Decker 2024 Consensus Total Return Potential
(Source: FAST Graphs, FactSet)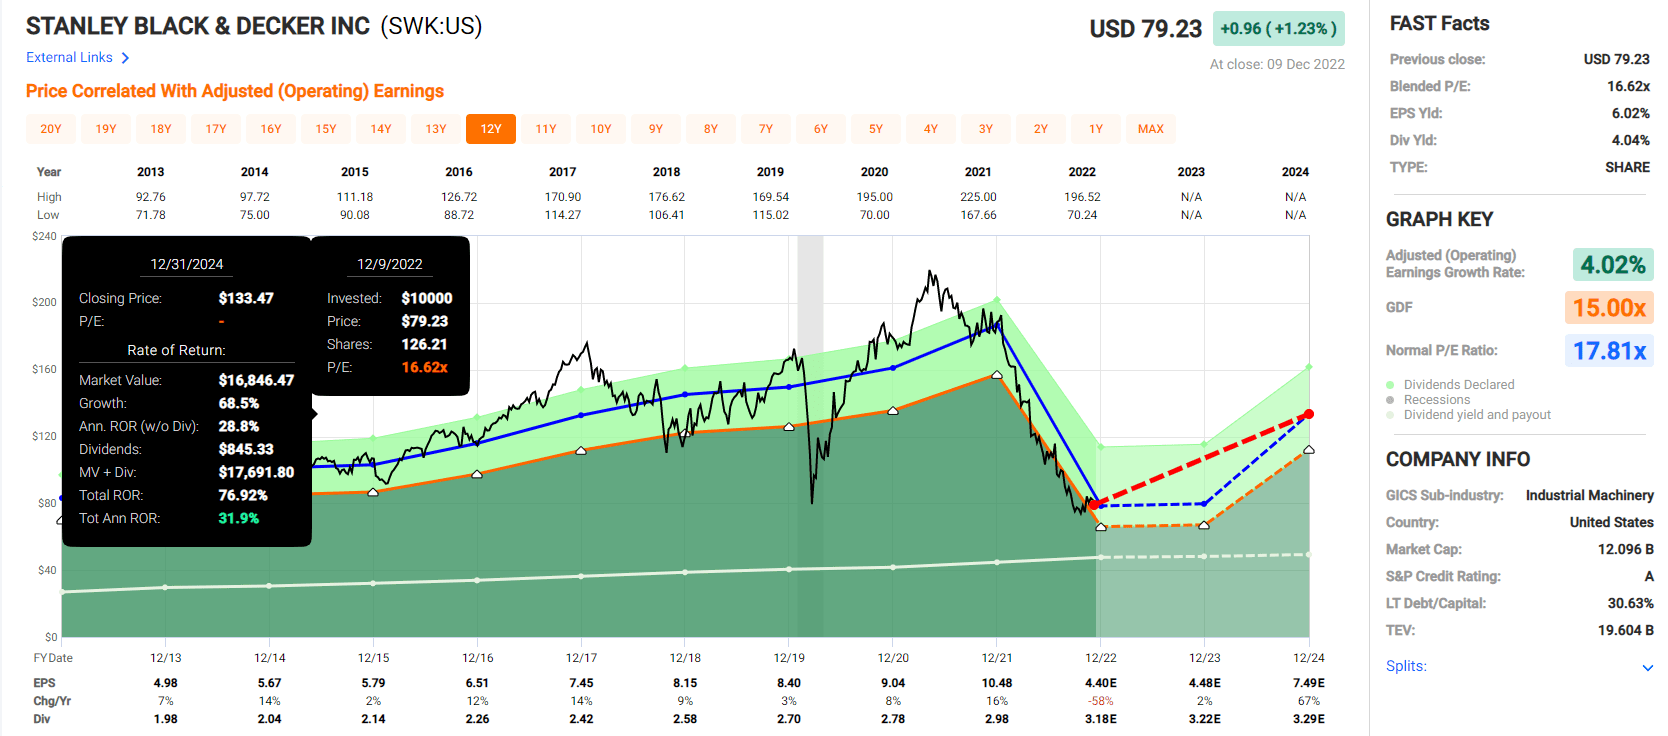
If SWK grows as expected and returns to historical mid-range market-determined fair value, it could deliver 77% total returns by 2024.
- 32% annual returns
- Buffett-like return potential that’s about 3X more than the S&P 500 consensus
Stanley Black & Decker 2028 Consensus Total Return Potential
(Source: FAST Graphs, FactSet)
If SWK grows as expected and returns to historical mid-range market-determined fair value, it could deliver triple by 2028.
- Buffett-like 20% annual return potential
- almost 4X the S&P 500 consensus
- 6.9% 2028 consensus yield on today’s cost
Stanley Black & Decker Investment Decision Tool
Dividend Kings Automated Investment Decision Tool
SWK is a potentially exceptional speculative high-yield deep-value dividend king opportunity for anyone comfortable with its risk profile. Look at how it compares to the S&P 500.
- 31% discount to fair value vs. 1% premium S&P = 32% better valuation
- 4.0% safe yield vs. 1.7% (2.5X higher and much safer)
- approximately 17.3% long-term annual return potential vs. 10.2% CAGR S&P
- about 3X higher risk-adjusted expected returns
- 2X higher income potential over five years
Manulife Financial: One Of The Best Insurance Companies You Can Buy Today
Further Reading
- Manulife: A 5.2% Yielding Blue Chip Too Cheap To Ignore
- full deep dive on the investment thesis, growth outlook, and risk profile
Bottom Line upfront.
Note on MFC’s latest Dividend Kings safety and quality score.
MFC has downgraded to 10/13 Blue-Chip, mostly due to the revised safety and quality model, emphasizing the dividend growth and non-dividend cut streak. Specifically, we are punishing past dividends slightly more than before (the historical data says streaks are more important than we had previously had the weighting). Each year that MFC’s streaks improve, safety will improve. We also increased the weighting of historical returns (in the dependability model), which reduces the scores a bit since MFC’s 10 and 15-year rolling returns have been below the markets.
- Overtime MFC’s scores should improve steadily
Tax Implications
- What You Need To Know About Foreign Dividend Withholding Taxes
- MFC is a Canadian company
- 15% withholding tax for Americans in taxable accounts
- NO WITHHOLDING in retirement accounts
- tax credit recoups the withholding for most investors but requires some paperwork
YCharts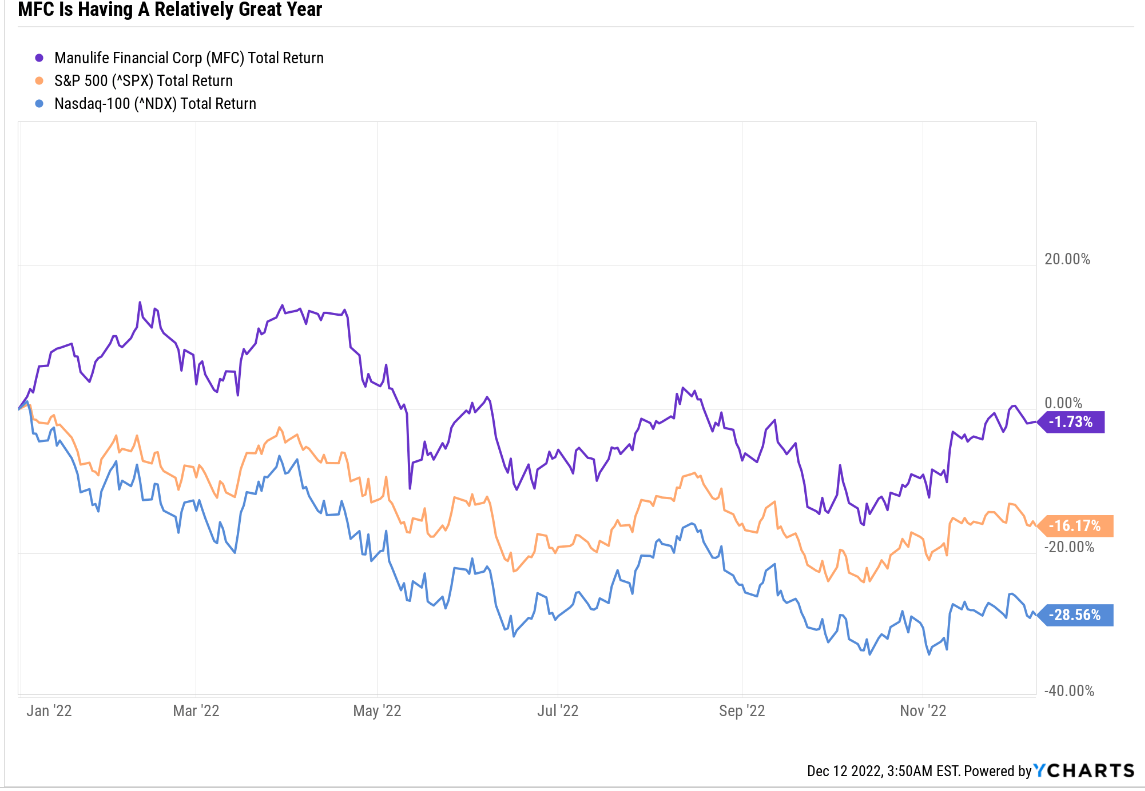
MFC is a historically volatile insurance company that might be hammered a lot worse in a year of growing recession risk than the broader market.
- MFC is down 2% while the S&P is down 16% and Nasdaq 29%
Why might that be? MFC has spent several years trading at anti-bubble valuations, already pricing in a recession.
- Outside of the Pandemic crash, the lowest PE in five years
How justified is the current bear market for MFC? A bear market that began in the Great Recession and resulted in a 77% peak decline?
Manulife’s Balance Sheet Is Very Strong
| Rating Agency | Credit Rating | 30-Year Default/Bankruptcy Risk | Chance of Losing 100% Of Your Investment 1 In |
| S&P | A Stable Outlook | 0.66% | 151.5 |
| Fitch | A Stable Outlook | 0.66% | 151.5 |
| DBRS | A+ Stable Outlook | 0.60% | 166.7 |
| AMBest | A- Stable Outlook | 2.50% | 40.0 |
| Consensus | A Stable Outlook | 1.11% | 90.5 |
(Sources: S&P, Fitch, Morningstar, AMBest)
It’s not justified by MFC’s A-rated balance sheet.
- 8.3% growth consensus for MFC
- 6.1% growth consensus for (SLF)
It’s not justified by MFC’s solid growth outlook.
Basically, MFC offers a 1% higher safe yield than SLF and a 2.2% faster growth potential, meaning a 3.2% higher long-term return potential than the industry leader.
- 158% higher long-term inflation-adjusted return potential than SLF over 30 years
Investor presentation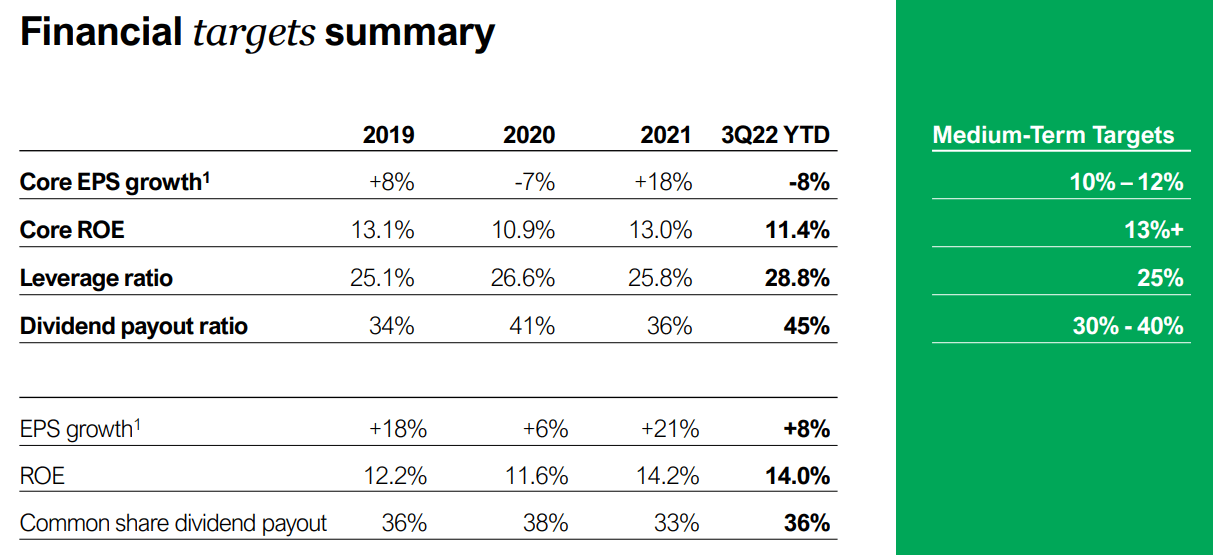
It’s not justified by MFC’s medium-term growth guidance for double-digit growth and a very safe 35% payout ratio.
What about the long-term growth outlook?
Consensus Long-Term Return Potential (Ignoring Valuation)
| Investment Strategy | Yield | LT Consensus Growth | LT Consensus Total Return Potential | Long-Term Risk-Adjusted Expected Return | Long-Term Inflation And Risk-Adjusted Expected Returns | Years To Double Your Inflation & Risk-Adjusted Wealth |
10-Year Inflation And Risk-Adjusted Expected Return |
| Safe Midstream | 5.9% | 6.4% | 12.3% | 8.6% | 6.2% | 11.6 | 1.83 |
| Manulife Financial (Analysts Consensus) | 5.5% | 8.3% | 13.8% | 9.7% | 7.3% | 9.9 | 2.02 |
| Manulife Financial (Management Guidance) | 5.5% | 11.0% | 16.5% | 11.6% | 9.2% | 7.9 | 2.40 |
| REITs | 3.9% | 6.1% | 10.0% | 7.0% | 4.6% | 15.7 | 1.57 |
| Schwab US Dividend Equity ETF | 3.5% | 8.5% | 12.0% | 8.4% | 6.0% | 12.1 | 1.78 |
| Dividend Aristocrats | 1.9% | 8.5% | 10.4% | 7.8% | 5.4% | 13.4 | 1.69 |
| 60/40 Retirement Portfolio | 2.1% | 5.1% | 7.2% | 5.0% | 2.6% | 27.3 | 1.30 |
| S&P 500 | 1.7% | 8.5% | 10.2% | 7.1% | 4.7% | 15.2 | 1.59 |
| Nasdaq | 0.8% | 11.8% | 12.6% | 8.8% | 6.4% | 11.2 | 1.87 |
(Sources: DK Research Terminal, FactSet, Morningstar, YCharts)
Even the more conservative growth estimates from management show that MFC is capable of delivering potentially far superior long-term returns, as well as income, than almost any popular investment strategy.
- More than the S&P, aristocrats, SCHD, and even the Nasdaq
Nope, it’s not justified by that, either. What about its long-term total risk management?
MFC scores 81st Percentile On Global Long-Term Risk Management
S&P’s risk management scores factor in things like:
- supply chain management
- crisis management
- cyber-security
- privacy protection
- efficiency
- R&D efficiency
- innovation management
- labor relations
- talent retention
- worker training/skills improvement
- occupational health & safety
- customer relationship management
- business ethics
- climate strategy adaptation
- sustainable agricultural practices
- corporate governance
- brand management
MFC’s Long-Term Risk Management Is The 143rd Best In The Master List 71st Percentile In The Master List)
| Classification | S&P LT Risk-Management Global Percentile |
Risk-Management Interpretation |
Risk-Management Rating |
| BTI, ILMN, SIEGY, SPGI, WM, CI, CSCO, WMB, SAP, CL | 100 | Exceptional (Top 80 companies in the world) | Very Low Risk |
| Strong ESG Stocks | 86 |
Very Good |
Very Low Risk |
| Manulife Financial | 81 |
Very Good |
Very Low Risk |
| Foreign Dividend Stocks | 77 |
Good, Bordering On Very Good |
Low Risk |
| Ultra SWANs | 74 | Good | Low Risk |
| Dividend Aristocrats | 67 | Above-Average (Bordering On Good) | Low Risk |
| Low Volatility Stocks | 65 | Above-Average | Low Risk |
| Master List average | 61 | Above-Average | Low Risk |
| Dividend Kings | 60 | Above-Average | Low Risk |
| Hyper-Growth stocks | 59 | Average, Bordering On Above-Average | Medium Risk |
| Dividend Champions | 55 | Average | Medium Risk |
| Monthly Dividend Stocks | 41 | Average | Medium Risk |
(Source: DK Research Terminal)
MFC’s risk-management consensus is in the top 29% of the world’s best blue chips and is similar to:
- Lowe’s (LOW): Ultra SWAN dividend king
- Target (TGT): Ultra SWAN dividend king
- Nestle (OTCPK:NSRGY): Ultra SWAN global aristocrat
- QUALCOMM (QCOM): Ultra SWAN
- Mastercard (MA): Ultra SWAN
MFC has some of the best risk management in the world.
So what justifies MFC’s 15-year bear market? Fundamentally speaking, nothing at all.
Rolling Returns Since 1999
Portfolio Visualizer Premium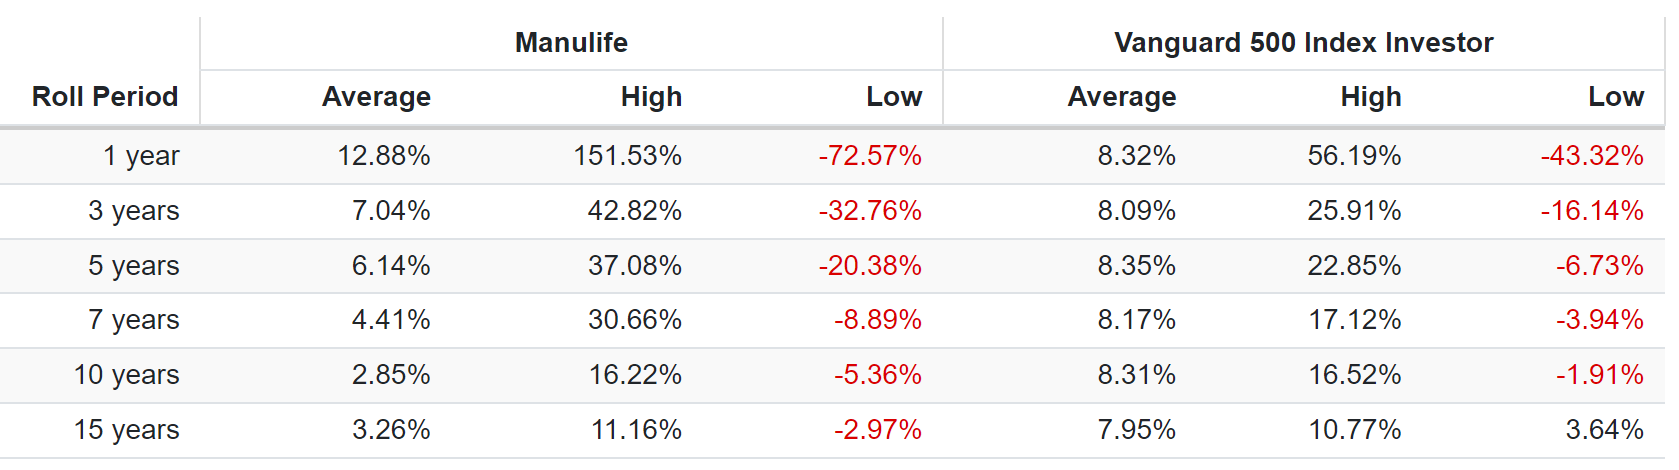
From bear market lows like we’re in now, MFC can have incredible Buffett-like returns.
- one-year returns as strong as 152%
- three-year returns as strong as 43% annually = 3X return
- five-year returns as strong as 37% annually = 4.9X return
- seven-year returns as strong as 31% annually = 6.6X return
And keep in mind that MFC’s balance sheet has become much safer than it was during the Great Recession.
Reason To Potentially Buy Manulife Today
| Metric | Manulife Financial |
| Quality | 70% 10/13 Blue-Chip Quality Insurance Company |
| Risk Rating | Very Low Risk |
| DK Master List Quality Ranking (Out Of 500 Companies) | 449 |
| DK Master List Quality Percentile | 11% |
| Dividend Growth Streak (Years) |
1 (No Cuts Since the GFC in 2009) |
| Dividend Yield | 5.5% |
| Dividend Safety Score | 66% |
| Average Recession Dividend Cut Risk | 1.0% |
| Severe Recession Dividend Cut Risk | 3.40% |
| S&P Credit Rating |
A Stable Outlook |
| 30-Year Bankruptcy Risk | 0.66% |
| LT S&P Risk-Management Global Percentile |
81% Very Good, Very Low Risk |
| Fair Value | $24.27 |
| Current Price | $17.73 |
| Discount To Fair Value | 27% |
| DK Rating |
Potential Good Buy |
| PE | 7.3 |
| Growth Priced In | -2.4% |
| Historical PE | 10 to 13 |
| LT Growth Consensus/Management Guidance | 8.3% |
| 5-year consensus total return potential |
15% to 24% CAGR |
| Base Case 5-year consensus return potential |
18% CAGR (3X S&P 500) |
| Consensus 12-month total return forecast | 14.0% |
| Fundamentally Justified 12-Month Return Potential | 42% |
| LT Consensus Total Return Potential | 13.8% |
| Inflation-Adjusted Consensus LT Return Potential | 11.5% |
| Consensus 10-Year Inflation-Adjusted Total Return Potential (Ignoring Valuation) | 2.96 |
| LT Risk-Adjusted Expected Return | 9.60% |
| LT Risk-And Inflation-Adjusted Return Potential | 7.27% |
| Conservative Years To Double | 9.91 |
(Source: Dividend Kings Zen Research Terminal)
MFC is an anti-bubble blue-chip priced for -2.4% growth, while management is guiding for 11% growth, and analysts expect 8.3%.
- as long as MFC grows faster than 0%, the dividend will remain safe
- and long-term investors can’t lose money if they avoid becoming forced sellers for emotional or financial reasons
How powerful is MFC’s anti-bubble valuation? According to Ben Graham, if MFC were to grow at zero forever and pay out all earnings as dividends, investors would earn about 13.7% long-term returns.
- similar to the 13.8% analysts expect in the future
- management is guiding for 15.5% to 17.5% long-term returns
Manulife 2024 Consensus Total Return Potential
(Source: FAST Graphs, FactSet)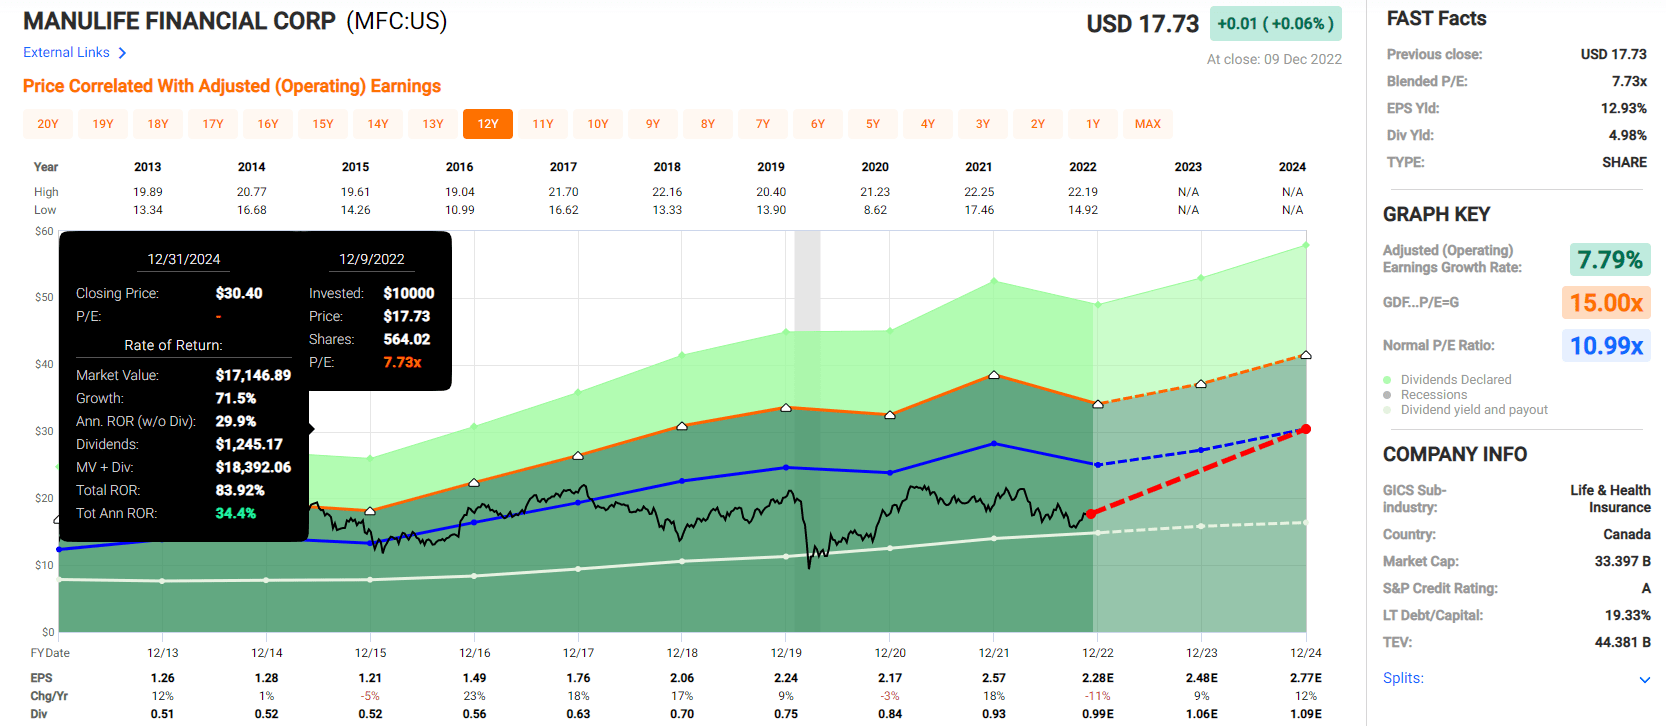
If MFC grows as expected and returns to historical mid-range market-determined fair value since the GFC by 2024, it could nearly double, delivering 34% annual total returns.
- Buffett-like return potential from anti-bubble blue-chip hiding in plain sight
- about 3X more than the S&P 500 consensus
Manulife 2028 Consensus Total Return Potential
(Source: FAST Graphs, FactSet)
If MFC grows as expected over the next five years and returns to historical fair value, it could almost triple over the next five years.
- 18% annual return potential
- 3X more than the S&P 500
- Buffett-like medium-term return potential
- 8.5% consensus yield on today’s cost
Does the potential for a steadily safer 8.5% yield in 2028 from a company growing at 8% to 12% sound appealing? That’s what MFC offers today.
Manulife Investment Decision Score
Dividend Kings Automated Investment Decision Tool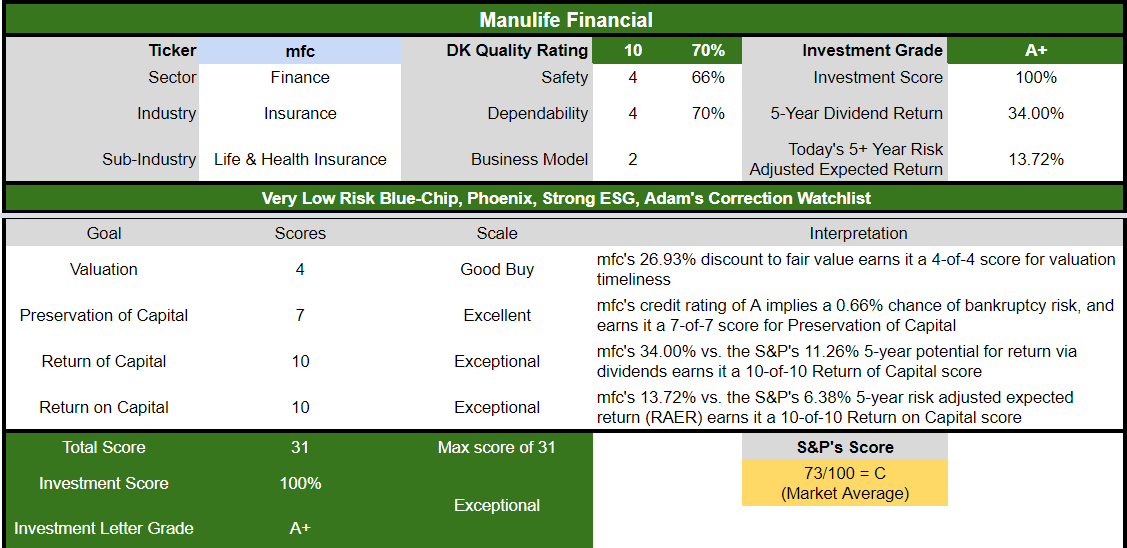
MFC is a potentially exceptional fast-growing high-yield anti-bubble blue-chip opportunity for anyone comfortable with its risk profile. Look at how it compares to the S&P 500.
- 27% discount to fair value vs. 1% premium S&P = 28% better valuation
- 5.5% safe yield vs. 1.7% (3X higher and safer)
- approximately 13.8% long-term annual return potential vs. 10.2% CAGR S&P
- about 2X higher risk-adjusted expected returns
- 3X higher income potential over five years
Bottom Line: Stanley & Manulife Are 2 Perfect High-Yield Blue-Chips For 2023
Let me be clear: I’m NOT calling the bottom in SWK and MFC (I’m not a market-timer).
Low-risk blue quality does NOT mean “can’t fall hard and fast in a bear market.”
Fundamentals are all that determine safety and quality, and my recommendations.
- over 30+ years, 97% of stock returns are a function of pure fundamentals, not luck
- in the short term, luck is 25X as powerful as fundamentals
- in the long term, fundamentals are 33X as powerful as luck
While I can’t predict the market in the short term, here’s what I can tell you about Stanley and Manulife.
These are two of the best high-yield blue-chip bargains on Wall Street. Their impeccable combination of high-yield, strong growth prospects, A-rated balance sheets, and very good to exceptional risk management make them as close to perfect high-yield blue-chip opportunities as exist on Wall Street.
Would you like to cash in on the 2022 bear market (which will likely extend into 2023)? Then consider buying some SWK and MFC today.
Does the potential for Buffett-like returns from deep-value blue-chip bargains hiding in plain sight entice you? Then SWK and MFC might be just what you’re looking for right now.
Does the idea of enjoying generous, safe, and steadily growing income in all economic conditions, with your savings managed by some of the best risk managers in the world, sound appealing?
All of these reasons, and more, are why SWK and MFC are two perfect high-yield bear market blue-chip bargains for 2023 and beyond.
Be the first to comment