

Chinnapong/iStock via Getty Images
Warren Buffett famously said to “be greedy when others are fearful” and many deep value investors have been eyeing Alibaba (BABA) through that lens since the regulatory crackdown began in November 2021.
YCharts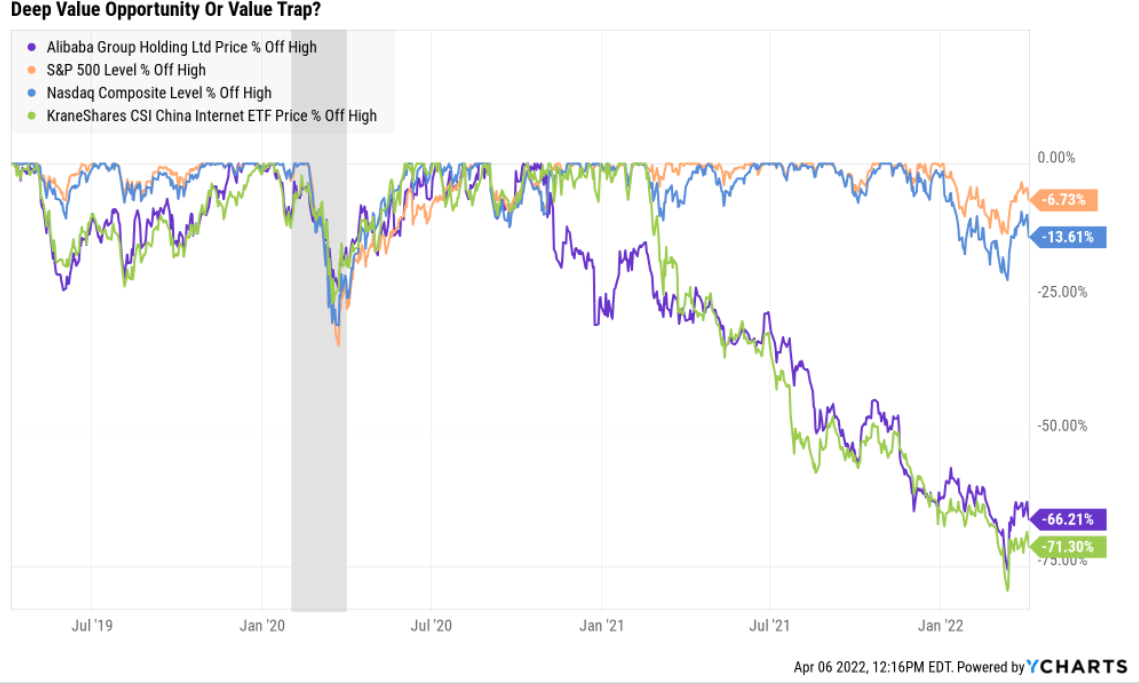
In fact, Charlie Munger, Buffett’s right hand at Berkshire (BRK.A)(BRK.B) and one of the greatest investors in history, has been aggressively tripling down on BABA in recent months.
Charlie Munger Just Doubled His Position In Alibaba
Daily Journal Portfolio (Run By Charlie Munger) (Whale Wisdom )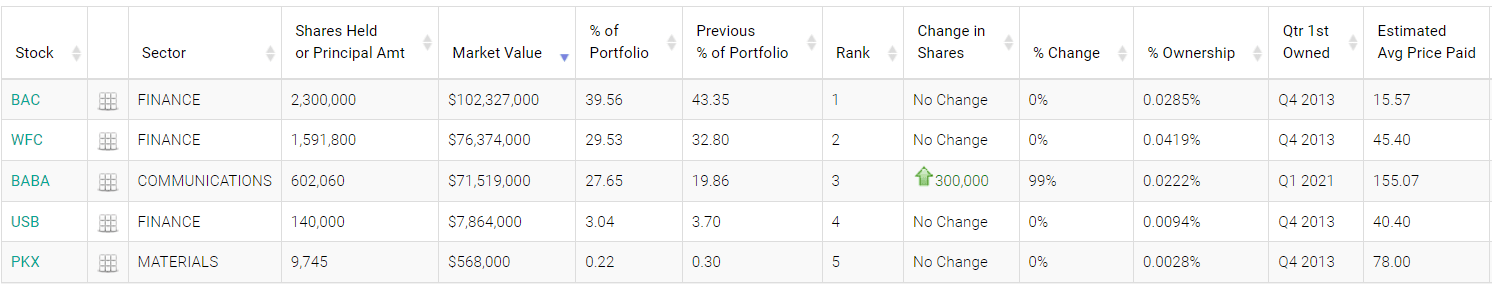
Mr. Munger recently doubled his position in BABA, making it 20% of the Daily Journal’s portfolio.
And with news that Beijing is close to cementing a deal to allow US regulators to audit 200 Chinese stocks trading on US exchanges, the risk of de-listing is significantly reduced.
Beijing also says it’s close to completing its regulatory crackdown, with final new regulations potentially coming within the next few months.
BABA 2028 Consensus Return Potential
(Source: FAST Graphs, FactSet Research)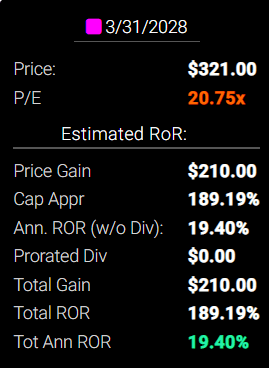
And with analysts estimating that BABA could potentially triple over the next six years, delivering Buffett-like returns of 19% annually, might it not be a good time to start buying BABA?
I own Alibaba and have no plans to sell it.
But I also believe there are several reasons why anyone looking to put new savings to work is far better off avoiding BABA and buying Polaris (NYSE:PII) and Lowe’s (NYSE:LOW) as far superior alternatives.
- Both PII and LOW could also triple over the next five years
- And deliver far superior long-term returns
- Potentially 134% higher returns from PII over the next 30 years
- Potentially 19x better returns from LOW over the next 30 years
3 Reasons To Potentially Avoid Alibaba Even At These Low Valuations
Let’s start out by examining my original thesis for buying and recommending Alibaba.
- A speculative blue-chip with a dominant industry position (wide moat)
- 26% long-term hyper-growth potential
- A growth runway that potentially ran for decades
Now let’s consider how Beijing’s crackdown has changed this thesis.
Reason One: BABA Is No Longer A Blue-Chip Quality Company
The Dividend King’s overall quality scores are based on a 243-point model that includes:
-
Dividend safety
-
Balance sheet strength
-
Credit ratings
-
Credit default swap medium-term bankruptcy risk data
-
Short and long-term bankruptcy risk
-
Accounting and corporate fraud risk
-
Profitability and business model
-
Growth consensus estimates
-
Management growth guidance
-
Historical earnings growth rates
-
Historical cash flow growth rates
-
Historical dividend growth rates
-
Historical sales growth rates
-
Cost of capital
-
Long-term risk-management scores from MSCI, Morningstar, FactSet, S&P, Reuters’/Refinitiv, and Just Capital
-
Management quality
-
Dividend friendly corporate culture/income dependability
-
Long-term total returns (a Ben Graham sign of quality)
-
Analyst consensus long-term return potential
In fact, it includes over 1,000 fundamental metrics including the 12 rating agencies we use to assess fundamental risk.
How do we know that our safety and quality model works well?
During the two worst recessions in 75 years, our safety model predicted 87% of blue-chip dividend cuts, the ultimate baptism by fire for any dividend safety model.
And then there’s the confirmation that our quality ratings are very accurate.
DK Zen Phoenix: Superior Fundamentals Lead To Superior Long-Term Results
| Metric | US Stocks | 187 Real Money DK Phoenix Recs |
| Great Recession Dividend Growth | -25% | 0% |
| Pandemic Dividend Growth | -1% | 6% |
| Positive Total Returns Over The Last 10 Years | 42% | 99.5% (Greatest Investors In History 60% to 80% Over Time) |
| Lost Money/Went Bankrupt Over The Last 10 Years | 47% | 0.5% |
| Outperformed Market Over The Last Decade (299%) | 36% | 51% |
| Bankruptcies Over The Last 10 Years | 11% | 0% |
| Permanent 70+% Catastrophic Decline Since 1980 | 44% | 0.5% |
| 100+% Total Return Over The Past 10 Years | NA | 88% |
| Sources: Morningstar, JPMorgan, Seeking Alpha |
Basically, historical market data confirms that the DK safety and quality model is one of the most comprehensive and accurate in the world.
This is why I entrust 100% of my life savings to this model and the DK Phoenix blue-chip strategy.
How does Alibaba score on one of the world’s most comprehensive and accurate safety models?
BABA Balance Sheet Safety
| Rating | Dividend Kings Safety Score (153 Point Safety Model) | Approximate Dividend Cut Risk (Average Recession) |
Approximate Dividend Cut Risk In Pandemic Level Recession |
| 1 – unsafe | 0% to 20% | over 4% | 16+% |
| 2- below average | 21% to 40% | over 2% | 8% to 16% |
| 3 – average | 41% to 60% | 2% | 4% to 8% |
| 4 – safe | 61% to 80% | 1% | 2% to 4% |
| 5- very safe | 81% to 100% | 0.5% | 1% to 2% |
| BABA | 81% | NA | NA |
| Risk Rating | High-Risk (36th industry percentile risk-management consensus) – speculative | A+ Stable outlook credit rating 0.6% 30-year bankruptcy risk |
2.5% OR LESS Max Risk Cap Recommendation – speculative |
Long-Term Dependability
| Company | DK Long-Term Dependability Score | Interpretation | Points |
| Non-Dependable Companies | 21% or below | Poor Dependability | 1 |
| Low Dependability Companies | 22% to 60% | Below-Average Dependability | 2 |
| S&P 500/Industry Average | 61% (58% to 70% range) | Average Dependability | 3 |
| Above-Average | 71% to 80% | Very Dependable | 4 |
| Very Good | 81% or higher | Exceptional Dependability | 5 |
| BABA | 60% | Below-Average Dependability | 2 |
Overall Quality
| BABA | Final Score | Rating |
| Safety | 81% | 5/5 very safe |
| Business Model | 90% | 2/3 narrow moat |
| Dependability | 60% | 2/5 below-average |
| Total | 74% | 9/13 Above-Average Speculative |
| Risk Rating | 1/3 High Risk | |
| 2.5% OR LESS Max Risk Cap Rec – speculative |
35% Margin of Safety For A Potentially Good Buy |
Alibaba is merely a speculative above-average quality company, with a high-risk profile that requires a 35% margin of safety to be considered a potentially good buy.
- BABA fair value: $177.56
- Discount to fair value: 40%
- DK Rating: “Hold” – Potential Fallen Angel whose thesis is on the verge of breaking
- If BABA’s growth consensus falls to single-digits, it won’t be a growth stock
- And there will be no reason to potentially buy it other than as a deep value play
Why am I not recommending BABA when it’s about 40% undervalued (Morningstar estimates 41% and analysts 36%)?
Reason Two: Alibaba’s Profitability Is Deteriorating Rapidly
News that regulators are almost down with the crackdown doesn’t mean that the regulations are going away.
- It likely just means that 2022 is the year the last of the regulations will be announced
- The regulations that are hurting profitability and growth are likely permanent
Speaking of profitability, let’s consider BABA’s.
GuruFocus Premium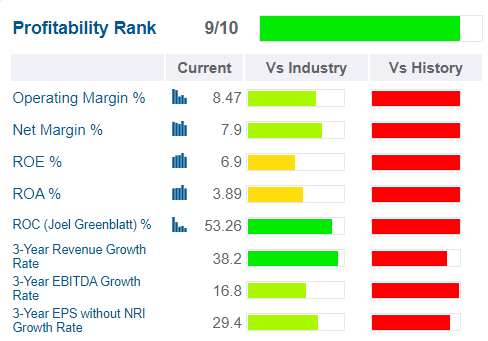
BABA has historically had profitability in the top 10% of its global peers, a wide moat money-minting juggernaut.
But now it’s facing soaring costs, both regulatory and pandemic related.
That’s on top of its accelerated growth investments which thus far have failed to result in accelerating growth.
- 2020 growth capex: $6.8 billion
- 2022 consensus growth capex: $10.0 billion
- 2025 consensus growth capex: $11.4 billion
- 2020 R&D spending: $8.2 billion
- 2025 R&D spending consensus: $12.7 billion
- 2020 total growth spending: $18.2 billion
- 2025 total growth spending: $24.1 billion
Alibaba’s Consensus Sales Growth Is Now 50% Pre-Pandemic Levels
FAST Graphs, FactSet
Despite a 32% increase in growth spending, 55 analysts now expect BABA’s sales growth rate to decline 50% relative to pre-pandemic levels.
What about the permanent increase in regulatory costs? What kind of effect on profitability is that expected to have?
FactSet Research Terminal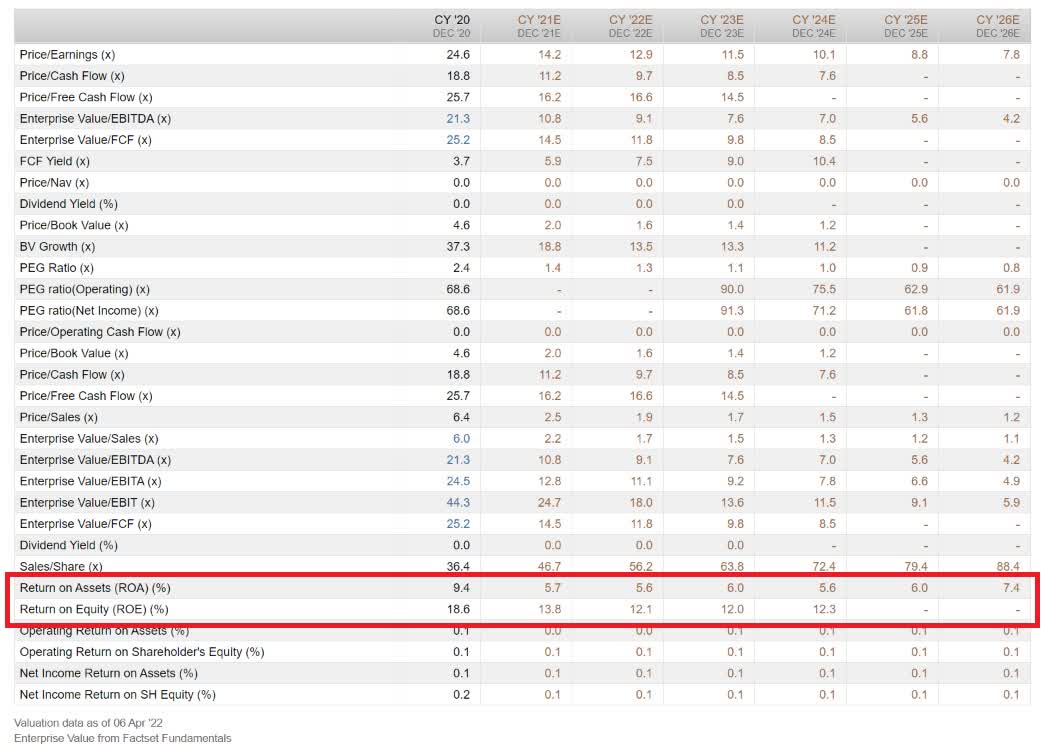
Compared to pre-crackdown 2020 profitability:
- Returns on equity are expected to be 34% lower in 2024
- Returns on assets are expected to be 21% lower even in 2026
This brings me to the most important part of BABA’s thesis, its hyper-growth prospects.
Reason Three: Alibaba’s Hyper-Growth Thesis Is Broken
FactSet Research Terminal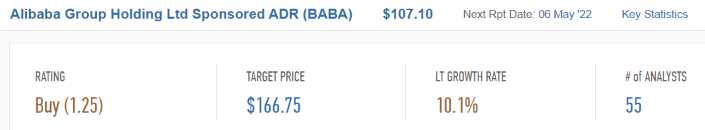
Where BABA was once expected to grow at 26% annually over the long term, it’s now expected to grow just 10.1% CAGR.
And BABA is hardly the only Chinese growth giant to see its growth outlook collapse.
The Death Of Chinese Growth Stocks
| Company | Ticker | Pre-Crackdown Growth Consensus | Current Growth Consensus | Decline In Growth Prospects |
Stock Price Decline (From Record Highs) |
| JD.com | (JD) | 45% | -6.5% | 114.44% | 45.85% |
| Alibaba | BABA | 26% | 10.1% | 61.15% | 66.20% |
| Pinduoduo | (PDD) | 23% | 1.8% | 92.17% | 78.20% |
| Tencent Holdings | (OTCPK:TCEHY) | 22% | 7.3% | 66.82% | 52.32% |
| Baidu | (BIDU) | 19% | -1.6% | 108.42% | 59.25% |
| Average | 27.0% | 2.2% | 88.6% | 60.4% |
(Source: DK Research Terminal, FactSet Research)
Thanks to Beijing’s crackdown, there are no more hyper-growth Chinese tech giants.
For context, the Nasdaq is expected to generate 14.3% CAGR long-term earnings growth, and the S&P 500 8.5%.
Pre-crackdown, Chinese tech giants were growing 2x faster than the Nasdaq and more than 3x faster than US companies.
Now? 2.2% is the average long-term growth consensus for China’s largest growth champions.
This is an incredible 89% decline in the growth outlook. It doesn’t mean that China’s hyper-growth thesis is dead, it means China’s entire large cap growth thesis is potentially dead, at least according to hundreds of analysts that cover these companies.
So are Chinese tech giants a deep value bargain? Given that share prices are down 60% while growth prospects are down almost 90%, I would urge caution.
But this brings me to why Polaris and Lowe’s are potentially no-brainer growth alternatives to Alibaba and pretty much all of China tech.
Why Polaris Is A Far Superior Growth Stock To Alibaba
Reasons To Potentially Buy Polaris
- 89% quality medium-risk 13/13 Ultra SWAN dividend champion
- Very safe 2.5% yield (92% safety score)
- 27-year dividend growth streak
- 42% conservatively undervalued (potential ultra value buy)
- Fair Value: $177.98 (16.9x earnings)
- 9.9x earnings vs 16.5 to 18 historical
- 7.1x cash-adjusted earnings = anti-bubble blue-chip
- Effective A+ stable outlook credit rating = 0.6% 30-year bankruptcy risk
- Risk management consensus 58th industry percentile = average, bordering on above-average
- 4% to 17% CAGR margin-of-error growth consensus range
- 10.7% CAGR median growth consensus
- management guidance: 10+%
- 5-year consensus total return potential: 16% to 26% CAGR
- Base-case 5-year consensus return potential: 21% CAGR (6x market consensus)
- Consensus 12-month total return forecast: 39% (12.2 P/E, very reasonable)
- Fundamentally Justified 12-Month Returns: 74% CAGR
I want to point out something remarkable that should get deep value investors very excited.
Polaris Is More Undervalued Than Alibaba
| Company | Forward PE | EV/EBITDA (Cash-Adjusted PE) |
Discount To Fair Value |
| Alibaba | 12.9 | 9.1 | 40% |
| Polaris | 10.0 | 7.0 | 42% |
(Source: DK Research Terminal, FactSet Research)
Whether you look at forward earnings or cash-adjusted earnings, Polaris is a screaming bargain.
In fact, 7x EV/EBITDA is literally the average Shark Tank deal multiple in the first 10 seasons.
- Pre-pandemic private equity deals were closing at 12.3x EV/EBITDA
- 13 to 14x in the last two years
Polaris is literally trading at a 50% discount to recent private equity deals!
This isn’t just a potentially good buy, it’s not a potentially very strong buy, Polaris today represents a table-pounding, anti-bubble, Buffett-style ultra value “fat pitch”.
Wait for a fat pitch and then swing for the fences.” – Warren Buffett
Why is Polaris such a no-brainer superior alternative to BABA?
- Objectively superior valuation
- Far higher quality
- Effective A+ credit rating is as strong as BABA’s
- A 27-year dividend growth streak (BABA doesn’t even pay a dividend)
- Far superior risk-management according to five rating agencies
- BETTER LONG-TERM GROWTH POTENTIAL
Why Polaris’s Balance Sheet Is As Strong As BABA’s (Maybe More)
(Source: GuruFocus Premium)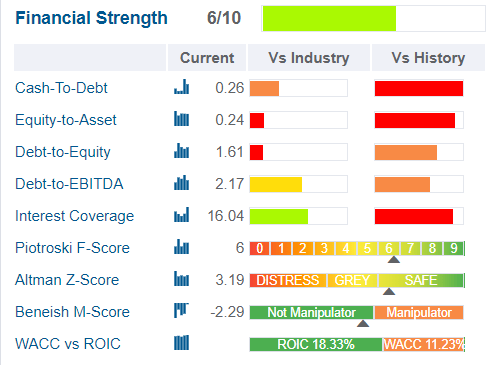
PII doesn’t pay for a credit rating but I’m highly confident that if it did, it would be rated A+ and here’s why.
- Current and historical debt metrics and ratios consistent with A or even AA-rated companies
- Advanced accounting metrics (F, Z, and M-scores) consistent with A or even AA-rated companies
- Solvency ratios consistent with A or even AA-rated companies
- 2.45% average borrowing cost consistent with A or even AA-rated companies
In other words, the bond market, which knows the rating agency guidelines for every industry, is treating Polaris as an A+ rated company.
- Approximately 30-year bankruptcy risk 0.6%
- The approximate risk of losing all your money buying PII today is 1 in 167
PII’s Leverage Consensus Forecast
| Year | Debt/EBITDA | Net Debt/EBITDA (3.0 Or Less Safe According To Credit Rating Agencies) |
Interest Coverage (8+ Safe) |
| 2020 | 1.51 | 0.94 | 3.16 |
| 2021 | 1.38 | 1.43 | 16.16 |
| 2022 | 1.46 | 0.90 | 16.15 |
| 2023 | 1.10 | 0.57 | 16.28 |
| Annualized Change | -10.00% | -15.38% | 72.64% |
(Source: FactSet Research Terminal)
PII’s balance sheet is a fortress and is expected to get steadily safer over time.
| Credit Rating | Safe Net Debt/EBITDA For Most Companies | 30-Year Default/Bankruptcy Risk |
| BBB | 3.0 or less | 7.50% |
| A- | 2.5 or less | 2.50% |
| A | 2.0 or less | 0.66% |
| A+ | 1.8 or less | 0.60% |
| AA | 1.5 or less | 0.51% |
| AAA | 1.1 or less | 0.07% |
(Sources: S&P, Fitch, Moody’s)
Even with a cyclical business model, I’m confident this is an A+ rated company.
- And the bond market agrees
PII’s Long-Term Growth Outlook: Better Than BABA’s
(Source: FactSet Research Terminal)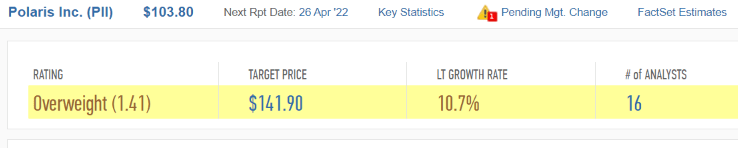
- 5.4% to 15.0% CAGR growth consensus range (from five sources)
- Median growth consensus: 10.7% CAGR
- Management guidance: 10+%
If BABA is all about growth, then PII is objectively the better growth stock, even ignoring its far superior quality, safety, dependability, and risk management.
- Not to mention far less regulatory risk than BABA will always face
Want to see what PII’s combination of Ultra SWAN dividend aristocrat quality and ultra value discount could mean for investors?
Superior Medium-Term Total Return Potential: With Far Less Risk
Polaris offers Buffett-like returns from an anti-bubble blue-chip bargain hiding in plain sight.
PII 2024 Consensus Total Return Potential
(Source: FAST Graphs, FactSet)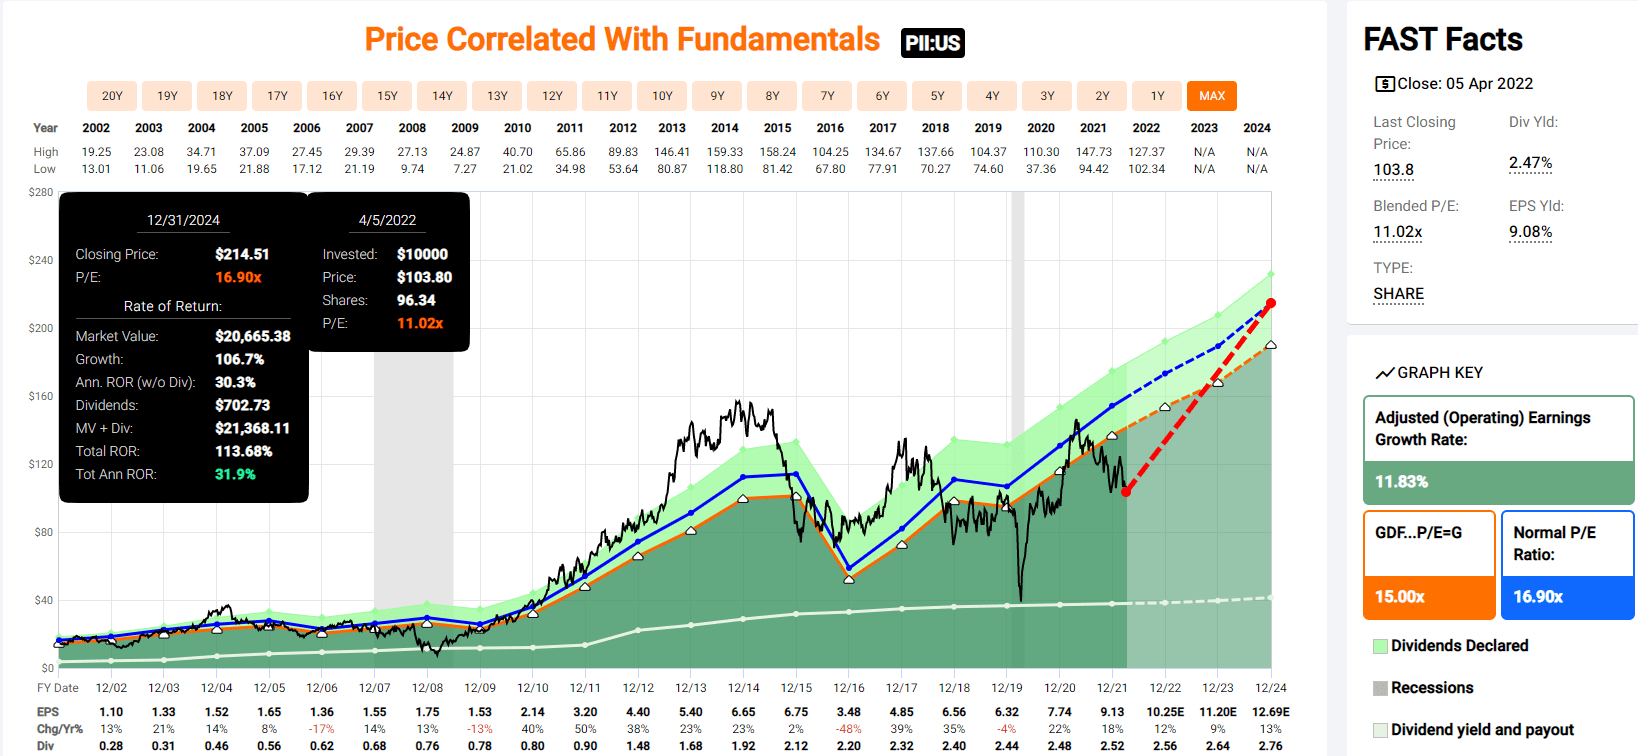
If PII grows as analysts expect by 2024, it could deliver 114% total returns, or 32% annually.
PII 2027 Consensus Total Return Potential
FAST Graphs, FactSet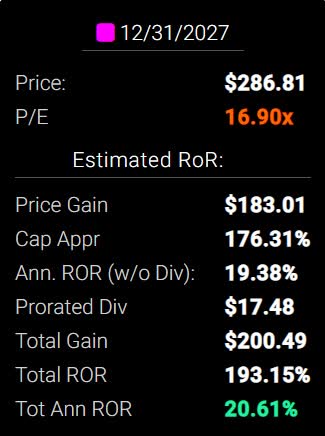
By 2027, if PII grows as expected and returns to historical fair value, it could triple and deliver 21% annual total returns.
- Also Buffett-like returns
- 6x the S&P 500 consensus
Analysts think BABA could deliver 19% annual returns over the coming five years.
They think PII could deliver 21% annual returns over the next five years.
And this is just the medium-term return potential.
Polaris Is Expected To Generate Far Better Long-Term Total Returns Than BABA Over Time
Here is PII and BABA’s inflation-adjusted consensus return potential.
Inflation-Adjusted Consensus Return Potential: $1,000 Initial Investment
| Time Frame (Years) | 7.7% CAGR Inflation-Adjusted S&P Consensus | 7.92% Inflation-Adjusted BABA Consensus | 11.0% CAGR Inflation-Adjusted PII Consensus | Difference Between Inflation Adjusted PII Consensus And BABA |
| 5 | $1,449.03 | $1,463.89 | $1,686.58 | $222.68 |
| 10 | $2,099.70 | $2,142.99 | $2,844.54 | $701.56 |
| 15 | $3,042.53 | $3,137.10 | $4,797.54 | $1,660.43 |
| 20 | $4,408.74 | $4,592.39 | $8,091.41 | $3,499.03 |
| 25 | $6,388.41 | $6,722.77 | $13,646.79 | $6,924.02 |
| 30 | $9,257.02 | $9,841.43 | $23,016.36 | $13,174.93 |
(Source: DK Research Terminal, FactSet Research)
PII, courtesy of its very safe 2.5% yielding dividend, which has been raised every year for 27 consecutive years, could deliver 3.1% better long-term total returns than BABA.
| Time Frame (Years) | Ratio Inflation-Adjusted PII Consensus Vs. BABA Consensus |
| 5 | 1.15 |
| 10 | 1.33 |
| 15 | 1.53 |
| 20 | 1.76 |
| 25 | 2.03 |
| 30 | 2.34 |
(Source: DK Research Terminal, FactSet Research)
This potentially means 134% higher inflation-adjusted returns over 30 years.
Why Lowe’s Is A Much Better Investment Than Alibaba
Reasons To Potentially Buy Lowe’s
- 100% quality low-risk 13/13 Ultra SWAN Dividend King
- Very safe 1.6% yield (100% safety score)
- 59-year dividend growth streak
- 26% conservatively undervalued (potential very strong buy)
- Fair Value: $274.75 (20x earnings)
- 14.7x earnings vs. 19 to 21 historical
- BBB+ stable outlook credit rating = 5% 30-year bankruptcy risk
- Risk management consensus 87th industry percentile = Very Good, bordering on exceptional
- 13% to 24% CAGR margin-of-error growth consensus range
- 19.6% CAGR median growth consensus
- 5-year consensus total return potential: 20% to 24% CAGR
- Base-case 5-year consensus return potential: 22% CAGR (6.5x market consensus)
- Consensus 12-month total return forecast: 39% (18.2 P/E, very reasonable)
- Fundamentally Justified 12-Month Returns: 37% CAGR
Lowe’s isn’t just a great dividend stock, it’s potentially the greatest dividend stock in the world.
LOW Dividend Safety
| Rating | Dividend Kings Safety Score (151 Point Safety Model) | Approximate Dividend Cut Risk (Average Recession) |
Approximate Dividend Cut Risk In Pandemic Level Recession |
| 1 – unsafe | 0% to 20% | over 4% | 16+% |
| 2- below average | 21% to 40% | over 2% | 8% to 16% |
| 3 – average | 41% to 60% | 2% | 4% to 8% |
| 4 – safe | 61% to 80% | 1% | 2% to 4% |
| 5- very safe | 81% to 100% | 0.5% | 1% to 2% |
| LOW | 100% | 0.5% | 1.0% |
| Risk Rating | Low Risk (87th industry percentile risk-management consensus) | BBB+ stable outlook credit rating 5% 30-year bankruptcy risk | 20% OR LESS Max Risk Cap Recommendation |
Long-Term Dependability
| Company | DK Long-Term Dependability Score | Interpretation | Points |
| Non-Dependable Companies | 21% or below | Poor Dependability | 1 |
| Low Dependability Companies | 22% to 60% | Below-Average Dependability | 2 |
| S&P 500/Industry Average | 61% (58% to 70% range) | Average Dependability | 3 |
| Above-Average | 71% to 80% | Very Dependable | 4 |
| Very Good | 81% or higher | Exceptional Dependability | 5 |
| LOW | 100% | Exceptional Dependability | 5 |
Overall Quality
| LOW | Final Score | Rating |
| Safety | 100% | 5/5 very safe |
| Business Model | 100% | 3/3 wide moat |
| Dependability | 100% | 5/5 exceptional |
| Total | 100% | 13/13 Ultra SWAN dividend king |
| Risk Rating | 3/3 Low Risk | |
| 20% OR LESS Max Risk Cap Rec |
5% Margin of Safety For A Potentially Good Buy |
LOW: #1 Highest Quality Master List Company (Out of 508) = 100th Percentile
The DK 500 Master List includes the world’s highest quality companies including:
-
All dividend champions
-
All dividend aristocrats
-
All dividend kings
-
All 13/13 Ultra SWANs (as close to perfect quality as exists on Wall Street)
- 48 of the world’s best growth stocks
LOW’s 100% quality score means its similar in quality to such blue-chips as
- Mastercard (MA)
- Microsoft (MSFT)
- Colgate-Palmolive (CL) – dividend king
- Adobe (ADBE)
- Visa (V)
- V.F. Corp (VFC) – dividend king
- S&P Global (SPGI) – dividend king
- Novartis (NVS) – global aristocrat
- Nike (NKE)
- Allianz SE (OTCPK:ALIZY)
Basically,
- From the perspective of dividend growth investors, Lowe’s is arguably the highest quality company on earth
- A leader among the world’s premier blue-chips by all other standards
And while BABA’s profitability is floundering and expected to decline for several years, potentially permanently, Lowe’s profit outlook has never looked better.
Profitability: Wall Street’s Favorite Quality Proxy
(Source: GuruFocus Premium)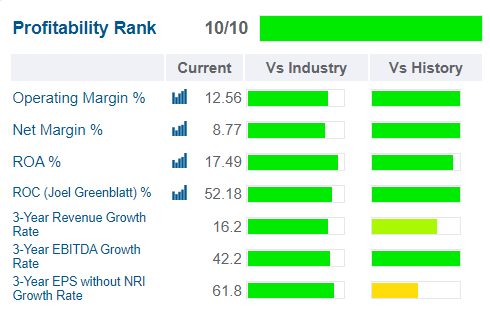
Historically LOW’s profitability is right at the top of its industry peer group.
- Up from 8/10 profitability last quarter
LOW Trailing 12-Month Profitability Vs. Peers
| Metric | Industry Percentile | Major Cyclical Retailers More Profitable Than LOW (Out Of 1,098) |
| Operating Margin | 83.65 | 180 |
| Net Margin | 80.00 | 220 |
| Return On Equity | 93.90 | 67 |
| Return On Assets | NA | NA |
| Return On Capital | 87.43 | 138 |
| Average | 86.25 | 151 |
(Source: GuruFocus Premium)
LOW’s margins have been soaring in recent years.
(Source: investor 2022 update)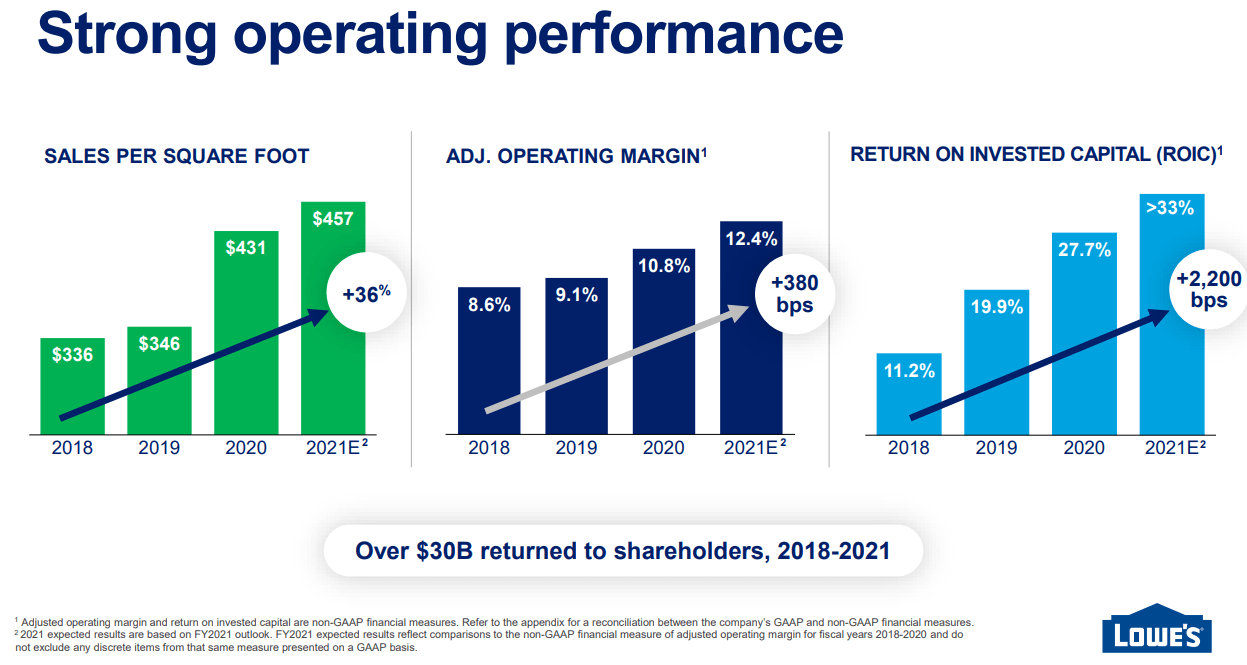
And those industry-leading margins are expected to keep improving over time.
LOW Profit Margin Consensus Forecast
| Year | FCF Margin | EBITDA Margin | EBIT (Operating) Margin | Net Margin | Return On Capital Expansion |
Return On Capital Forecast |
| 2020 | 9.9% | 12.4% | 10.7% | 7.3% | 1.18 | |
| 2021 | 8.7% | 14.3% | 12.4% | 8.6% | TTM ROC | 52.18% |
| 2022 | 9.1% | 14.7% | 12.8% | 8.8% | Latest ROC | 31.49% |
| 2023 | 9.3% | 14.9% | 13.0% | 8.9% | 2027 ROC | 61.76% |
| 2024 | 9.8% | 15.4% | 13.3% | 9.2% | 2027 ROC | 37.27% |
| 2025 | 10.7% | 15.9% | 14.1% | 9.8% | Average | 49.51% |
| 2026 | 11.2% | 16.4% | 14.7% | 10.2% | Industry Median | 11.59% |
| 2027 | NA | NA | NA | NA | LOW/Industry Median | 4.27 |
| Annualized Growth | 2.17% | 4.65% | 5.49% | 5.63% | Vs S&P | 3.39 |
| Annualized Growth (Ignoring Pandemic) | 5.22% | 2.77% | 3.43% | 3.45% |
(Source: FactSet Research Terminal)
And while Lowe’s might not be as cheap as BABA, it’s well worth the small premium.
How Lowe’s Compares To BABA’s Valuation
- LOW fair value: $275.32
- Discount: 28%
- DK rating: potentially very strong buy
| Company | Forward PE | EV/EBITDA (Cash-Adjusted P/E) |
Discount To Fair Value |
| Alibaba | 12.9 | 9.1 | 40% |
| Lowe’s | 14.8 | 11.5 | 28% |
(Source: DK Research Terminal, FactSet Research)
Today, Lowe’s trades at a small premium to BABA, but in terms of cash-adjusted earnings, still private equity valuations.
That slightly richer, and much-deserved premium is more than made up by LOW’s far superior growth potential.
LOW Long-Term Growth Outlook
(Source: FactSet Research Terminal)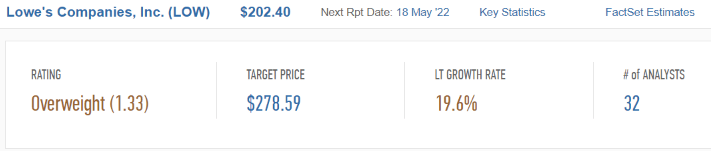
- 14.5% to 22.3% CAGR growth consensus range (from five sources)
- Individual analyst LT growth range: 7% to 34% CAGR (1.9% to 30% for BABA)
- Median growth consensus from all 32 analysts: 19.6% CAGR
Take one look at this and tell me BABA is a better growth stock, I dare you.
What does growth potential 2x that of BABA mean for return potential?
LOW’s Consensus Return Potential Is Superior To BABA’s
Powered by what Morgan Stanley thinks will be a 10- to 20-year secular mega-trend in housing, analysts expect Lowe’s to deliver Buffett-like returns, equal or better than BABA’s.
LOW 2025 Consensus Total Return Potential
(Source: FAST Graphs, FactSet)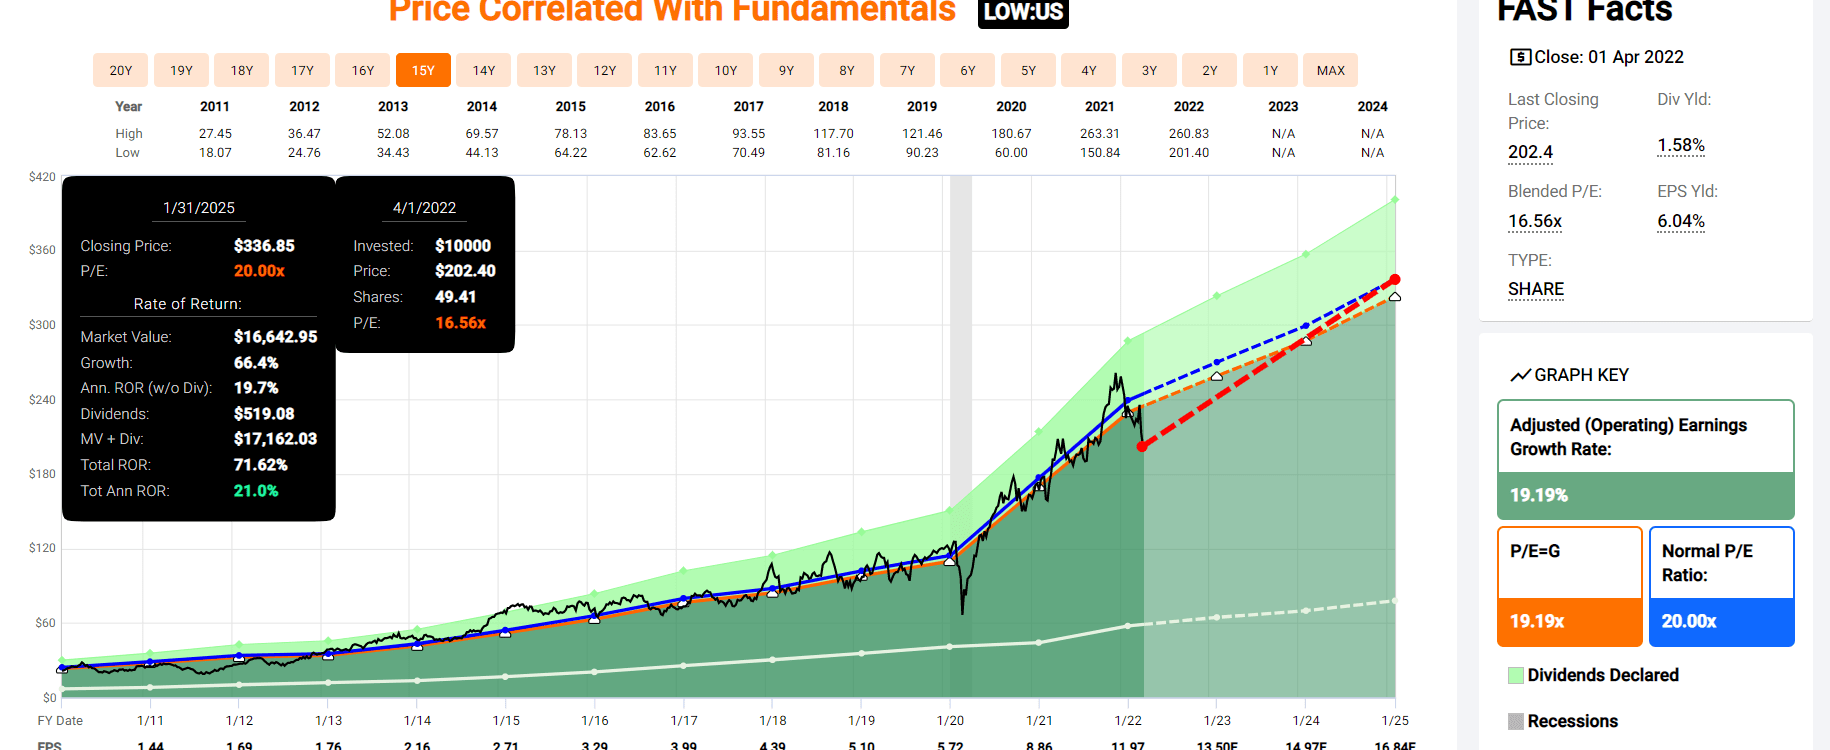
Over the next few years, analysts think LOW could deliver Buffett-like 21% annual returns.
LOW 2028 Consensus Total Return Potential
(Source: FAST Graphs, FactSet)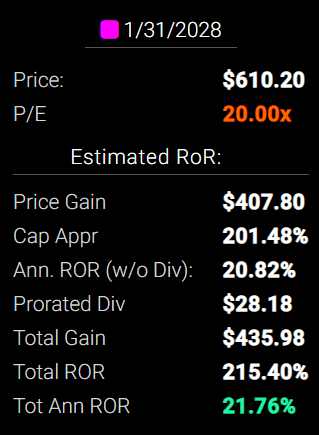
Through January 2028, analysts think Lowe’s could deliver 22% annual returns, more than tripling your money.
- Approximately 6.5x the S&P 500’s consensus return potential
This is 3% better annual return potential than BABA and from arguably the highest-quality dividend stock on earth.
BABA Could Make You Money But Lowe’s Could Make You Rich
Inflation-Adjusted Consensus Return Potential: $1,000 Initial Investment
| Time Frame (Years) | 7.7% CAGR Inflation-Adjusted S&P Consensus | 7.9% Inflation-Adjusted BABA Consensus | 19.0% CAGR Inflation-Adjusted LOW Consensus | Difference Between Inflation Adjusted LOW Consensus And BABA |
| 5 | $1,449.03 | $1,463.89 | $2,388.36 | $924.47 |
| 10 | $2,099.70 | $2,142.99 | $5,704.26 | $3,561.28 |
| 15 | $3,042.53 | $3,137.10 | $13,623.83 | $10,486.72 |
| 20 | $4,408.74 | $4,592.39 | $32,538.60 | $27,946.21 |
| 25 | $6,388.41 | $6,722.77 | $77,713.89 | $70,991.12 |
| 30 | $9,257.02 | $9,841.43 | $185,608.72 | $175,767.29 |
(Source: DK Research Terminal, FactSet Research)
Lowe’s could turn a small investment today into a life-changing fortune in the years and decades to come.
| Time Frame (Years) | Ratio Inflation-Adjusted LOW Consensus Vs. BABA Consensus |
| 5 | 1.63 |
| 10 | 2.66 |
| 15 | 4.34 |
| 20 | 7.09 |
| 25 | 11.56 |
| 30 | 18.86 |
(Source: DK Research Terminal, FactSet Research)
And potentially deliver 19x better returns than BABA.
Think these kinds of returns from Lowe’s are impossible?
LOW Rolling Returns Since 1986
(Source: Portfolio Visualizer Premium)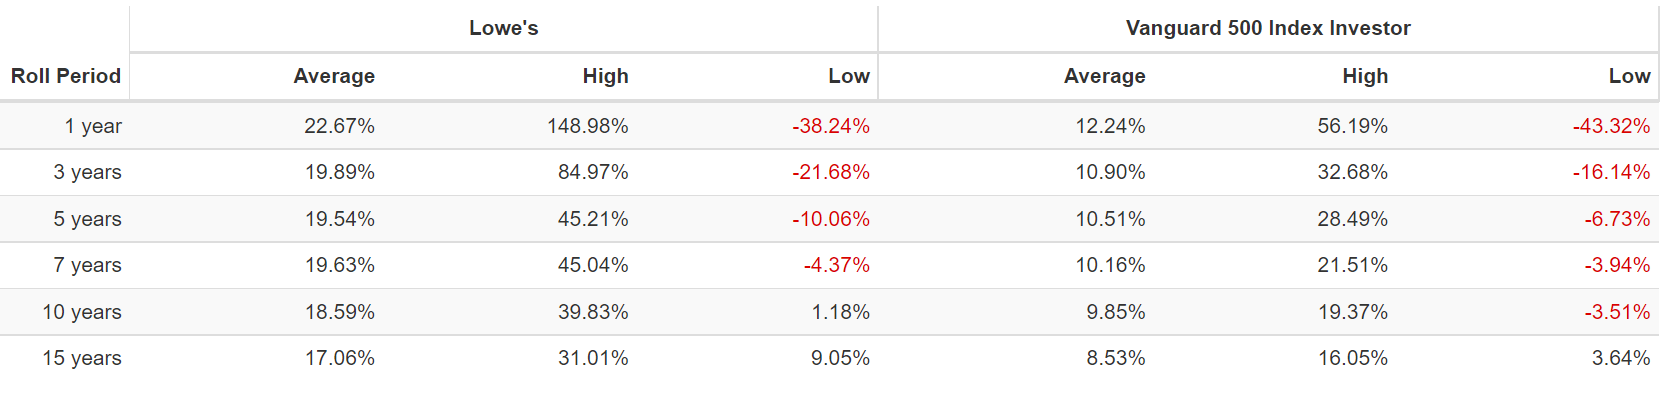
Lowe’s has historically delivered 17% to 19% annual returns but from bear market lows as much as 31% annually for the next 15 years.
- As much as 57.5x returns in 15 years
BABA Vs. Lowe’s Since January 2015
(Source: Portfolio Visualizer Premium)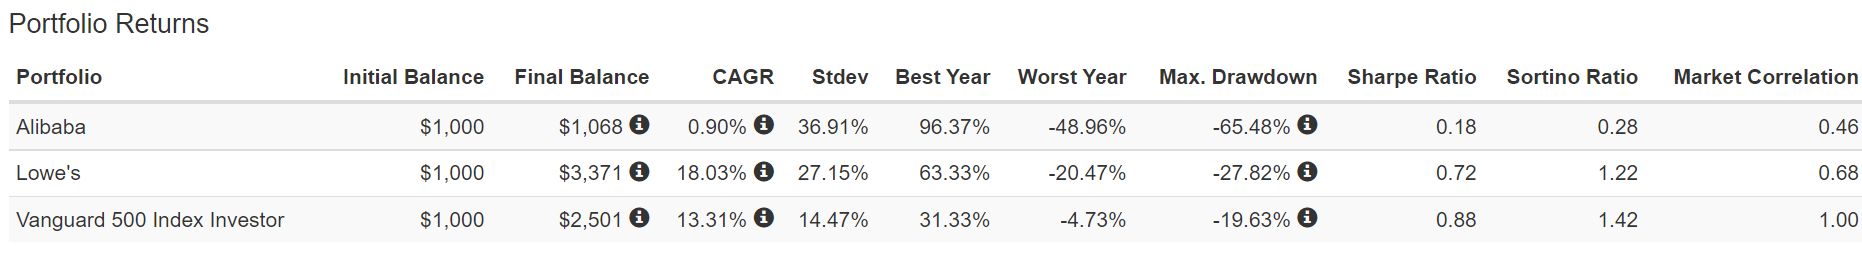
Lowe’s has kept on delivering its historical 18% returns during the last six years, while Alibaba has delivered nothing but volatility and negative inflation-adjusted returns.
(Source: Portfolio Visualizer Premium)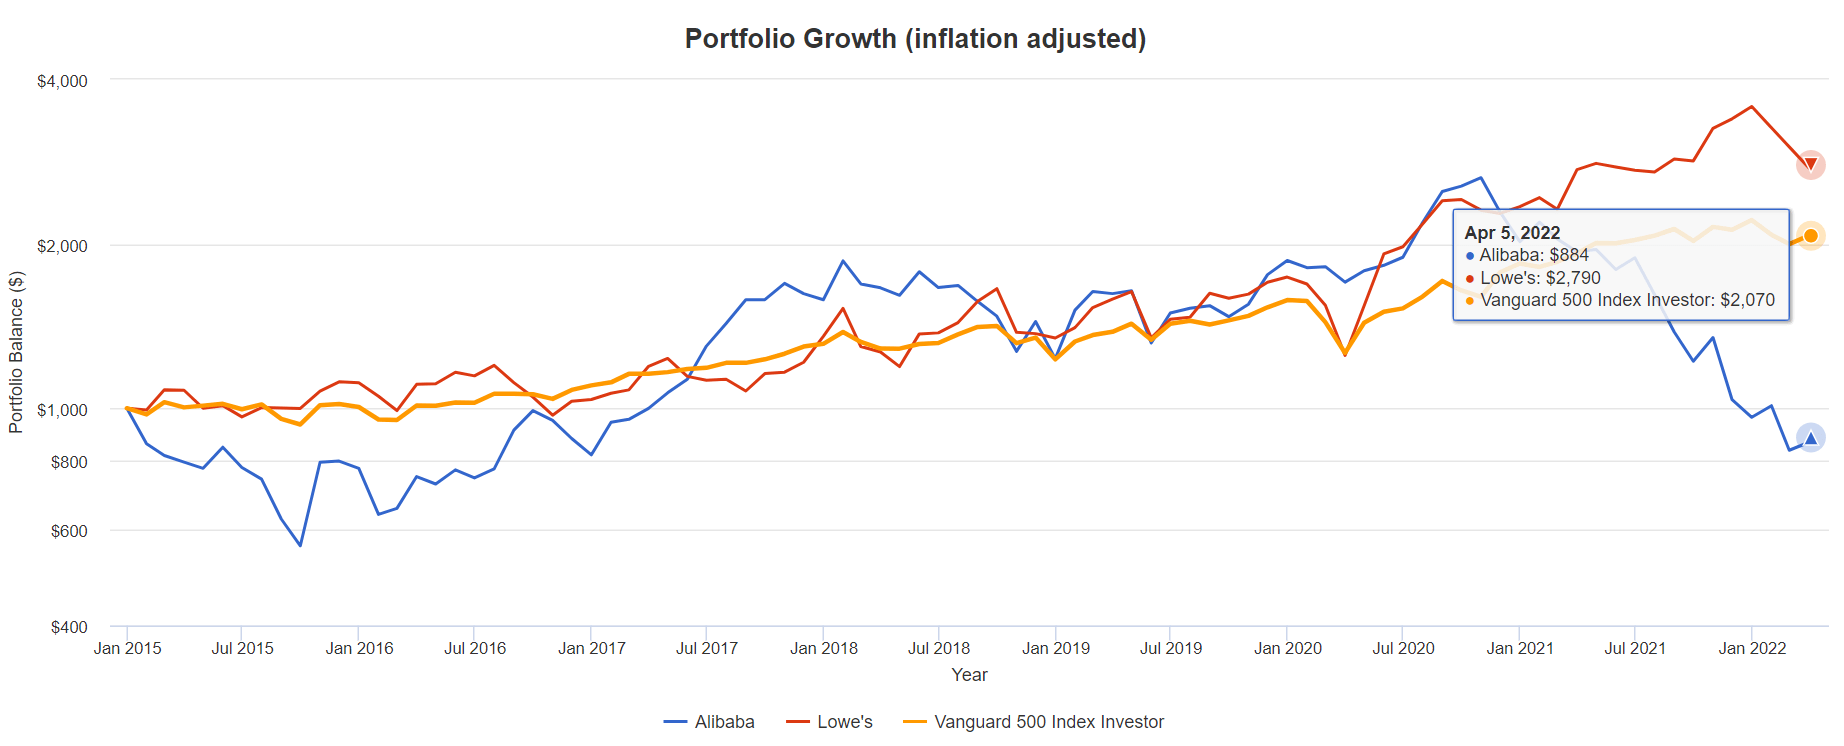
Anyone buying BABA at its IPO is down 12% adjusted for inflation, despite BABA growing like a weed for six years.
- And now its growth outlook has been cut in half, largely justifying the collapse in share price
Bottom Line: Polaris And Lowe’s Are Far Superior Alternatives To Alibaba
When the facts change, I change my mind. What do you do sir?” – John Maynard Keynes
There are no sacred cows at iREIT or Dividend Kings. Wherever the fundamentals lead, we always follow. That’s the essence of disciplined financial science, the math retiring rich and staying rich in retirement.
I once recommended BABA as a speculative 2.5% OR LESS max position within a diversified and prudent risk-management portfolio.
Today, I no longer recommend BABA because the facts have changed, and only a fool refuses to admit the obvious.
Buying quality companies when the market hates them most is a time-tested approach to generating life-changing wealth.
The intelligent investor is a realist who sells to optimists and buys from pessimists.” – Ben Graham
But as Mr. Graham points out, the intelligent investor needs to be a realist.
This Is The Reality Of Chinese Tech Stocks
| Company | Ticker | Pre-Crackdown Growth Consensus | Current Growth Consensus | Decline In Growth Prospects |
Stock Price Decline (From Record Highs) |
| JD.com | JD | 45% | -6.5% | 114.44% | 45.85% |
| Alibaba | BABA | 26% | 10.1% | 61.15% | 66.20% |
| Pinduoduo | PDD | 23% | 1.80% | 92.17% | 78.20% |
| Tencent Holdings | TCEHY | 22% | 7.30% | 66.82% | 52.32% |
| Baidu | BIDU | 19% | -1.60% | 108.42% | 59.25% |
| Average | 27.0% | 2.2% | 88.6% | 60.4% |
(Source: DK Research Terminal, FactSet Research)
And here’s another rather grim fact for potential Chinese investors to consider.
Market Watch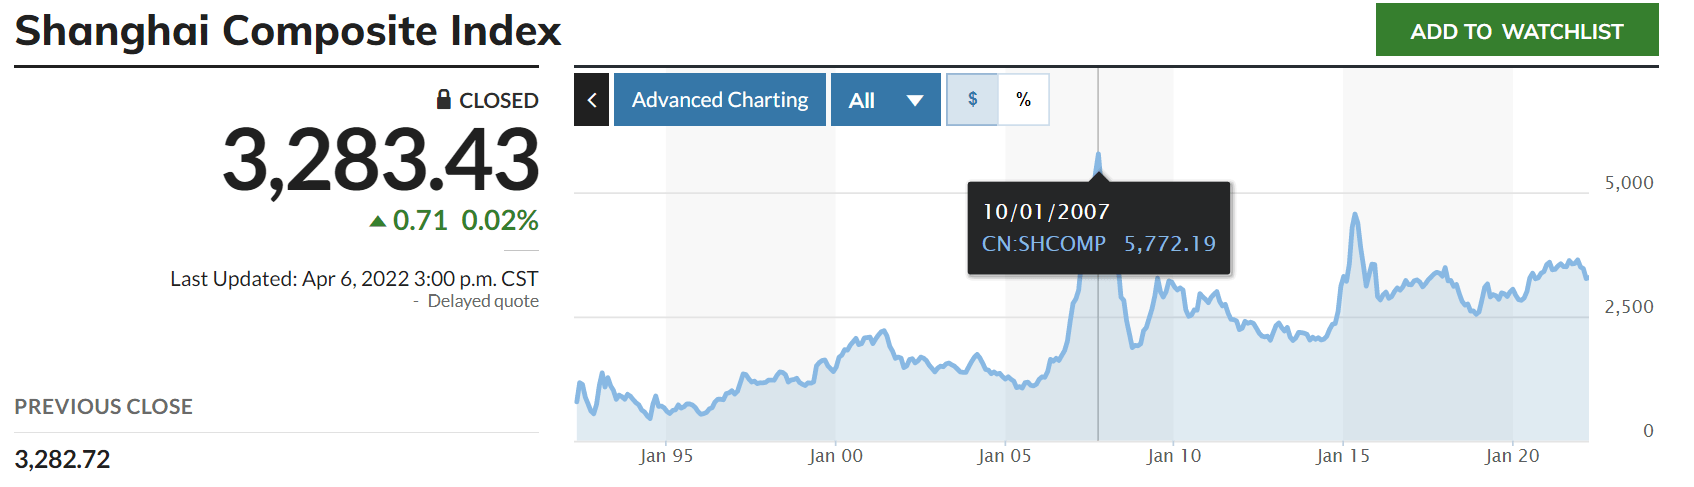
China’s stock market peaked in October of 2007, just like the US stock market did before the Great Recession.
Chinese stocks are still down 25% from their highs.
- -4% annually for nearly 15 years
YCharts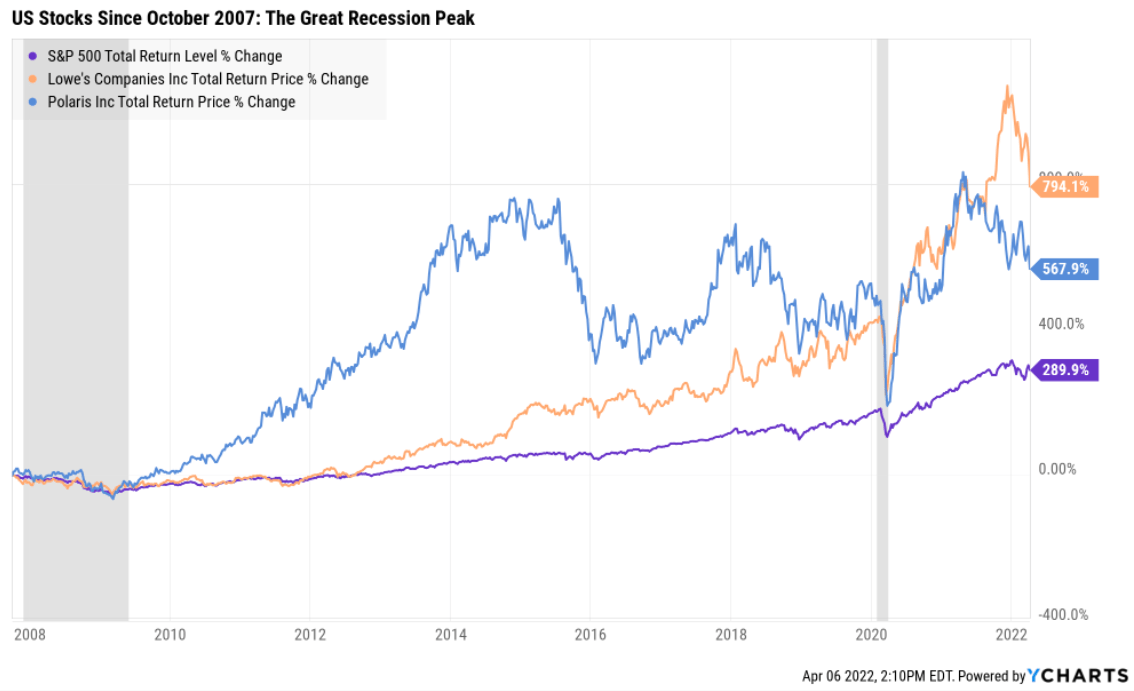
- The S&P 500 has nearly quadrupled off its 2007 peak.
- Polaris is up almost 7x.
- And Lowe’s is up almost 9x.
My point is that China’s investment thesis isn’t as clear-cut as you might think.
- Their government objectively doesn’t care if Chinese investors make money
- As proven by a 15-year bear market that shows no signs of ending soon
- So imagine how little they care about foreign investors in Chinese stocks
Ultimately, anyone considering investing in Alibaba today needs to ask themselves a few questions.
Would you like to take on a significant amount of regulatory risk owning BABA (or any Chinese company) in an attempt to make 10% long-term returns?
Or would you rather get paid very safe and steadily growing dividends and potentially make far more money owning Polaris and Lowe’s?
Would you like to potentially triple your money over the next five years with a lot of risk or far less risk?
Would you rather entrust your hard-earned savings to proven wealth compounders like Polaris and Lowe’s?
Or a company that has generated negative inflation-adjusted returns for over six years due entirely to a negative regulatory environment that is likely to never go away?
Would you like to perhaps make a lot of money with Alibaba? Or potentially retire in safety and splendor with the power of Ultra SWAN quality dividend aristocrats and kings?
Luck is what happens when preparation meets opportunity.” – Roman Philosopher Seneca the younger
Anyone who buys BABA in the hopes of a return to hyper-growth is counting on luck to get rich.
Anyone buying LOW and PII today is making their own luck and is far more likely to retire rich, and stay rich in retirement.
Be the first to comment