

Kameleon007
With the market moving higher over the last couple of weeks I’ve identified two stocks that offer an attractive dividend yield along with positive price action and momentum. The stocks that I have purchased are VZ and BXP. In this article I will outline their dividend grades as seen by Seeking Alpha, my buying thesis, and how I plan my two trades.
Verizon Communications, Inc. (VZ) is a well-known stock to Seeking Alpha readers. VZ has a forward yield of 6.24%. Seeking Alpha gives VZ a C+ grade for dividend safety, a B+ grade for growth, an A- grade for yield, and an A grade for consistency. I am comfortable with this dividend yield and VZ has a place in my dividend income portfolio.
Chart 1 – VZ Weekly Price with MACD
www.stockcharts.com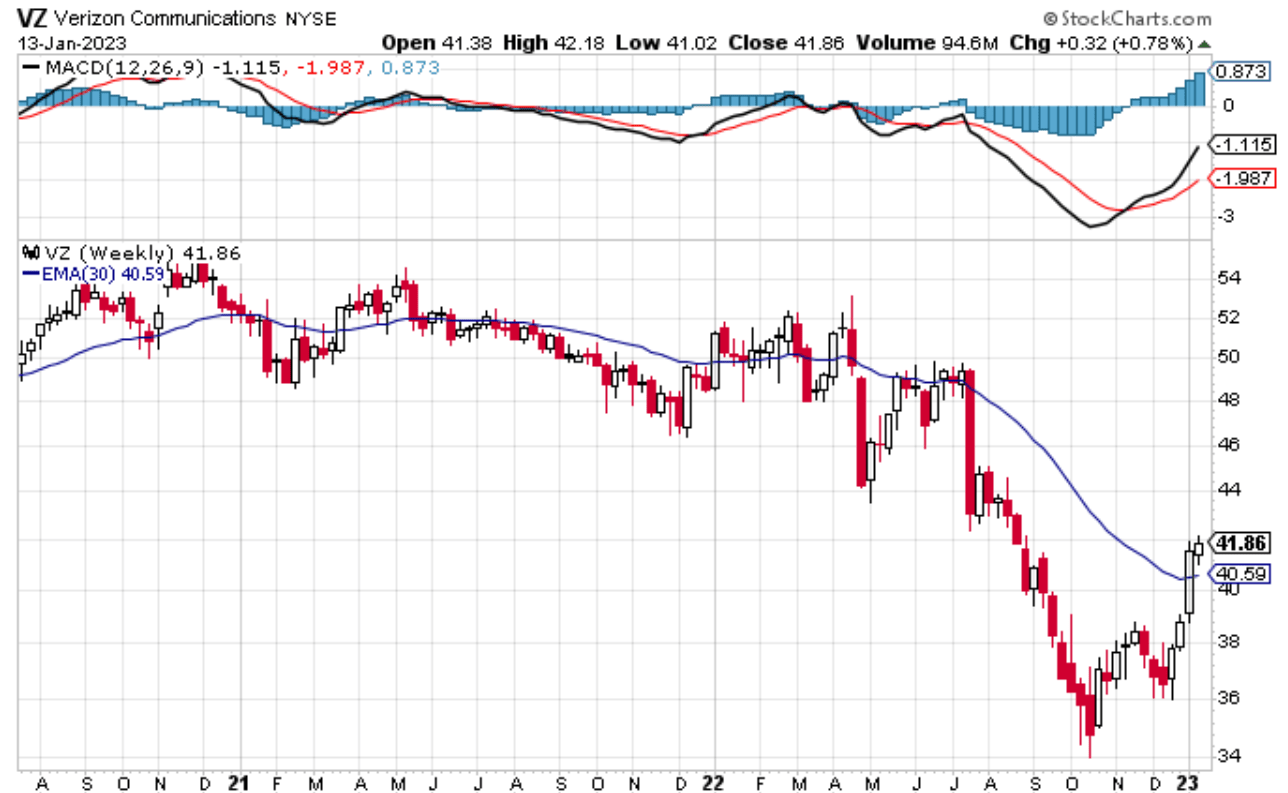
My investment thesis for VZ is based on three developments. The first development is a trend reversal. Chart 1 shows that VZ made a high of around $55 in November 2020. Since then, VZ has moved lower. In April 2022, VZ reached a high of $53 and then it reversed. Since April, VZ has made a series of lower lows and lower highs. That is the definition of a downtrend. What I see as bullish is the trend reversal that has taken place since October 2022. VZ got to a low of $34 in October, then moved higher to above $38 in November. VZ put in a higher low in December before closing above the November highs, therefore putting in a higher low and a higher high. That is the anatomy of a bullish trend change.
The second development is the close above the 30-week moving average which is in blue. You’ll notice that the blue moving average is now starting to turn and head higher. This is a bullish confirmation of the higher high and higher low trend change. I like the idea of owning a stock that is above its upward sloping 30 week moving average. That shows a stock that is in a bullish uptrend.
The third development that makes me a buyer is the Moving Average Convergence Divergence (MACD) bullish crossover. The MACD is used by traders to determine momentum. MACD is a combination of two moving averages that make up the red MACD line, and a moving average of the difference between the two moving averages of the red MACD line. This is the black signal line. There is no need to get caught up in the math of the MACD indicator. Using the MACD indicator for identifying momentum is easy. When the black signal line is above the red MACD line that is considered a bullish development. It shows positive or bullish momentum. I want to own stocks when the black signal line is above the red MACD line. Buying a stock that has bullish momentum is a plus. You can see that VZ had a bullish MACD crossover in November and the momentum higher has continued.
VZ is now trending higher making a series of higher highs and higher lows. It is above its 30-week moving average and the moving average is now starting to trend higher. The MACD for VZ is showing strong bullish momentum. All three of these factors are why I started a position in VZ.
What could go wrong with this trade? The biggest concern I have for this position is the trend reversing. A close below the 30-week moving average would be a concern. A close below the higher lows set in December would cause me to exit the position. Roughly I have a $5 risk per share with upside to perhaps $50- $55. That is a risk to reward ratio of 1:2.
Boston Properties, Inc. (BXP) is another well-known stock to Seeking Alpha readers. BXP has a forward yield of 5.51%. Seeking Alpha gives BXP a C grade for dividend safety, a B- grade for dividend growth, another B- for dividend yield, and an A- for dividend consistency. I think this dividend is safe and attractive as well.
Chart 2 – BXP Weekly Price with MACD
www.stockcharts.com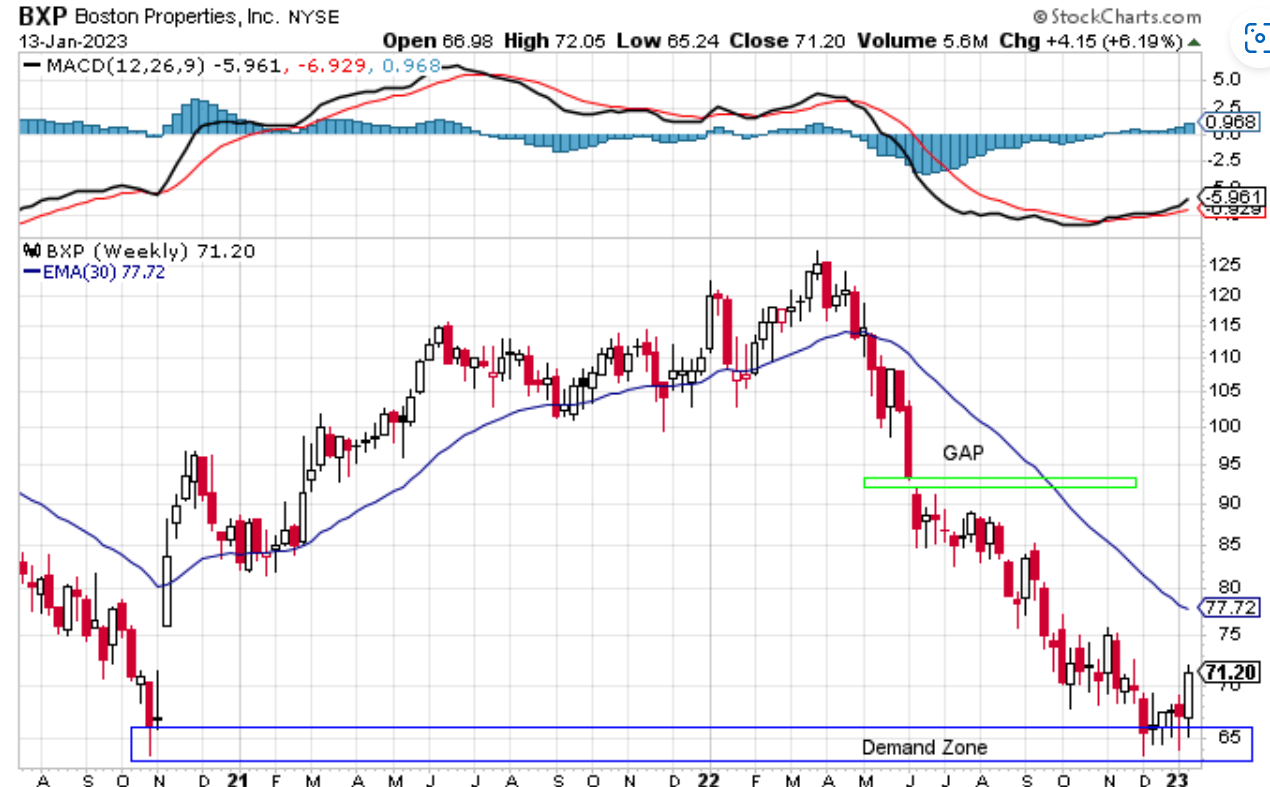
My investment thesis for BXP is based on three developments. The first is BXP coming out of a demand zone. Chart 2 shows BXP on a weekly chart. BXP stock reached its high in March 2022 at $127.41. BXP then reversed and sold off more than 50% reaching a recent low of $63 in early December 2022. The $65 price level corresponds to the low set in October 2020. After that low in October 2020, BXP reversed and moved higher over the next 18 months. The long blue rectangle on Chart 2 at the $65 level identifies the demand zone. A demand zone is a place where buyers see too much opportunity to pass up. Buyers stepped in at the $65 level in October 2020. Buyers have stepped in again in the past several weeks at the same level. BXP shares haven’t declined below the demand zone identified. Look at all the candlesticks that have lower wicks over the past six weeks. That is a sign of bulls stepping in and seeing opportunity. Smart money has been accumulating the stock.
The second part of my investment thesis is the big bullish candlestick last week. The candlestick closed above the recent consolidation zone over the past five weeks. Big bullish candles are what I want to see when I am long the stock. I see this as a bullish development.
The third part of my investment thesis is based on the Moving Average Convergence Divergence (MACD) indicator. As mentioned earlier, when the black signal line is above the red MACD line that is considered a bullish development. BXP shows positive or bullish momentum. Buying a stock that has bullish momentum is always a plus.
BXP has declined 50% and came back into a demand zone. Buyers have stepped in and accumulated shares. BXP had a bullish week, closing above the recent five-week consolidation area. Finally, BXP now has a bullish crossover on the weekly MACD indicator. I like these conditions, so I have bought some shares.
What could go wrong? Readers who follow my work here on Seeking Alpha know that I subscribe to the style of trading known as trend following. Well, Chart 2 shows that BXP is in a trend, a downtrend. That is not the trend I usually buy. Price has made a series of lower highs and lower lows. The blue 30-week moving average is heading lower and has not yet flattened out which it has to do before it starts heading higher. It’s for these reasons that I am taking a partial position in BXP. If BXP continues to move higher, I can add to my position. If BXP reverses and closes below the blue box which indicates a demand zone, I can sell my small position and re-evaluate. I see this as a risk of about $7 per share with an upside back to $92 or a risk to reward ratio of 1:3. The reason for the $92 initial price target is because there is a gap on the week chart between two candlesticks in June 2022. Perhaps the gap gets filled.
In summary I have identified two high yielding stocks where I am comfortable with the dividend safety. These two stocks are bullish momentum. VZ is in an uptrend and has a definitive stop loss that gives me a good risk to reward ratio. BXP is more speculative than VZ yet offers a higher risk to reward ratio. Because BXP is more speculative I am starting that position with a smaller allocation of my capital.
Be the first to comment