

Prostock-Studio
AT&T (T) is one of the most controversial stocks on Seeking Alpha and for good reason. This failed aristocrat succumbed to poor management and costly and debt-laden empire building that showcases that even the mightiest blue-chips can fall.
Charlie Bilello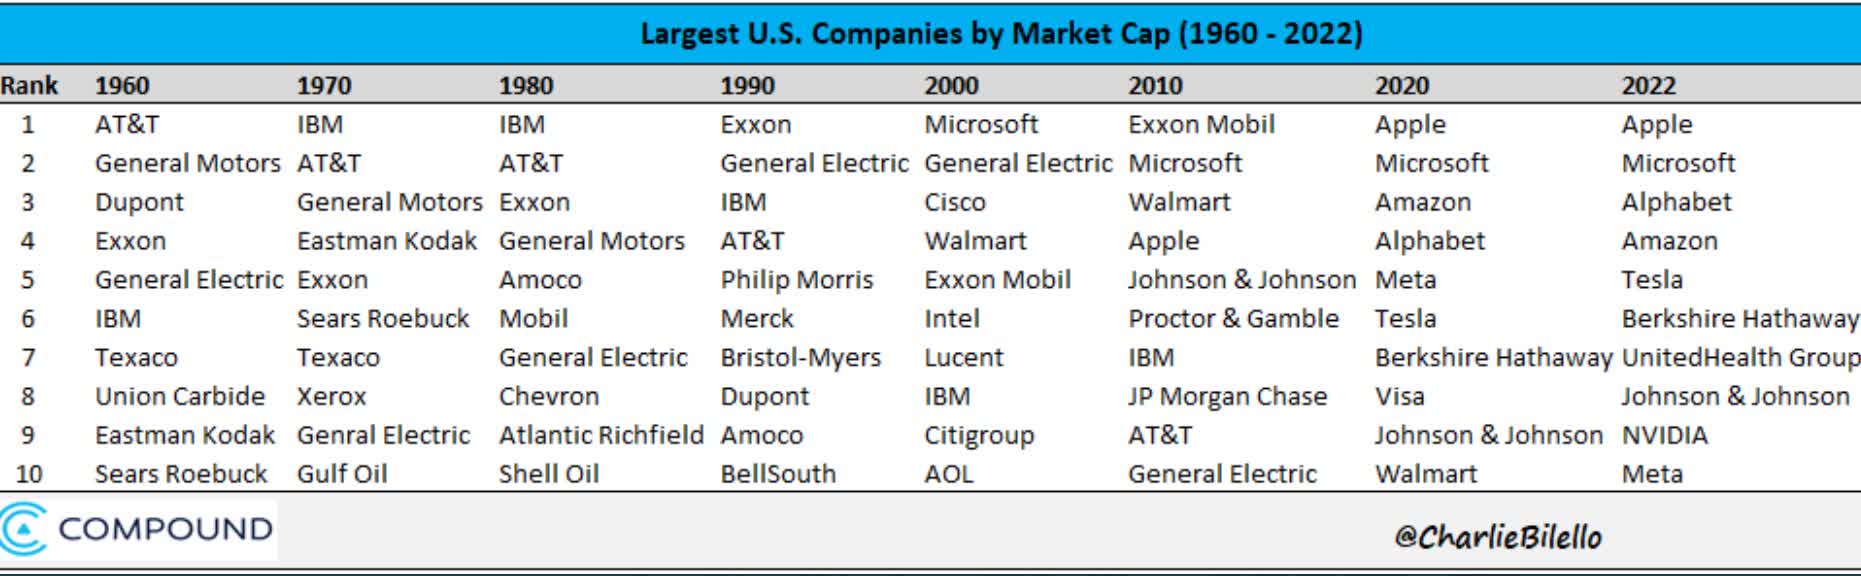
AT&T was once the largest company in America, and so was IBM (IBM). Sears was once the 6th largest and is now bankrupt as are former dividend kings Winn Dixie and Kmart.
General Electric (GE), another former aristocrat, is still down almost 90% off its tech bubble highs, after briefly becoming the most valuable company on earth.
There are no sacred cows in finance, and the prudent long-term investor follows the fundamentals wherever they lead.
“When the facts change I change my mind, what do you do sir?” – John Maynard Keynes
Several Dividend Kings members have asked me to take another look at AT&T, to see whether or not this fallen aristocrat has a chance of rising like a Phoenix from the ashes and soaring to new heights.
To answer that question there are three things we must look at:
- the balance sheet
- the dividend safety
- the long-term return outlook
So let’s take a look at the three things prospective AT&T investors need to know, and why 11 higher-yielding and far superior blue-chips are the best place for your hard-earned savings today.
Fact One: The Balance Sheet Is Improving Slowly But Surely
There is nothing more important for long-term investing success than a strong balance sheet. If a company defaults on its debt, it almost always files for bankruptcy and the stock goes to zero.
“In order to win the game first you must not lose it.” – Chuck Noll
AT&T Credit Ratings
| Rating Agency | Credit Rating | 30-Year Default/Bankruptcy Risk | Chance of Losing 100% Of Your Investment 1 In |
| S&P | BBB Stable Outlook | 7.50% | 13.3 |
| Fitch | BBB+ Stable Outlook | 5.00% | 20.0 |
| Moody’s | Baa2 (BBB equivalent) Stable Outlook | 7.50% | 13.3 |
| Consensus | BBB Stable Outlook | 6.67% | 15.0 |
(Source: S&P, Fitch, Moody’s)
Rating agencies estimate AT&T’s fundamental risk at 6.7%, a 1 in 15 chance of losing all your money in the next 30 years.
Why? Because the spinoff of WarnerMedia along with some of its debt and that nasty dividend cut has helped set AT&T on the path to financial health.
AT&T Consensus Leverage Forecast
| Year | Debt/EBITDA | Net Debt/EBITDA (3.5 Or Less Safe According To Credit Rating Agencies) |
Interest Coverage (4+ Safe) |
| 2020 | 2.88 | 2.70 | 0.81 |
| 2021 | 3.46 | 3.06 | 3.39 |
| 2022 | 3.69 | 3.03 | 3.64 |
| 2023 | 3.44 | 2.77 | 4.29 |
| 2024 | 2.88 | 2.54 | 4.93 |
| 2025 | 2.86 | 2.48 | 4.70 |
| 2026 | 2.89 | 2.64 | 3.61 |
| 2027 | 2.62 | NA | 4.81 |
| Annualized Change | -1.37% | -0.38% | 29.03% |
(Source: FactSet Research Terminal)
AT&T’s leverage peaked at 3.7 pre-spin-off and is expected to fall rapidly. Its interest coverage ratio is expected to remain stable around the 4 minimum safety guideline for stable BBB-rated companies.
AT&T Consensus Leverage Forecast
| Year | Total Debt (Millions) | Cash | Net Debt (Millions) | Interest Cost (Millions) | EBITDA (Millions) | Operating Income (Millions) |
| 2020 | $157,245 | $9,740 | $147,505 | $7,925 | $54,546 | $6,405 |
| 2021 | $177,977 | $21,169 | $157,379 | $6,884 | $51,469 | $23,347 |
| 2022 | $155,499 | $19,970 | $127,519 | $6,202 | $42,154 | $22,569 |
| 2023 | $148,884 | $20,063 | $119,858 | $5,601 | $43,247 | $24,015 |
| 2024 | $127,251 | $16,795 | $112,489 | $5,140 | $44,245 | $25,347 |
| 2025 | $127,251 | $19,874 | $110,491 | $5,482 | $44,535 | $25,744 |
| 2026 | $127,251 | $31,778 | $116,500 | $7,067 | $44,080 | $25,520 |
| 2027 | $127,251 | $82,067 | NA | $6,194 | $48,613 | $29,815 |
| Annualized Growth | -2.98% | 35.59% | -3.86% | -3.46% | -1.63% | 24.57% |
(Source: FactSet Research Terminal)
Rising interest rates in the future are expected to keep AT&T’s ability to service its debt manageable, but not so easy as to likely result in credit rating upgrades.
(Source: FactSet Research Terminal)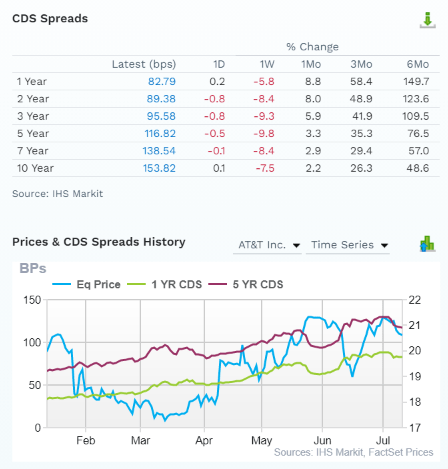
The bond market is getting a bit more worried about AT&T’s ability to service its debt, possibly due to rising recession concerns.
1-year default risk has risen by 150% in the last six months according to the bond market and 10-year default risk is up 49%.
However, the bond market is estimating a 30-year default risk at just over 4.5%, which is consistent with its existing credit ratings.
Or to put it another way, analysts, management, rating agencies, and the bond market all think that AT&T’s turnaround plan remains on track, though management’s initial guidance for 5% long-term growth appears to be unlikely.
Fact Two: Dividend Safety Remains Shaky At Best
The safest dividends are often the ones that’s just been raised and the most dangerous can be from companies that have already cut in the recent past.
With AT&T almost halving its dividend and breaking the hearts of many dividend aristocrat investors, one of the most important questions we need to be answered is how safe is the dividend and is it likely to grow over time?
AT&T Dividend Consensus Forecast
| Year | Dividend Consensus | FCF/Share Consensus | FCF Payout Ratio | Retained (Post-Dividend) Free Cash Flow | Buyback Potential | Debt Repayment Potential |
| 2022 | $1.22 | $2.11 | 57.8% | $6,372 | 4.34% | 4.1% |
| 2023 | $1.10 | $2.48 | 44.4% | $9,879 | 6.73% | 6.6% |
| 2024 | $1.10 | $2.36 | 46.6% | $9,020 | 6.14% | 6.1% |
| 2025 | $1.09 | $2.50 | 43.6% | $10,094 | 6.87% | 7.9% |
| 2026 | $1.18 | $2.32 | 50.9% | $8,161 | 5.56% | 6.4% |
| 2027 | $1.20 | $2.90 | 41.4% | $12,170 | 8.28% | 9.6% |
| Total 2022 Through 2027 | $6.89 | $14.67 | 47.0% | $55,697.02 | 37.91% | 37.41% |
| Annualized Rate | -0.33% | 6.57% | -6.47% | 13.82% | 13.82% | 18.47% |
(Source: FactSet Research Terminal)
The good news is that most analysts don’t expect AT&T to cut more. The bad news is that some due and the consensus is that the payout will basically stay flat for the next five years.
That’s despite a payout ratio of under 50% compared to 70% that rating agencies consider safe for telecoms.
AT&T is expected to retain $56 billion in post-dividend free cash flow over the next five years. That’s enough to potentially pay off 37% of its debt or buy back up to 38% of its stock at current valuations.
But don’t get too excited about the potential for mega-buybacks.
AT&T Buyback Consensus Forecast
| Year | Consensus Buybacks ($ Millions) | % Of Shares (At Current Valuations) | Market Cap |
| 2022 | $205.0 | 0.1% | $146,903 |
| 2023 | $74.0 | 0.1% | $146,903 |
| 2024 | $111.0 | 0.1% | $146,903 |
| 2025 | $611.0 | 0.4% | $146,903 |
| 2026 | $611.0 | 0.4% | $146,903 |
| Total 2022-2026 | $1,612.00 | 1.1% | $146,903 |
| Annualized Rate | 0.16% | Average Annual Buybacks | $322.40 |
(Source: FactSet Research Terminal)
Analysts only expect $1.6 billion in total buybacks through 2026, roughly enough for 1% of the shares at current valuations.
So where is that retained cash flow going? Well, management hopes into growing the core telecom business. On that front, there is some good and bad news.
Fact Three: AT&T MIGHT Make A Decent Long-Term Investment If You Have Realistic Expectations
(Source: FactSet Research Terminal)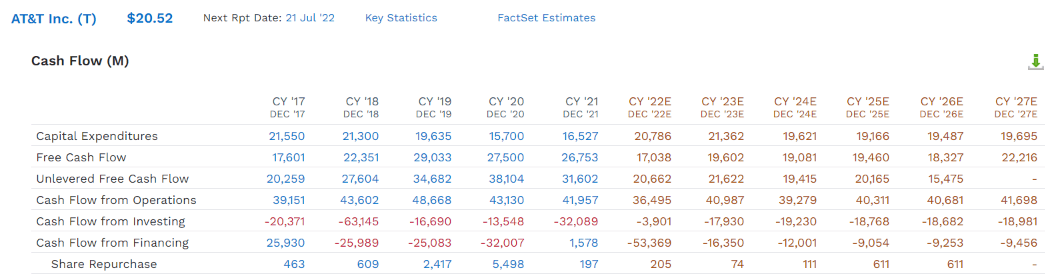
AT&T’s spin-off of WarnerMedia means that it’s not expected to recover that free cash flow, not even close. Even in 2027, analysts expect free cash flow will be 24% below 2020’s record, eight years of negative free cash flow growth.
But that doesn’t mean that analysts don’t expect AT&T to grow its earnings.
(Source: FactSet Research Terminal)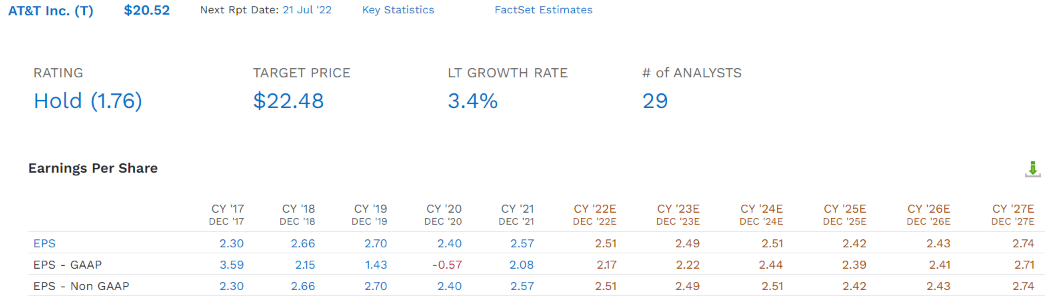
It will take until 2027 according to analysts for AT&T to hit a new record EPS, surpassing 2019’s $2.7 per share.
But over the long-term, the median consensus from all 29 analysts is that AT&T can grow at 3.4%.
- Verizon (VZ)’s consensus is 4.0%
What does this potentially mean for long-term AT&T investors?
| Investment Strategy | Yield | LT Consensus Growth | LT Consensus Total Return Potential | Long-Term Risk-Adjusted Expected Return | Long-Term Inflation And Risk-Adjusted Expected Returns | Years To Double Your Inflation & Risk-Adjusted Wealth |
10-Year Inflation And Risk-Adjusted Expected Return |
| AT&T | 5.4% | 3.4% | 8.8% | 6.2% | 3.7% | 19.5 | 1.44 |
| Verizon | 5.0% | 4% | 9.0% | 6.3% | 3.8% | 18.8 | 1.46 |
| Dividend Aristocrats | 2.6% | 8.6% | 11.2% | 7.8% | 5.4% | 13.4 | 1.69 |
| S&P 500 | 1.8% | 8.5% | 10.3% | 7.1% | 4.7% | 15.4 | 1.58 |
(Source: Morningstar, FactSet, Ycharts)
That AT&T could potentially deliver decent long-term total returns of about 9%, slightly less than Verizon and a lot less than the dividend aristocrats or S&P 500.
How realistic is it to believe that AT&T can deliver 9% long-term returns?
AT&T And Verizon Total Returns Since May 1985
(Source: Portfolio Visualizer Premium)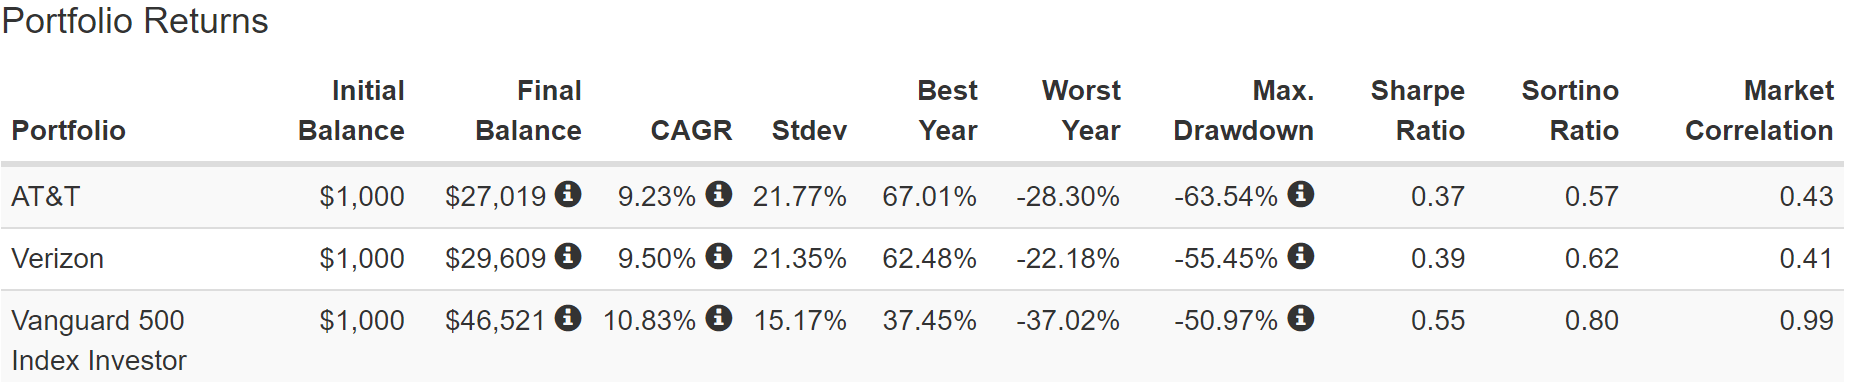
AT&T has underperformed VZ by 0.3% annually for 37 years, and analysts expect it to keep doing so in the future.
It’s delivered 9% long-term returns just as analysts expect from it today.
(Source: Portfolio Visualizer Premium)
AT&T’s rolling returns are consistent with what analysts expect in the future, with modest returns almost all coming from dividends. However, remember that these are long-term returns, and in the short-term, any company can disappoint, even for a decade.
(Source: Portfolio Visualizer Premium)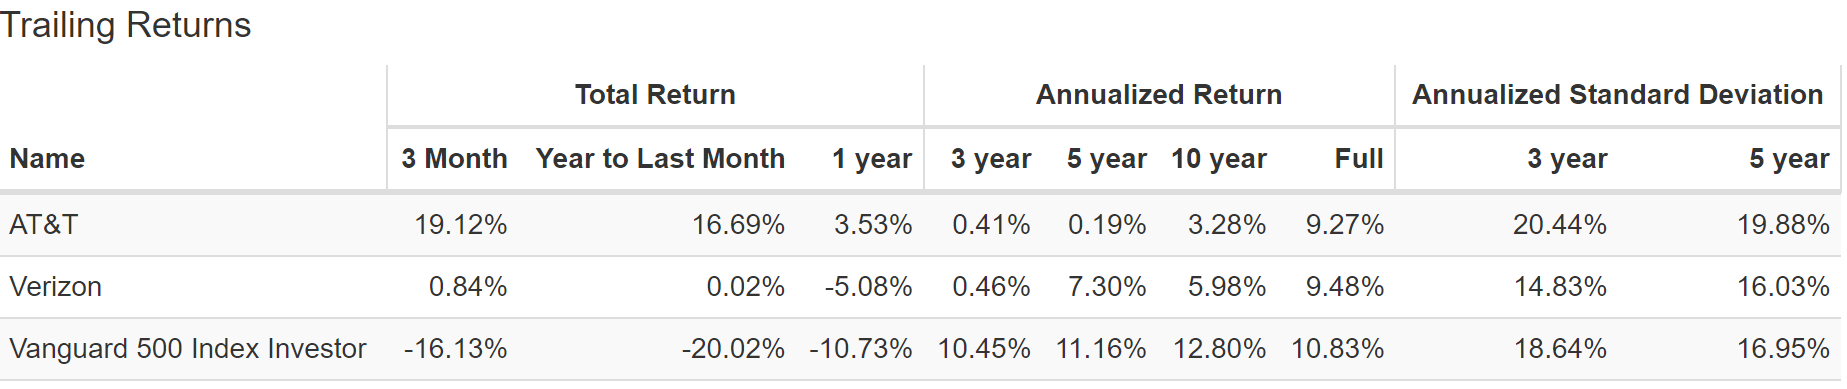
AT&T is finally having a moment in the sun, up 19% in the last three months and up almost 17% YTD. But it’s delivered almost zero inflation-adjusted returns over the last decade, thanks to former management’s penchant for expensive debt-funded M&A.
Now AT&T is focused on its circle of competence, telecom, and analysts and rating agencies are the most optimistic they’ve been in about five years at AT&T’s prospects, though admittedly that’s damning with faint praise.
But the good news is that AT&T investors likely don’t have to wait for decades to earn solid returns, potentially even Buffett-like short-term gains.
AT&T 2024 Consensus Return Potential
(Source: FAST Graphs, FactSet Research)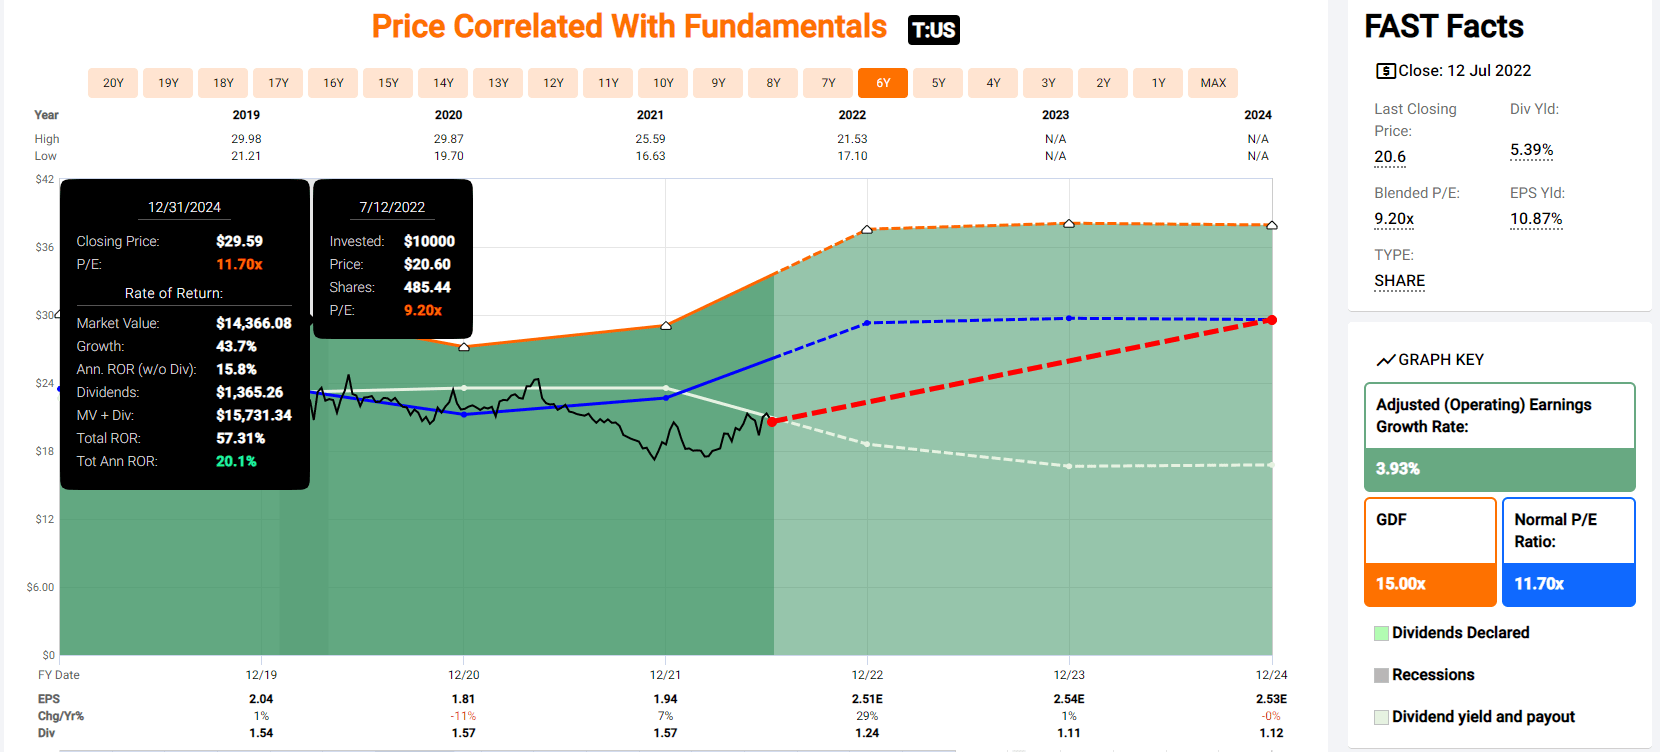
AT&T offers about 20% annual total return potential according to analysts over the next 2.5 years.
However, just because AT&T isn’t a dumpster fire of a company doesn’t mean it’s actually worth buying.
Let me show you how to stop settling for low-quality yield and instead harness the power of the world’s mightiest and highest quality high-yield blue-chips.
How To Find Some Of The World’s Best High-Yield Blue-Chips In All Market Conditions
I use the Dividend Kings Zen Research Terminal to always find the best blue-chips for any given goal, time horizon or risk profile. This super easy and convenient tool runs of the Dividend Kings 500 Master List.
The DK 500 Master List is one of the world’s best watchlists including
- every dividend aristocrat (S&P companies with 25+ year dividend growth streaks)
- every dividend champion (every company, including foreign, with 25+ year dividend growth streaks)
- every dividend king (every company with 50+ year dividend growth streaks)
- every foreign aristocrat (every company with 20+ year dividend growth streaks)
- every Ultra SWAN (wide moat aristocrats, as close to perfect quality companies as exist)
- 40 of the world’s best growth stocks
Let me show you the screen I used to find higher-yielding and far superior alternatives to AT&T.
- yield of 5.5+% (vs 5.4% AT&T): 33 companies remain
- 8.9+% long-term consensus return potential (vs 8.8% AT&T): 30 companies remain
- investment-grade credit ratings: 23 companies remain
- good buys or better (margin of safety is sufficient to compensate for each company’s risk profile): 15 companies remain
- safety score 81+ (very safe dividends): 0.5% historically average recession cut risk and 1% to 2% risk in a severe recession: 11 companies remain
- 80+ quality score (Super SWAN quality or better): 11 companies remain
Total time: 2 minutes
11 Higher-Yielding And Far Superior Alternatives To AT&T
Dividend Kings Zen Research Terminal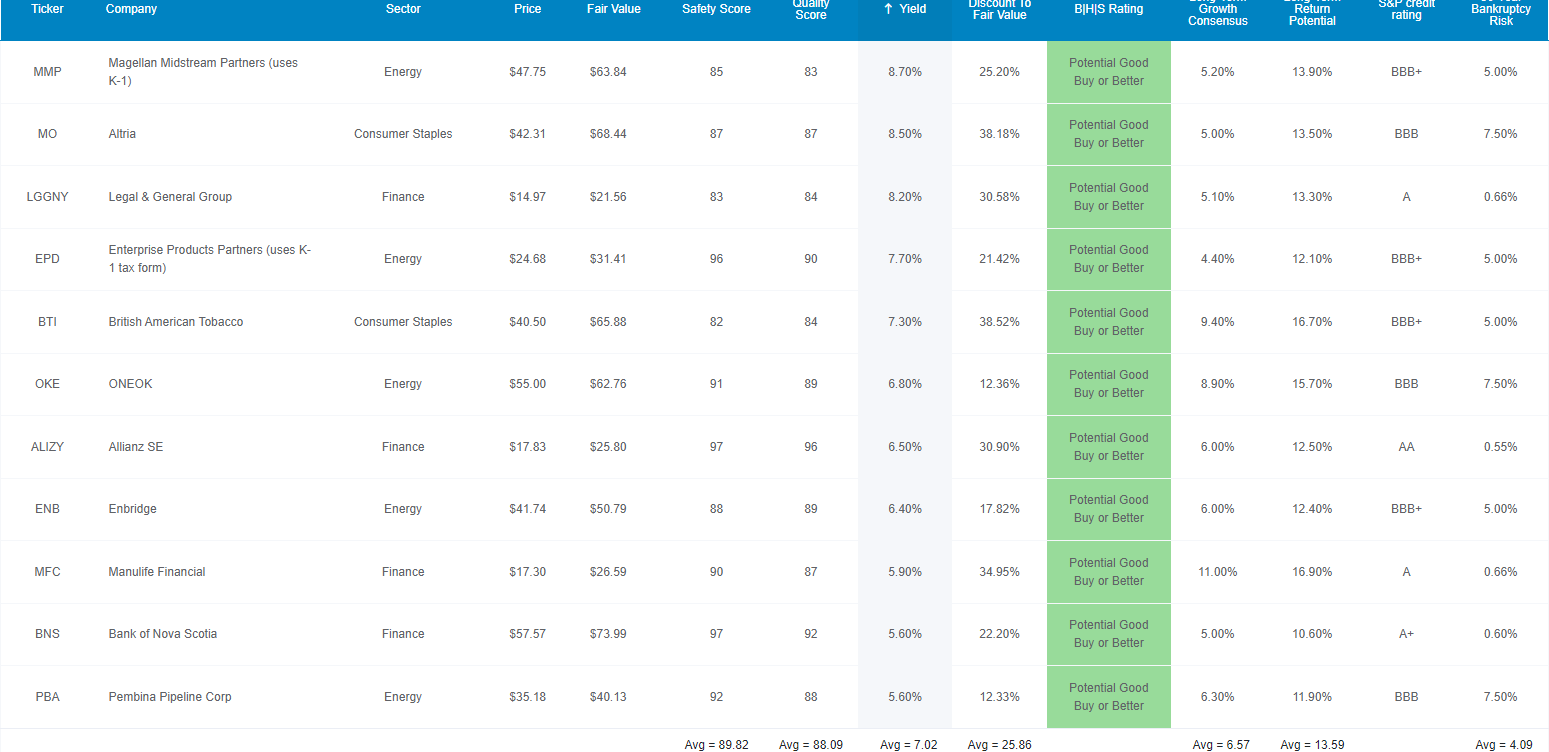
I’ve linked to articles about each company’s investment thesis, long-term growth prospects, risk profile, valuation, and total return potential.
Note that LGGNY is the ADR version and LGEN is the London Stock Exchange version. The ADR fees on LGGNY amount to about 5% of the dividend, so if your broker allows it, buy LGEN to avoid the ADR fee.
ENB, MFC, and PBA, have 15% dividend tax withholdings.
- not in retirement accounts
- in taxable accounts, you get a tax credit to recoup the withholding
ALIZY has a 26.375% dividend withholding.
- a tax credit is only available in taxable accounts
- optically own non-Canadian foreign dividend stocks (except the UK which have no withholding) in taxable accounts
FAST Graphs Up Front
Magellan Midstream Partners 2024 Consensus Total Return Potential
(Source: FAST Graphs, FactSet Research)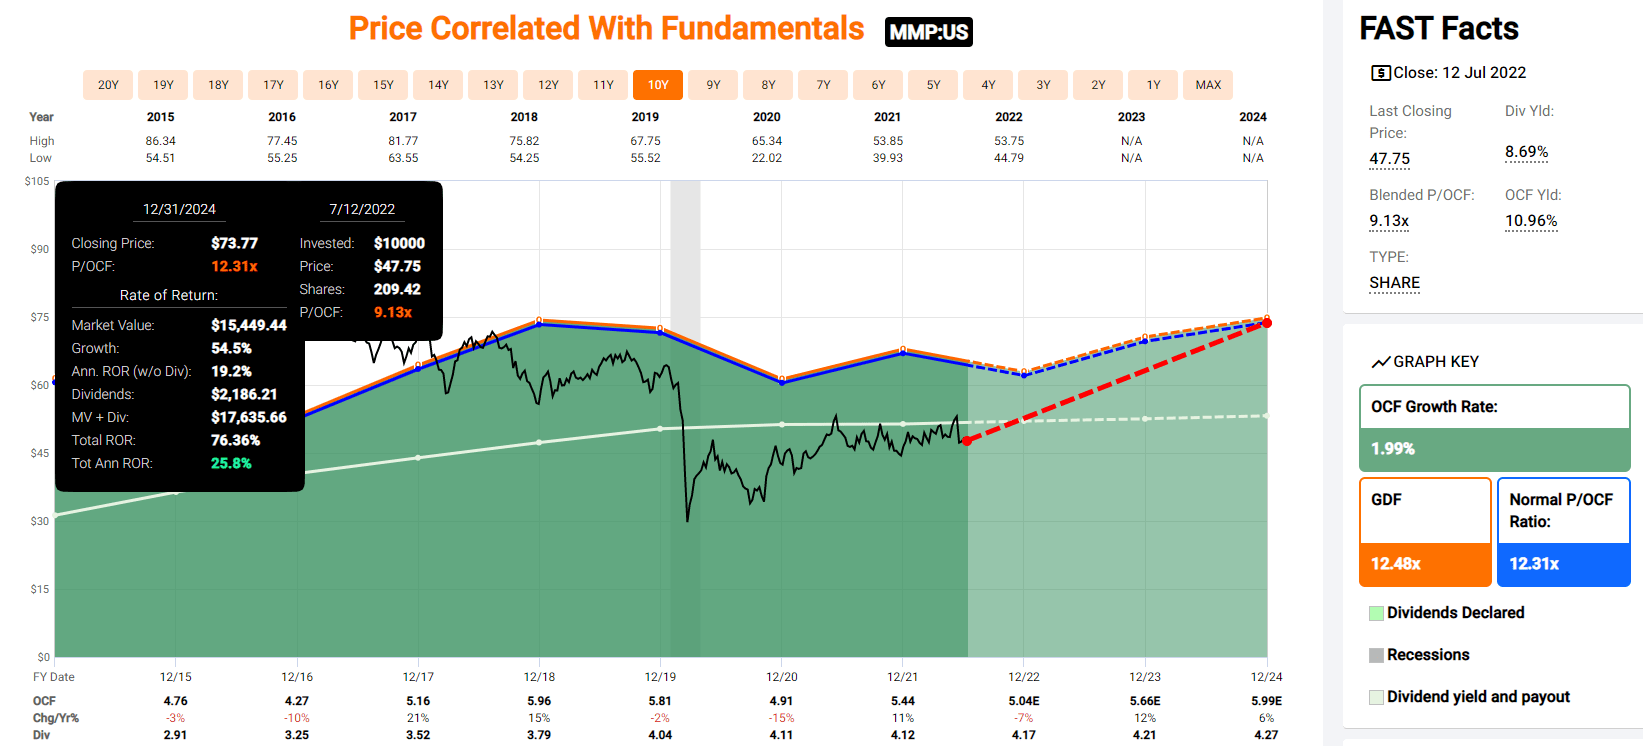
Altria 2024 Consensus Total Return Potential
(Source: FAST Graphs, FactSet Research)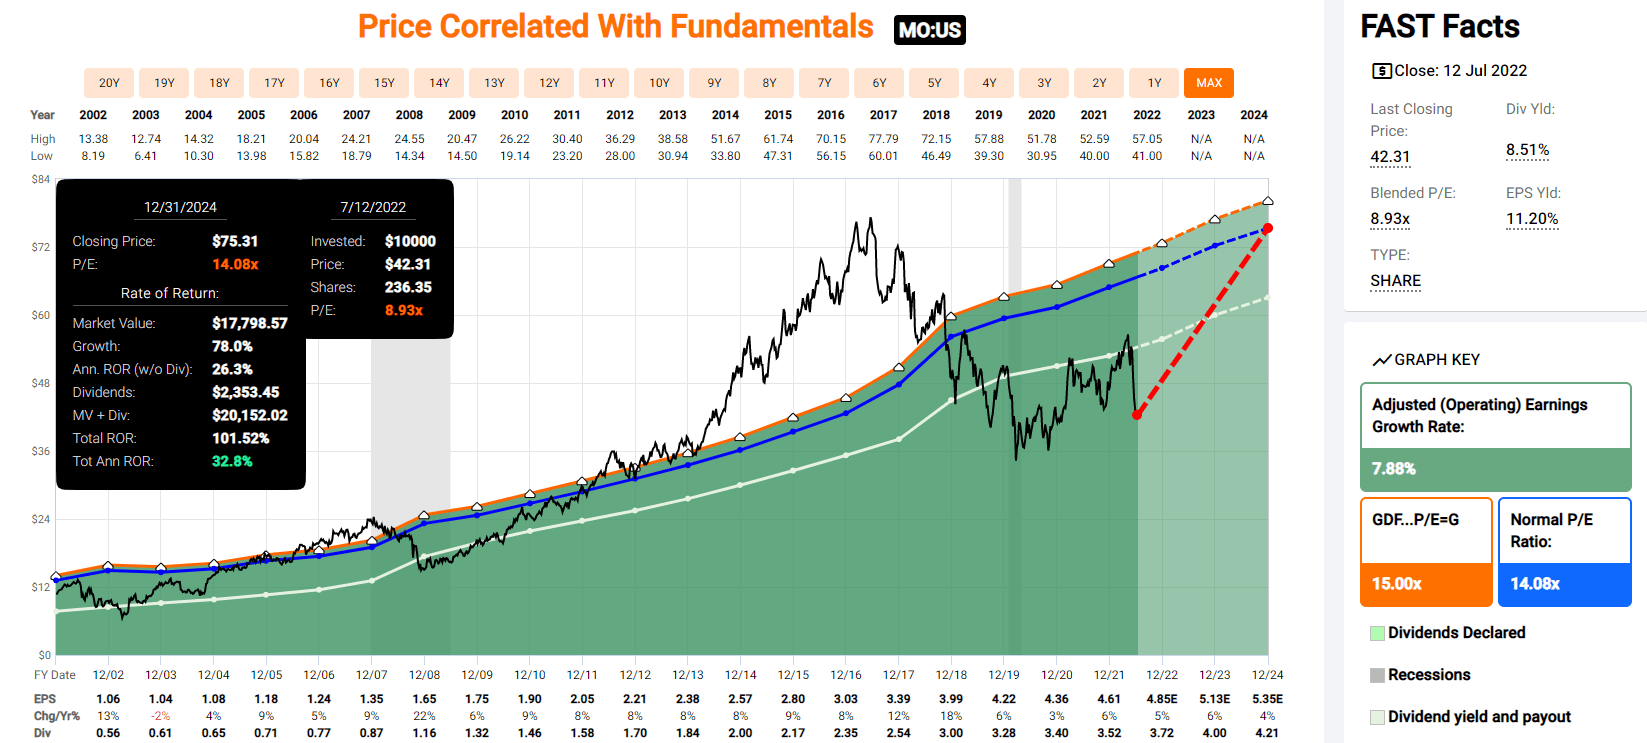
Legal & General 2024 Consensus Total Return Potential
(Source: FAST Graphs, FactSet Research)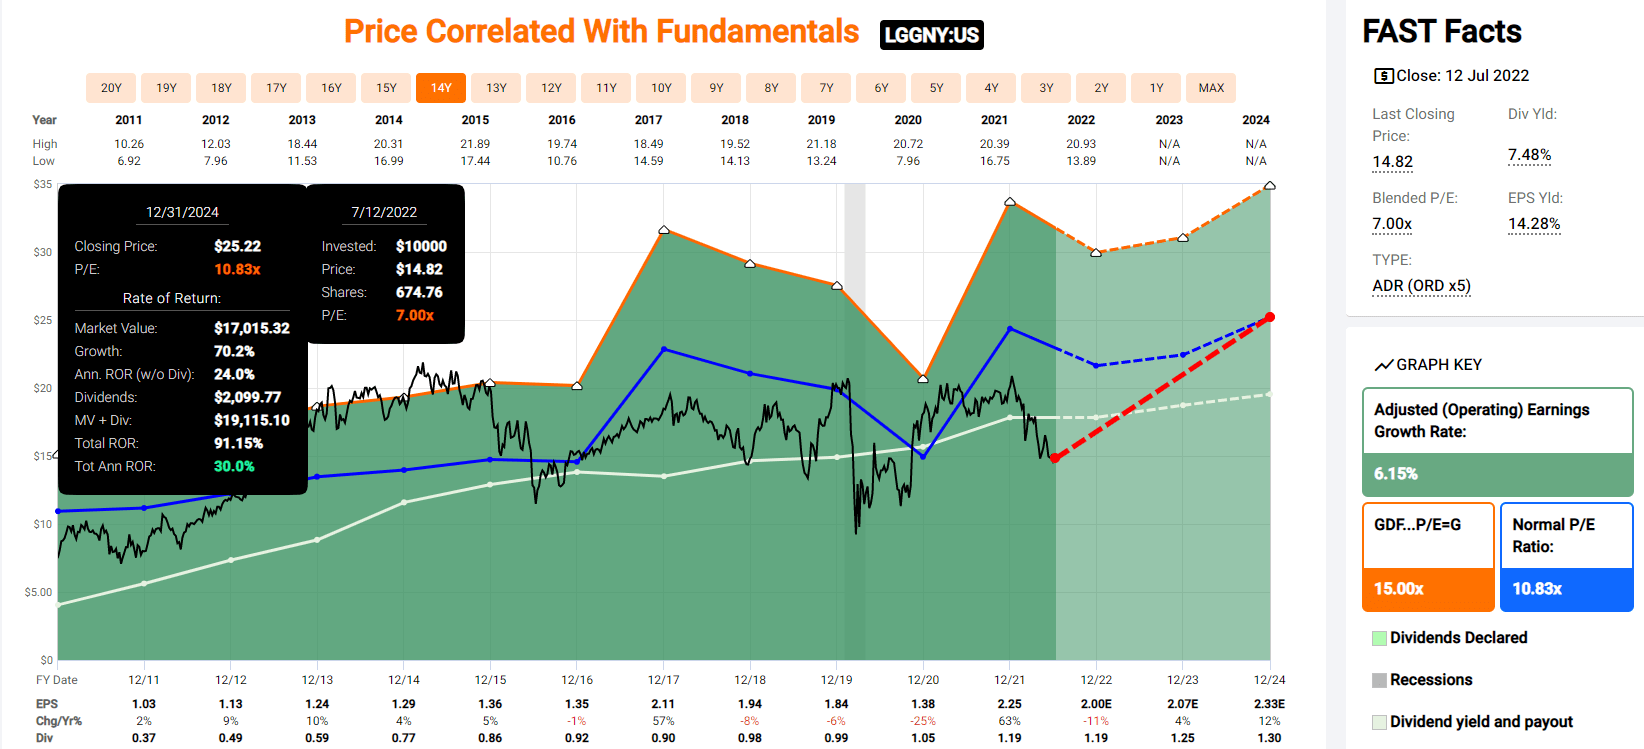
Enterprise Products Partners 2024 Consensus Total Return Potential
(Source: FAST Graphs, FactSet Research)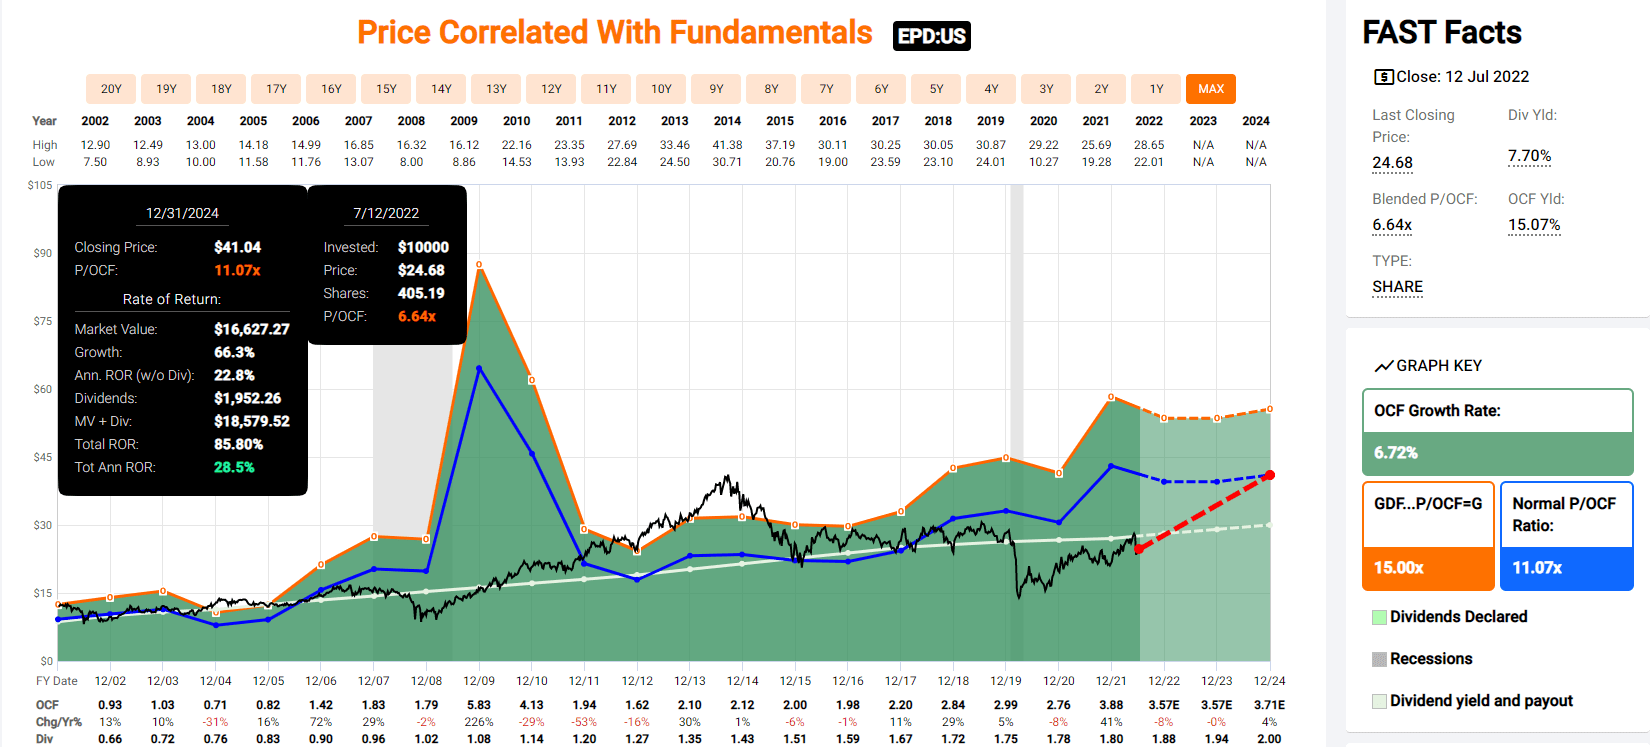
British American Tobacco 2024 Consensus Total Return Potential
(Source: FAST Graphs, FactSet Research)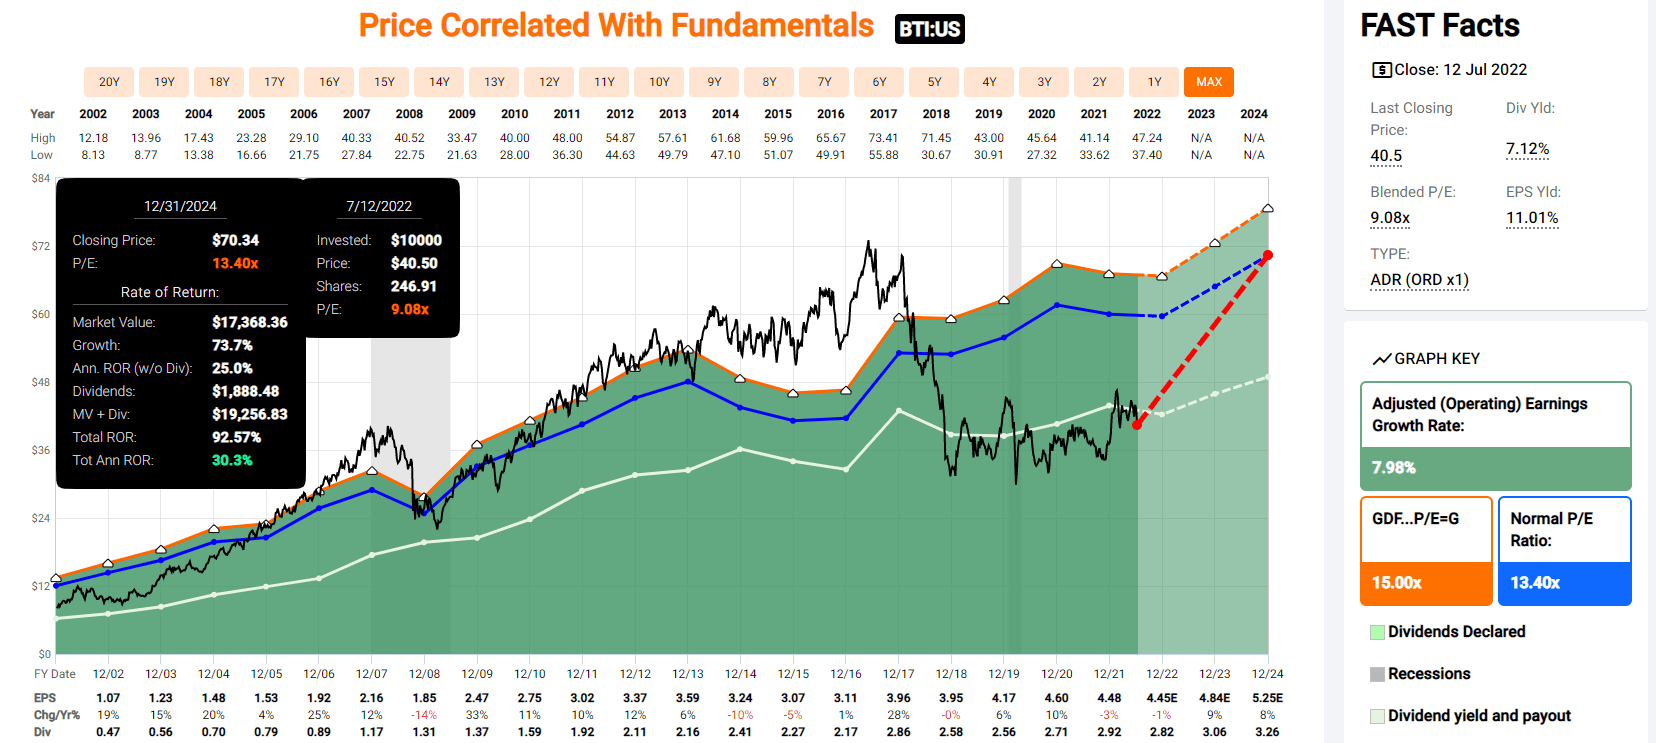
ONEOK 2024 Consensus Total Return Potential
(Source: FAST Graphs, FactSet Research)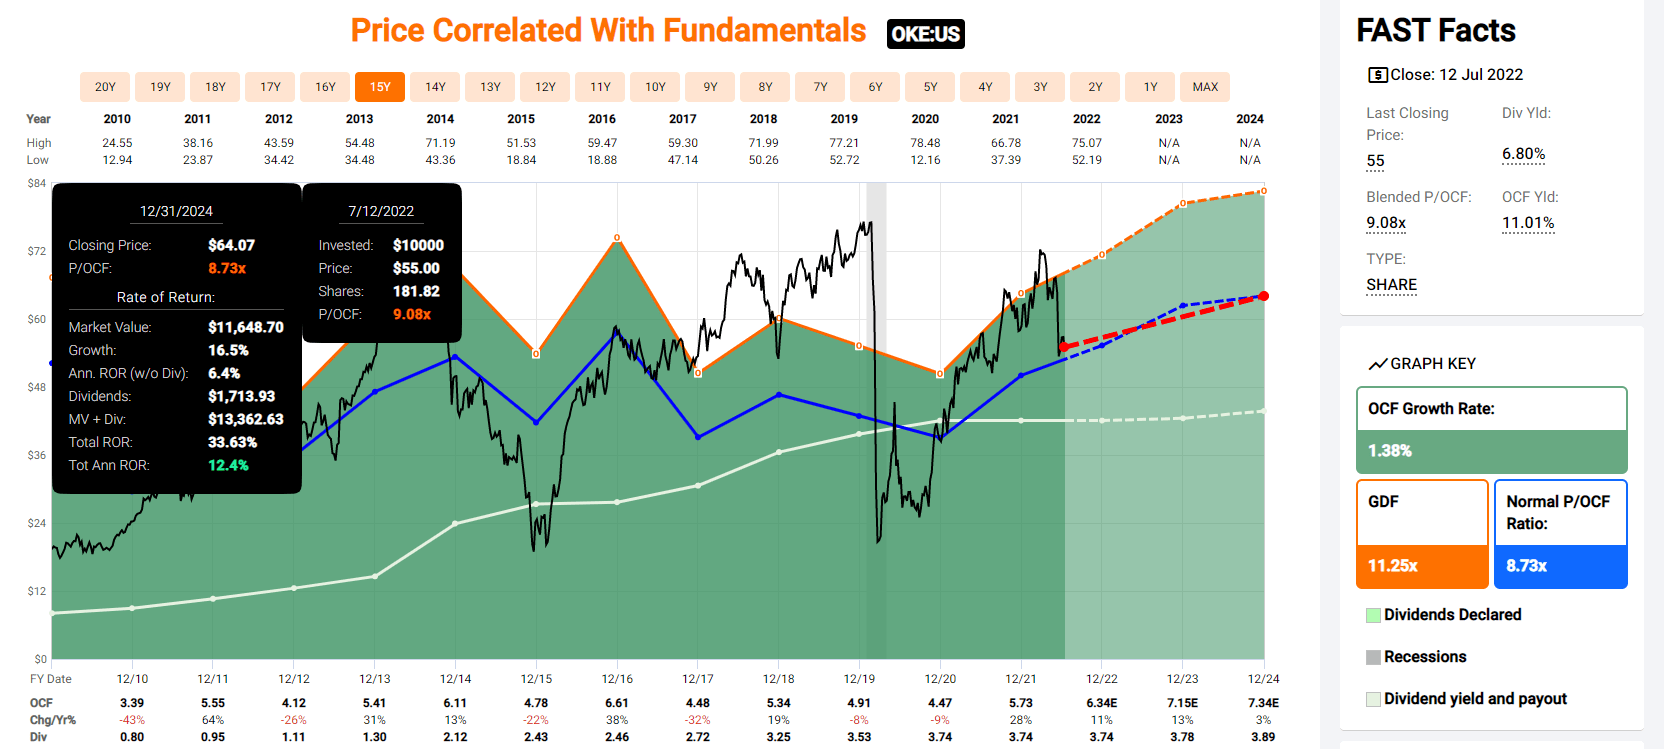
Allianz 2024 Consensus Total Return Potential
(Source: FAST Graphs, FactSet Research)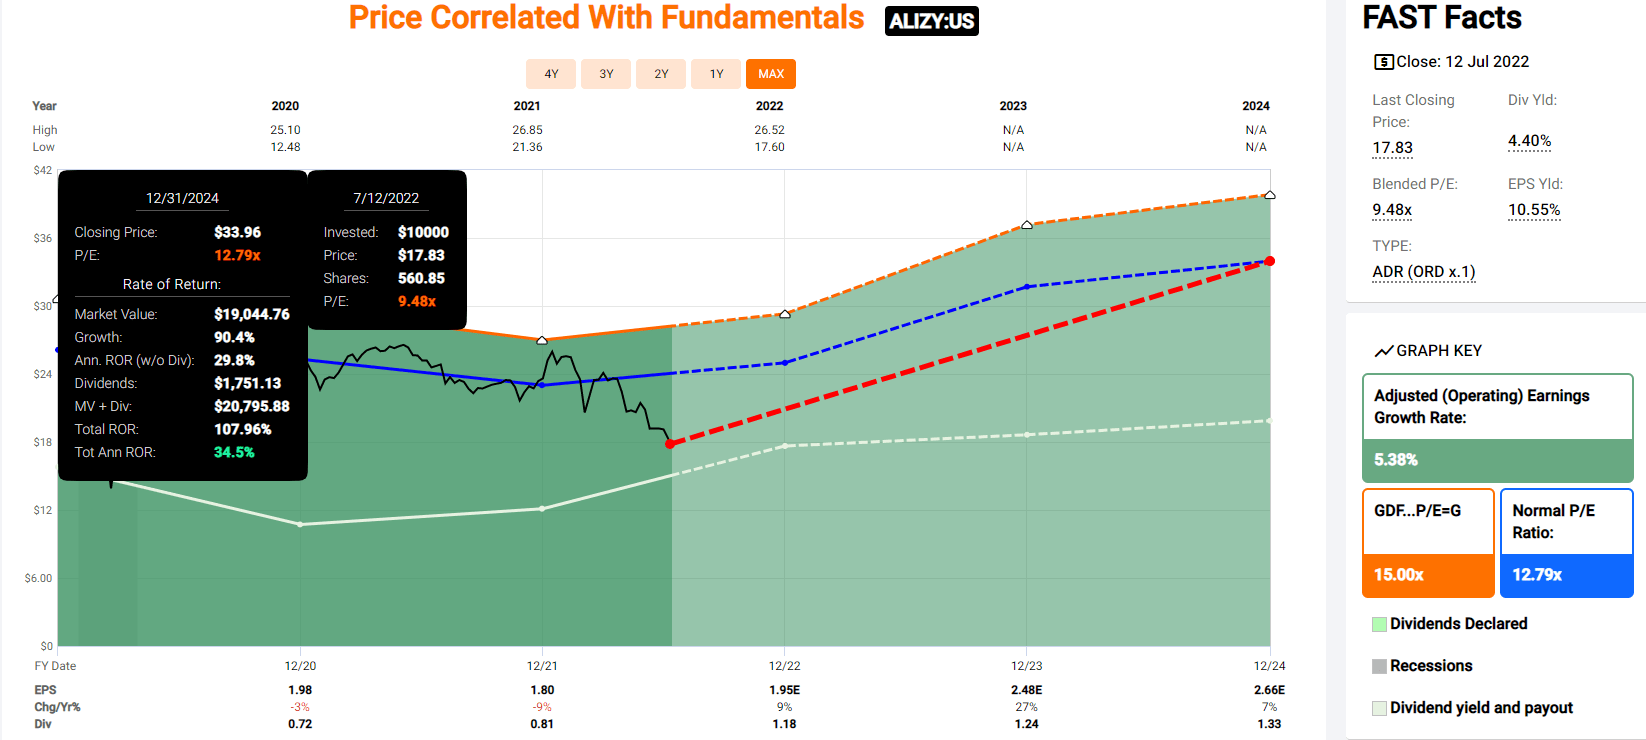
Enbridge 2024 Consensus Total Return Potential
(Source: FAST Graphs, FactSet Research)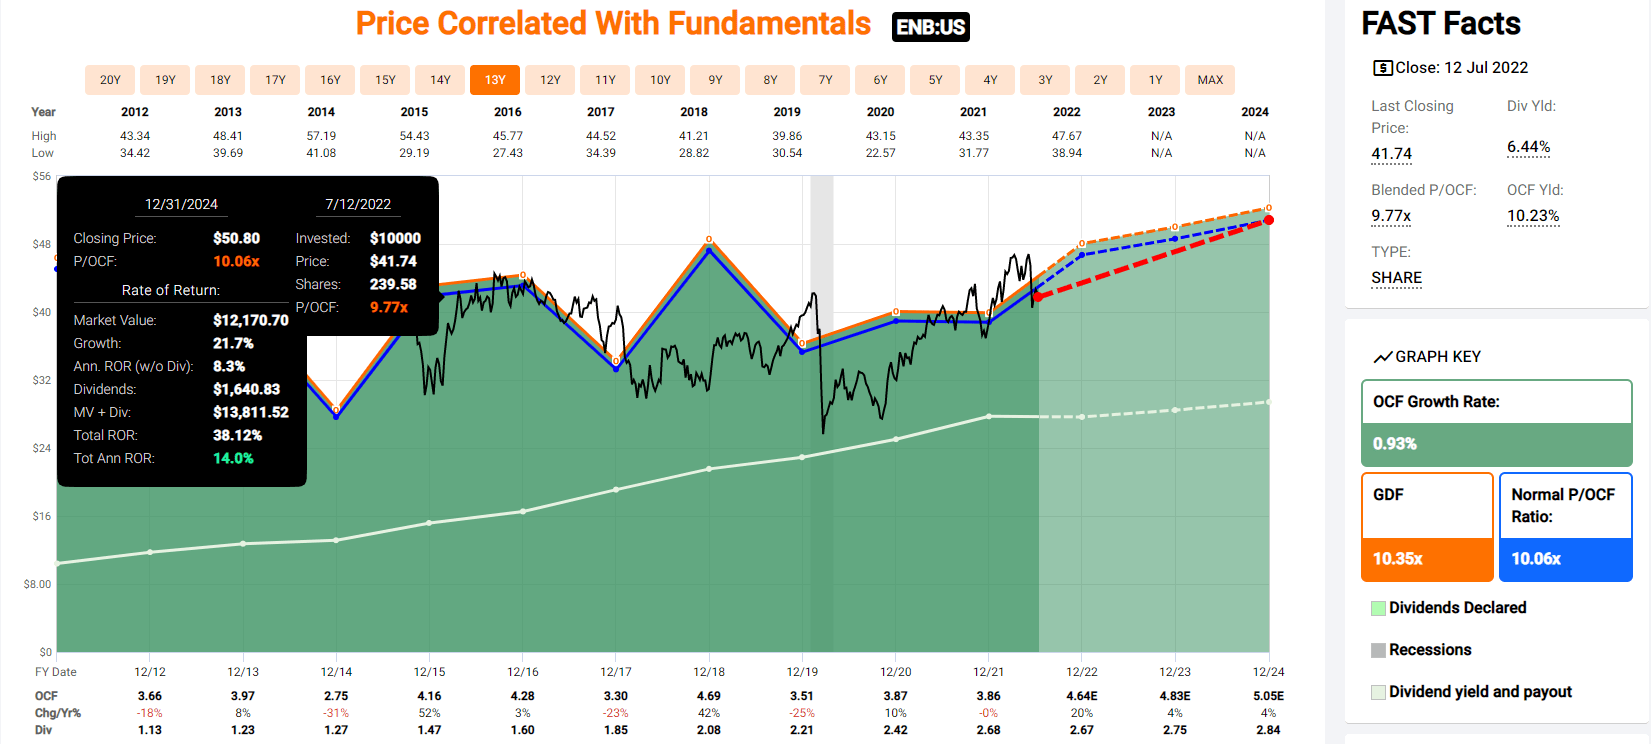
Manulife Financial 2024 Consensus Total Return Potential
(Source: FAST Graphs, FactSet Research)
Pembina Pipeline 2024 Consensus Total Return Potential
(Source: FAST Graphs, FactSet Research)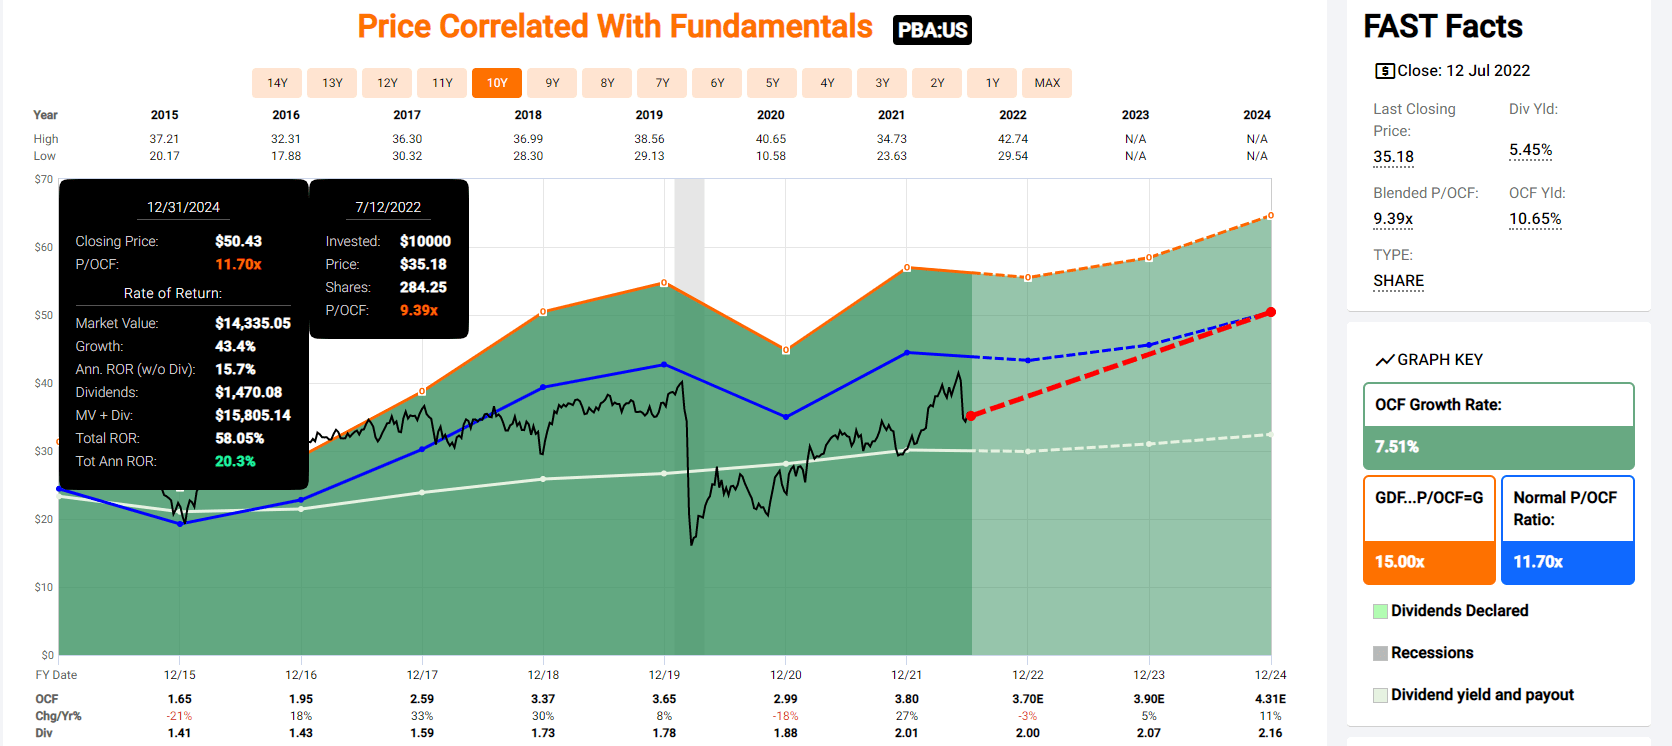
Bank of Nova Scotia 2024 Consensus Total Return Potential
(Source: FAST Graphs, FactSet Research)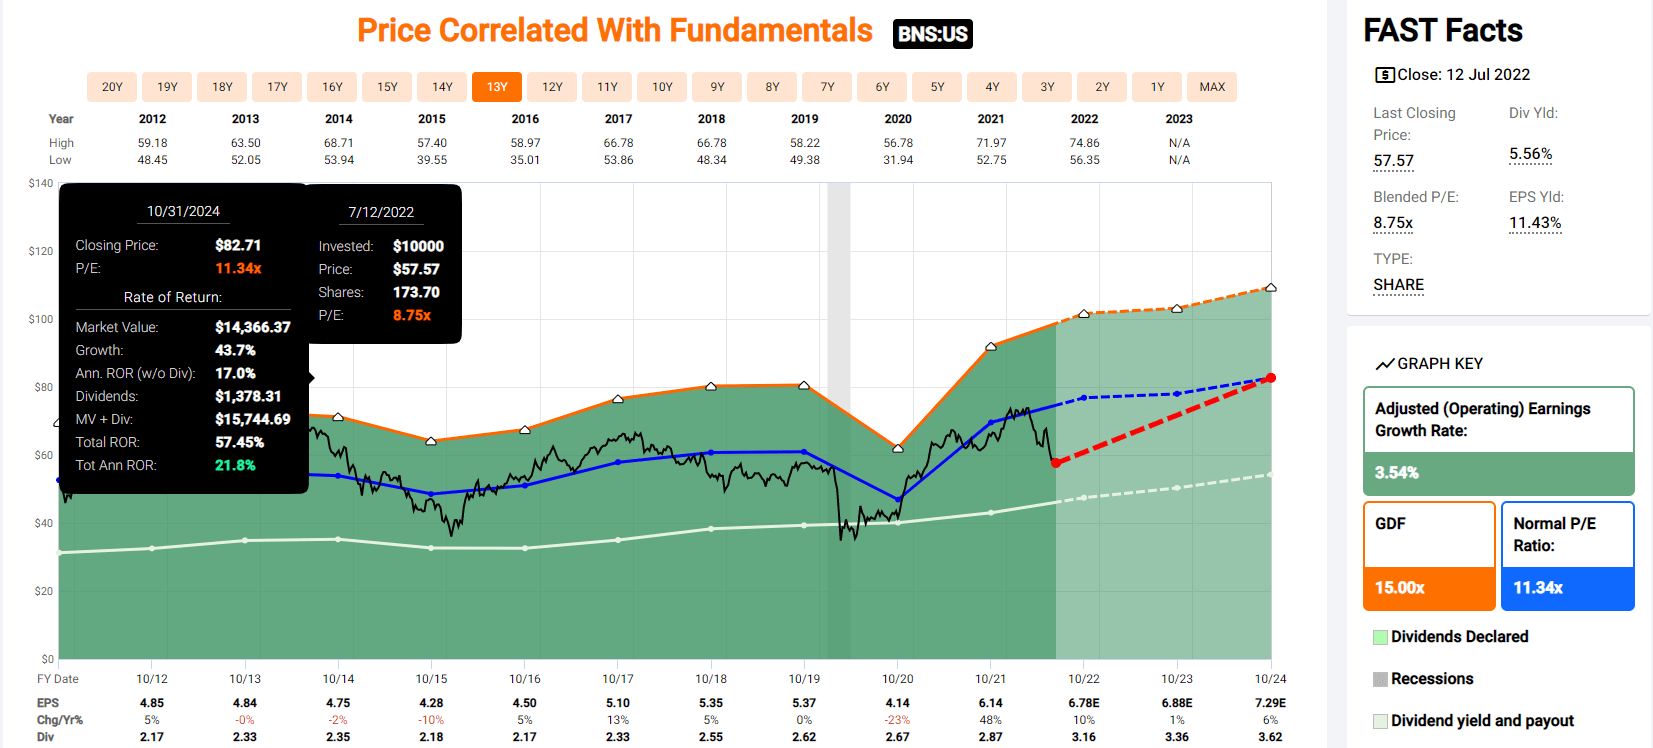
- average 2024 consensus return potential: 21.% CAGR
- literally, Buffett-like short-term return potential from 11 high-yield blue-chip bargains hiding in plain sight.
S&P 500 2024 Consensus Total Return Potential
(Source: FAST Graphs, FactSet Research)
Analysts expect about 12.5% annual returns from the S&P over the next 2.5 years, nearly 50% less than what these high-yield blue-chips potentially offer.
They also offer about 4% higher return potential through 2024 than AT&T, though with a far better track record of actually delivering market-crushing returns and dependable income growth.
OK, so now let me show you why these are such better alternatives to AT&T.
Some Of The World’s Highest Quality And Most Dependable High-Yield Blue-Chips
Dividend Kings Zen Research Terminal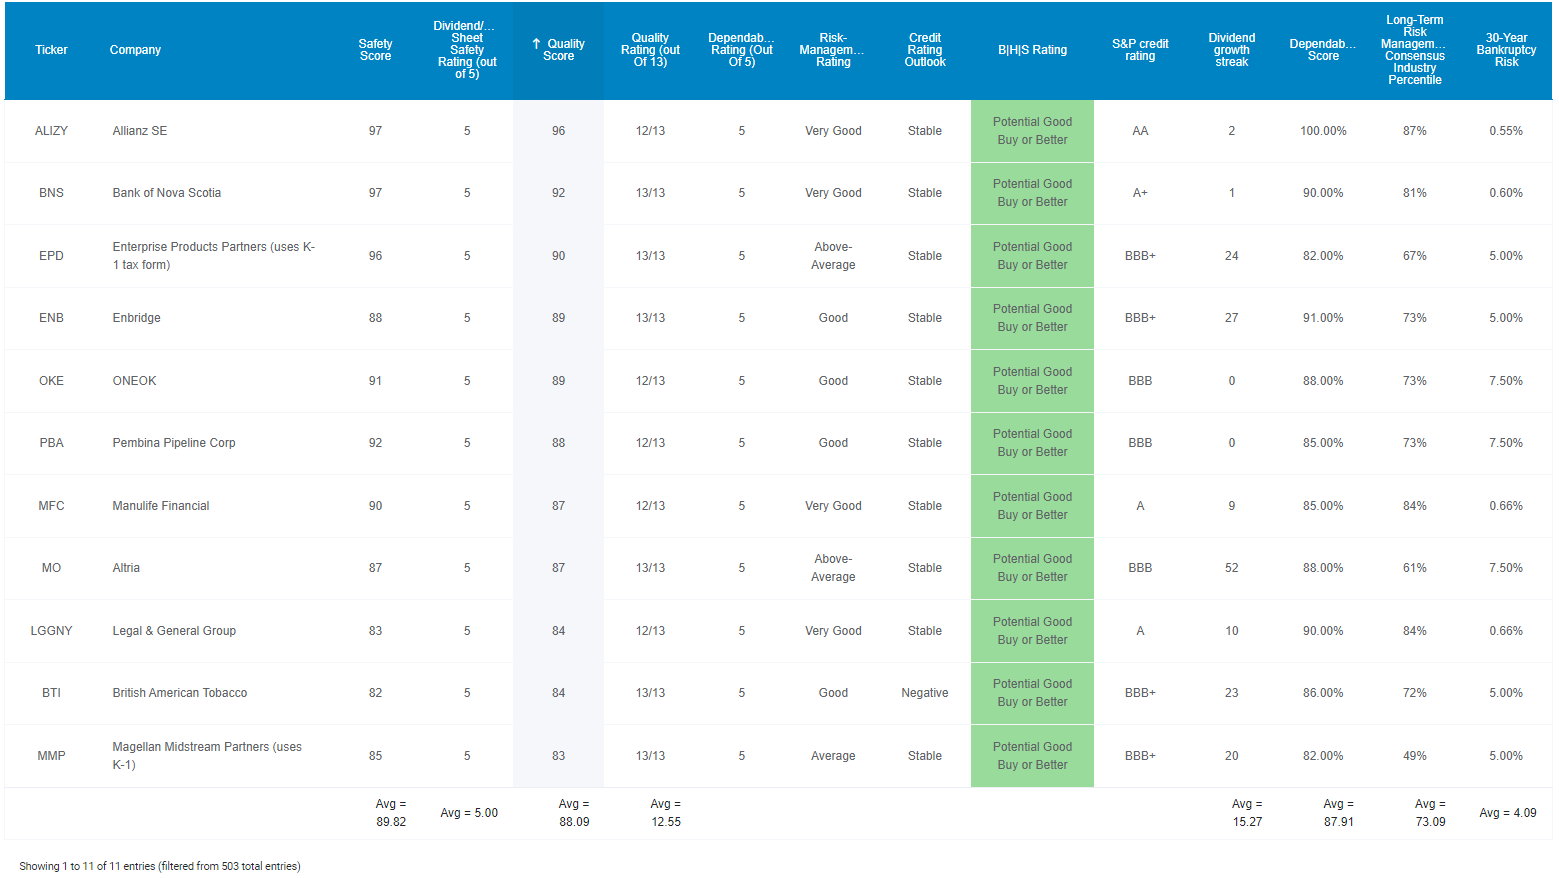
These aren’t just 7% yielding blue-chips, but 7% yielding Ultra SWANs (sleep well at night), as close to perfect quality dividend growth stocks as can exist on Wall Street.
How do I know? Because they are higher quality than the dividend aristocrats.
Higher Quality Than Dividend Aristocrats And Much Higher Quality Than AT&T
| Metric | Dividend Aristocrats | 11 High-Yield AT&T Alternatives | AT&T | Winner Aristocrats | Winner 11 High-Yield AT&T Alternatives | Winner AT&T |
| Quality | 87% | 88% | 57% | 1 | ||
| Safety | 89% | 90% | 56% | 1 | ||
| Dependability | 84% | 88% | 55% | 1 | ||
| Long-Term Risk Management Industry Percentile | 67% Above-Average | 73% Good | 75% Good | 1 | ||
| Average Credit Rating | A- Stable | BBB+ Stable | BBB Stable | 1 | ||
| Average 30-Year Bankruptcy Risk | 3.01% | 4.09% | 7.50% | 1 | ||
| Average Dividend Growth Streak (Years) | 44.3 | 15.3 | 0 | 1 | ||
| Average Return On Capital | 100% | 478% | 20% | 1 | ||
| Average ROC Industry Percentile | 83% | 87% | 60% | 1 | ||
| 13-Year Median ROC | 89% | 296% | 19% | 1 | ||
| Forward PE | 18.8 | 8.4 | 8.1 | 1 | ||
| Discount To Fair Value | 8.0% | 26.0% | 18.0% | 1 | ||
| DK Rating | Good Buy | Very Strong Buy | Reasonable Buy | 1 | ||
| Yield | 2.6% | 7.0% | 5.4% | 1 | ||
| LT Growth Consensus | 8.6% | 6.6% | 3.4% | 1 | ||
| Total Return Potential | 11.2% | 13.6% | 8.8% | 1 | ||
| Risk-Adjusted Expected Return | 7.6% | 9.1% | 5.7% | 1 | ||
| Inflation & Risk-Adjusted Expected Return | 5.1% | 6.7% | 3.2% | 1 | ||
| Years To Double | 14.0 | 10.8 | 22.3 | 1 | ||
| Total | 4 | 13 | 2 |
(Source: Dividend Kings Zen Research Terminal)
These aren’t just safe 7% yielding blue-chips, they are some of the safest 7% yielding companies on earth. How safe?
| Rating | Dividend Kings Safety Score (162 Point Safety Model) | Approximate Dividend Cut Risk (Average Recession) | Approximate Dividend Cut Risk In Pandemic Level Recession |
| 1 – unsafe | 0% to 20% | over 4% | 16+% |
| 2- below average | 21% to 40% | over 2% | 8% to 16% |
| 3 – average | 41% to 60% | 2% | 4% to 8% |
| 4 – safe | 61% to 80% | 1% | 2% to 4% |
| 5- very safe | 81% to 100% | 0.5% | 1% to 2% |
| 11 Higher-Yielding AT&T Alternatives | 90% | 0.5% | 1.5% |
| Risk Rating | Low-Risk (73rd industry percentile risk-management consensus) | BBB+ stable outlook credit rating 4.1% 30-year bankruptcy risk | 20% OR LESS Max Risk Cap Recommendation (Each) |
(Source: Dividend Kings Zen Research Terminal)
In the average recession since WWII, the approximate risk of these high-yield blue-chips cutting their dividend is 1 in 200. In a severe Great Recession or Pandemic level downturn, it’s approximately 1 in 67.
Their average dividend growth streak is 15 years. How significant is that?
Justin Law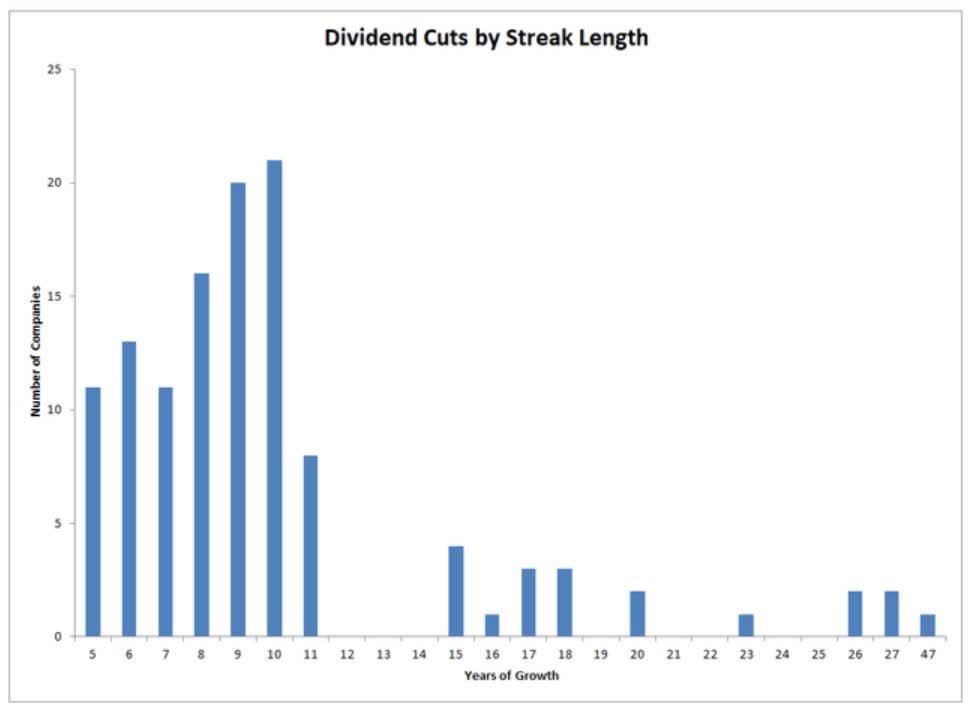
During the pandemic, companies with 12+ year dividend growth streaks were significantly less likely to cut their dividends.
- all of these companies have a progressive dividend policy
- dividends are never cut unless absolutely necessary
- and grow in-line with earnings over time
Joel Greenblatt considered return on capital his gold standard proxy for quality and moatiness.
- annual pre-tax income/the cost of running the business
One of the greatest investors in history, 40% annual returns for 21 years, used valuation and ROC as his core investing strategy.
For context, the S&P 500 has 14.6% return on capital and AT&T 20%.
The dividend aristocrats have 100% ROC and these high-yield Ultra SWANs a spectacular 478%.
Their 13-year median ROC is 296% vs the aristocrats’ 89% and AT&T’s 19%.
Their ROC is in the 87th industry percentile vs the aristocrats’ 80% and AT&T’s 60%.
What does this mean? Some of the world’s highest quality, most profitable, and widest moat companies.
S&P estimates their average 30-year bankruptcy risk (Buffett’s definition of fundamental risk) is 4.1%, a BBB+ stable credit rating vs the aristocrats’ A- stable and AT&T’s BBB stable.
And six rating agencies estimate their long-term risk management is in the 73rd industry percentile vs 75% for AT&T and 67% for the dividend aristocrats.
| Classification | Average Consensus LT Risk-Management Industry Percentile |
Risk-Management Rating |
| S&P Global (SPGI) #1 Risk Management In The Master List | 94 | Exceptional |
| Strong ESG List | 78 |
Good – Bordering On Very Good |
| Foreign Dividend Stocks | 75 | Good |
| AT&T | 75 | Good |
| 11 Higher-Yielding AT&T Alternatives | 73 | Good |
| Ultra SWANs | 71 | Good |
| Low Volatility Stocks | 68 | Above-Average |
| Dividend Aristocrats | 67 | Above-Average |
| Dividend Kings | 63 | Above-Average |
| Master List average | 62 | Above-Average |
| Hyper-Growth stocks | 61 | Above-Average |
| Monthly Dividend Stocks | 60 | Above-Average |
| Dividend Champions | 57 | Average |
(Source: DK Research Terminal)
OK, so now that you understand just why these 11 higher-yielding and much higher quality companies are so much better than AT&T, here’s why you might want to buy them today.
Wonderful Companies At Wonderful Prices
Dividend Kings Zen Research Terminal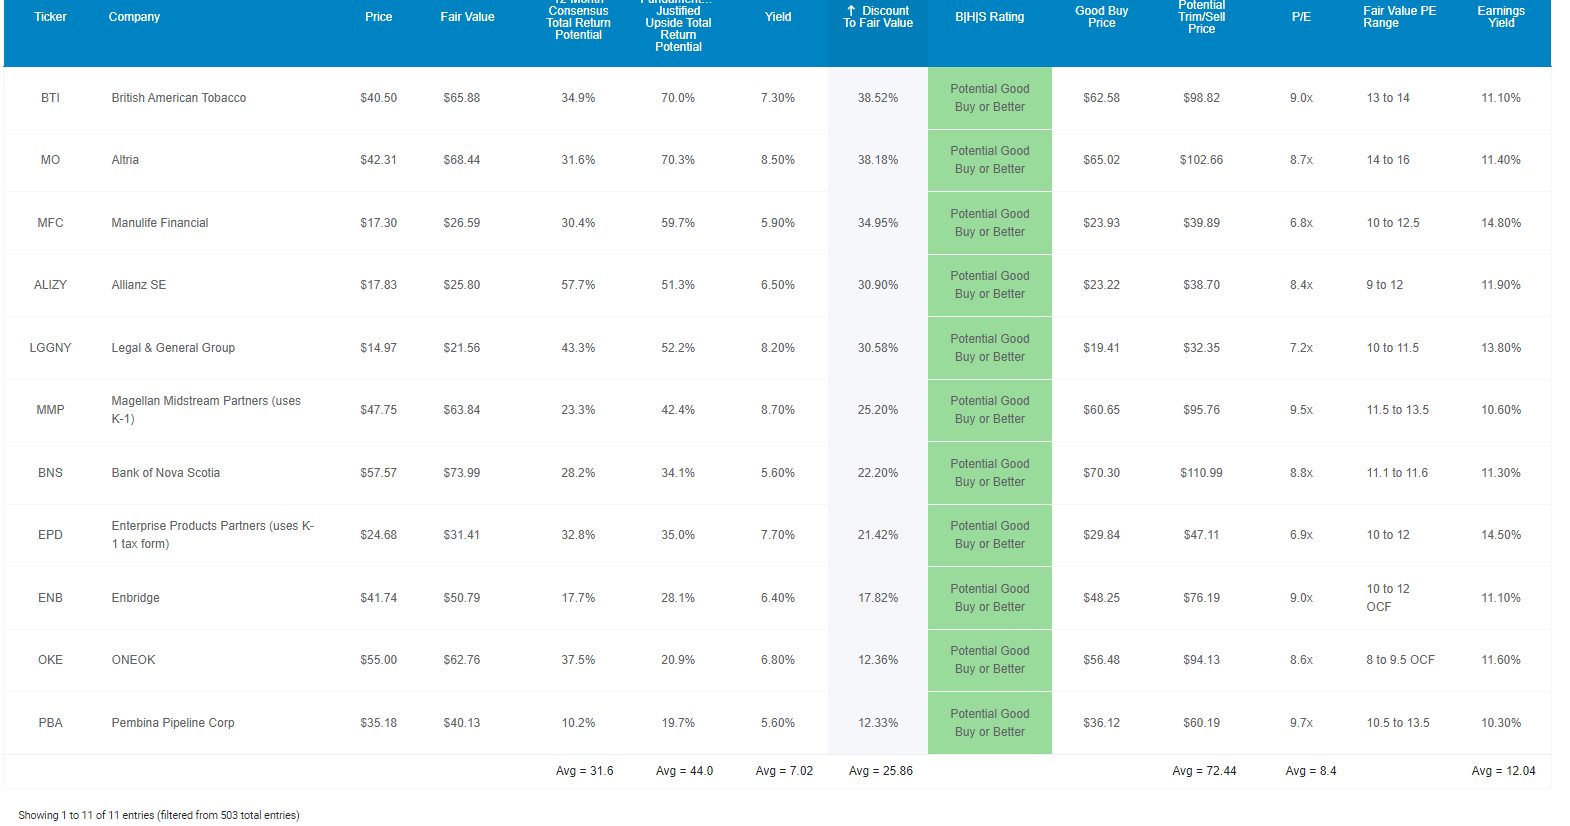
AT&T trades at 8.1X forward earnings, an anti-bubble valuation, that Morningstar estimates is an 18% discount to its fair value of $25.
The S&P trades at 16.0X forward earnings, a 4% historical discount to its 10, 25, and 45-year average forward PE.
The dividend aristocrats trade at 18.8X forward earnings, an 8% historical discount.
These high-yield blue-chips trade at 8.4X earnings, a 26% historical discount.
That’s why analysts expect 32% total returns in the next 12 months, but 44% total returns are fundamentally justified by their fundamentals.
If these companies all grow as expected and return to their historical fair value within 12 months, then investors will make 44% returns in a year.
What about the aristocrats?
- average 12-month median analyst forecast: 22.4%
- fundamentally justified 12-month total return: 14.9%
But my goal isn’t to help you earn 32% or even 44% in 12 months, though these high-yield blue-chips are fundamentally capable of that.
My goal is to help you retire in safety and splendor by earning potentially 45X returns over decades.
Long-Term Return Potential That Puts AT&T To Shame And Can Help You Retire In Safety And Splendor
Dividend Kings Zen Research Terminal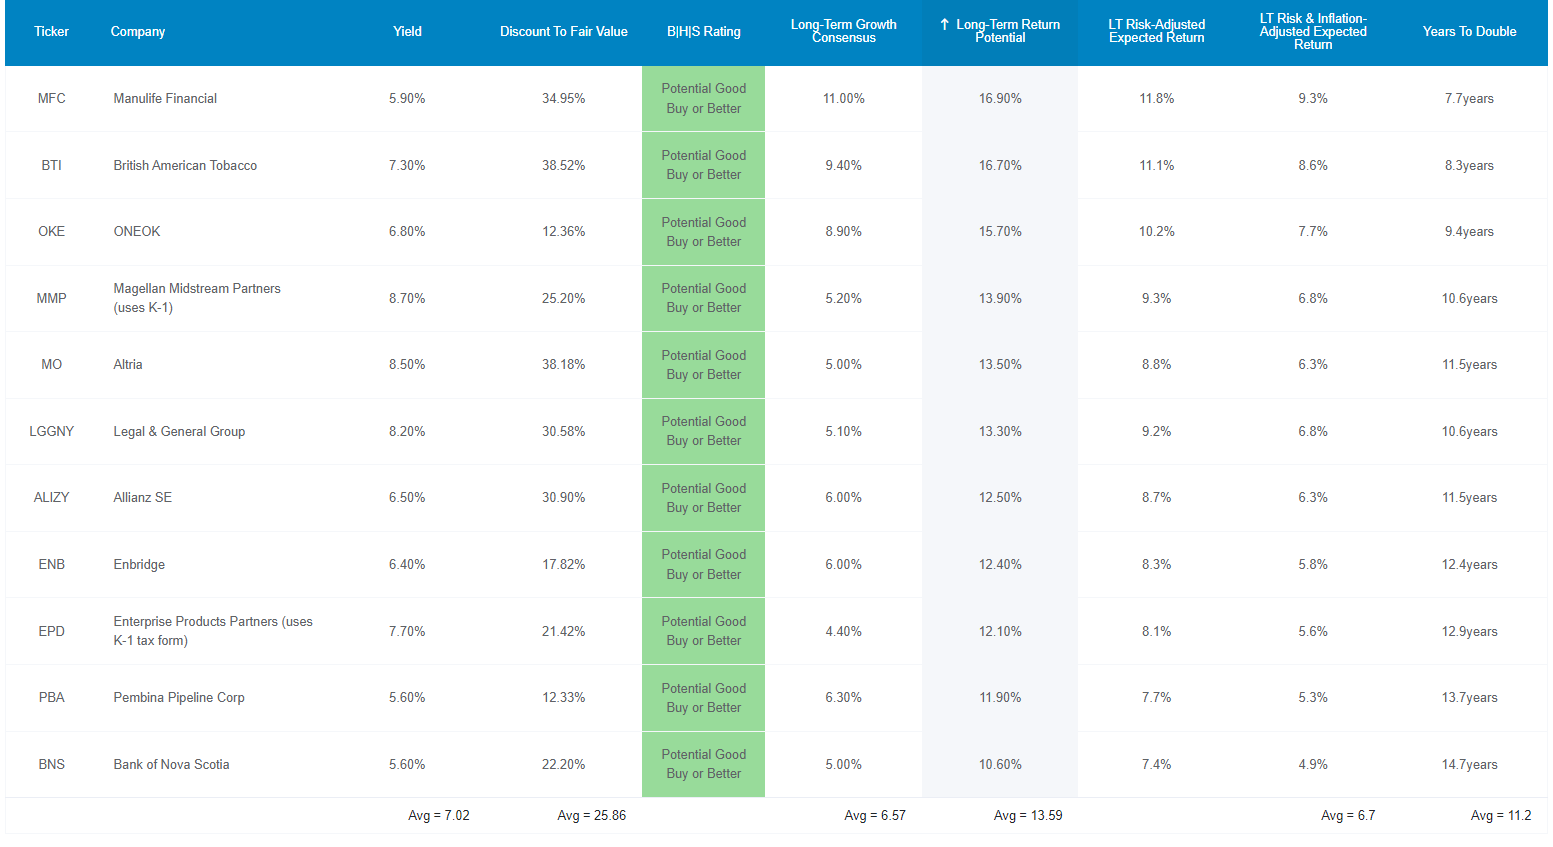
Not only do these 11 blue-chips yield 7%, 33% more than AT&T, but analysts expect them to grow 6.6%, almost 2X as fast as AT&T.
That means 13.6% consensus return potential and 6.7% risk and inflation-adjusted expected returns. What are real expected returns?
- analyst consensus adjusted for the probability of companies not growing as expected
- not returning to fair value
- going bankrupt
- the bond market’s 30-year inflation forecast
In other words, it’s a reasonable estimate of what you can expect to make.
Dividend 72% by the real expected return and you get how long it’s likely to take for you to double your inflation-adjusted savings.
- S&P 500’s doubling time is 15.3 years
- aristocrats 14.0 years
- AT&T’s 22.3 years
- these 11 high-yield blue-chips 11.2 years
Think that doubling your money 3 or 4 years faster than the aristocrats or S&P 500 doesn’t matter? Well just take a look at what kind of life-changing difference in wealth it could mean for you.
Inflation-Adjusted Consensus Total Return Potential: $510,000 Average Retired Couple’s Savings Initial Investment
| Time Frame (Years) | 7.7% CAGR Inflation-Adjusted S&P Consensus | 8.7% Inflation-Adjusted Aristocrats Consensus | 11.1% CAGR Inflation-Adjusted 11 Higher-Yielding AT&T Alternatives Consensus | Difference Between Inflation-Adjusted 11 Higher-Yielding AT&T Alternatives Consensus Vs S&P Consensus |
| 5 | $740,037.07 | $775,027.51 | $864,423.86 | $124,386.79 |
| 10 | $1,073,833.07 | $1,177,779.68 | $1,465,154.15 | $391,321.08 |
| 15 | $1,558,188.78 | $1,789,826.76 | $2,483,361.20 | $925,172.42 |
| 20 | $2,261,014.63 | $2,719,931.31 | $4,209,169.97 | $1,948,155.33 |
| 25 | $3,280,852.25 | $4,133,375.65 | $7,134,327.39 | $3,853,475.14 |
| 30 | $4,760,690.75 | $6,281,332.99 | $12,092,319.31 | $7,331,628.55 |
(Source: DK Research Terminal, FactSet)
For the average retired couple, it means potentially $7.3 million in inflation-adjusted wealth over a 30-year retirement.
| Time Frame (Years) | Ratio Aristocrats/S&P Consensus | Ratio Inflation-Adjusted 11 Higher-Yielding AT&T Alternatives Consensus vs S&P consensus |
| 5 | 1.05 | 1.17 |
| 10 | 1.10 | 1.36 |
| 15 | 1.15 | 1.59 |
| 20 | 1.20 | 1.86 |
| 25 | 1.26 | 2.17 |
| 30 | 1.32 | 2.54 |
(Source: DK Research Terminal, FactSet)
That’s potentially 2.5X more than the S&P 500 and 2X better than analysts expect from the dividend aristocrats.
Do you see how the right high-yield blue-chips can help you retire in safety and splendor?
OK, but that assumes these companies deliver almost 14% long-term returns for decades. What evidence is there that they can actually do that?
Historical Returns Since November 2003 (Equal Weighting, Annual Rebalancing)
“The future doesn’t repeat, but it often rhymes.” – Mark Twain
Past performance is no guarantee of future results, but studies show that blue-chips with relatively stable fundamentals over time offer predictable returns based on yield, growth, and valuation mean reversion.
Bank of America
So let’s see how these 11 higher-yielding AT&T alternatives performed over the last two decades when 91% of their returns were the result of fundamentals, not luck.
(Source: Portfolio Visualizer Premium)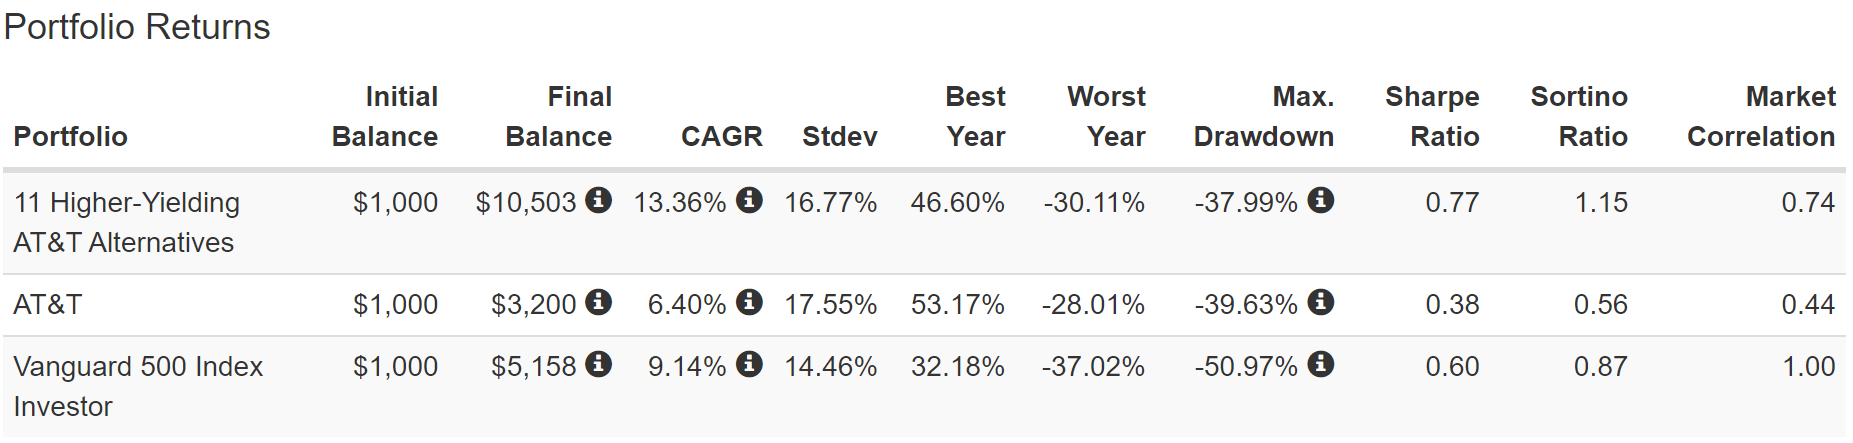
Analysts expect 13.6% long-term returns and they delivered…13.4% CAGR. That’s more than 2X the annual return of AT&T and almost 4% higher than the S&P 500.
And they did it with slightly lower volatility than AT&T and 2X higher negative-volatility-adjusted total returns (Sortino ratio).
- 32% higher negative-volatility adjusted annual returns than the S&P 500
(Source: Portfolio Visualizer Premium)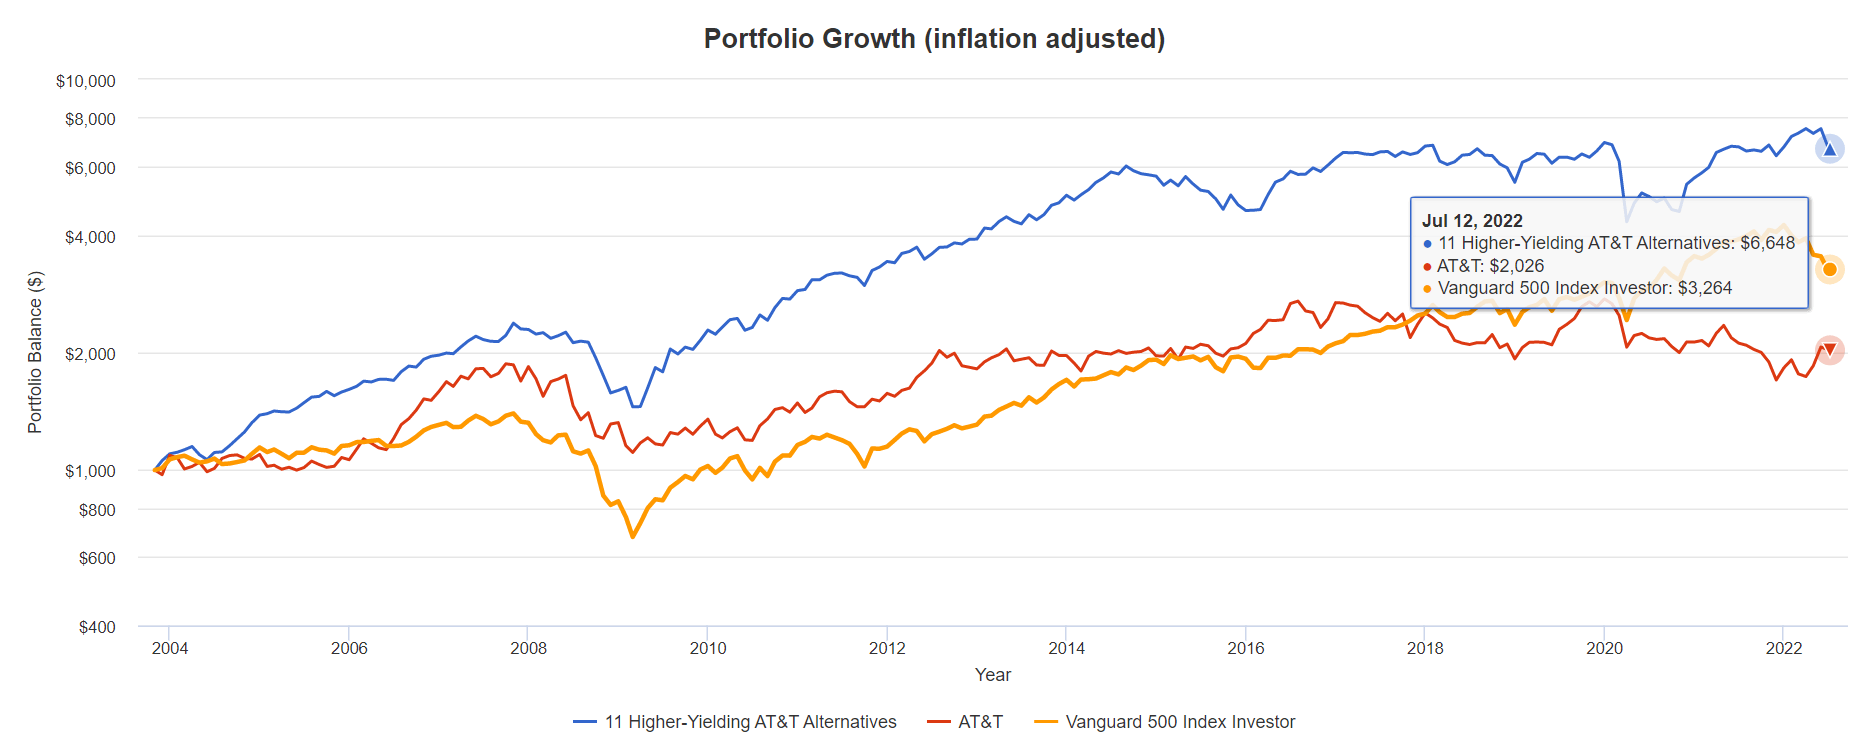
Analysts expect about 4X inflation-adjusted returns from the S&P in the next 20 years. Over the last 11 years, the market delivered 3.3X returns.
Analysts expect AT&T to double your money roughly every 22 years, and in the last 19 years, it delivered exactly 2X inflation-adjusted returns.
Analysts expect these 11 high-yield blue-chips to potentially deliver about 8.3X inflation-adjusted returns. Over the last 20? 6.6X and that’s factoring in their current 11% bear market.
- without the current bear market, they would have delivered 7.5X inflation-adjusted returns.
- within 10% of what the Gordon Dividend growth model predicted
- over 19 years
- the most accurate long-term forecasting model ever devised
- which is used by almost every asset manager
- BlackRock, Vanguard, Oaktree, Brookfield, Fidelity, Schwab, etc.
(Source: Portfolio Visualizer Premium)
Their average rolling returns were 12% to 15%, 2X more than AT&T’s.
Their worst 15-year returns?
- 3.82X return for these 11 high-yield blue-chips
- 1.4X return for AT&T
- 2.9X return for S&P 500
(Source: Portfolio Visualizer Premium)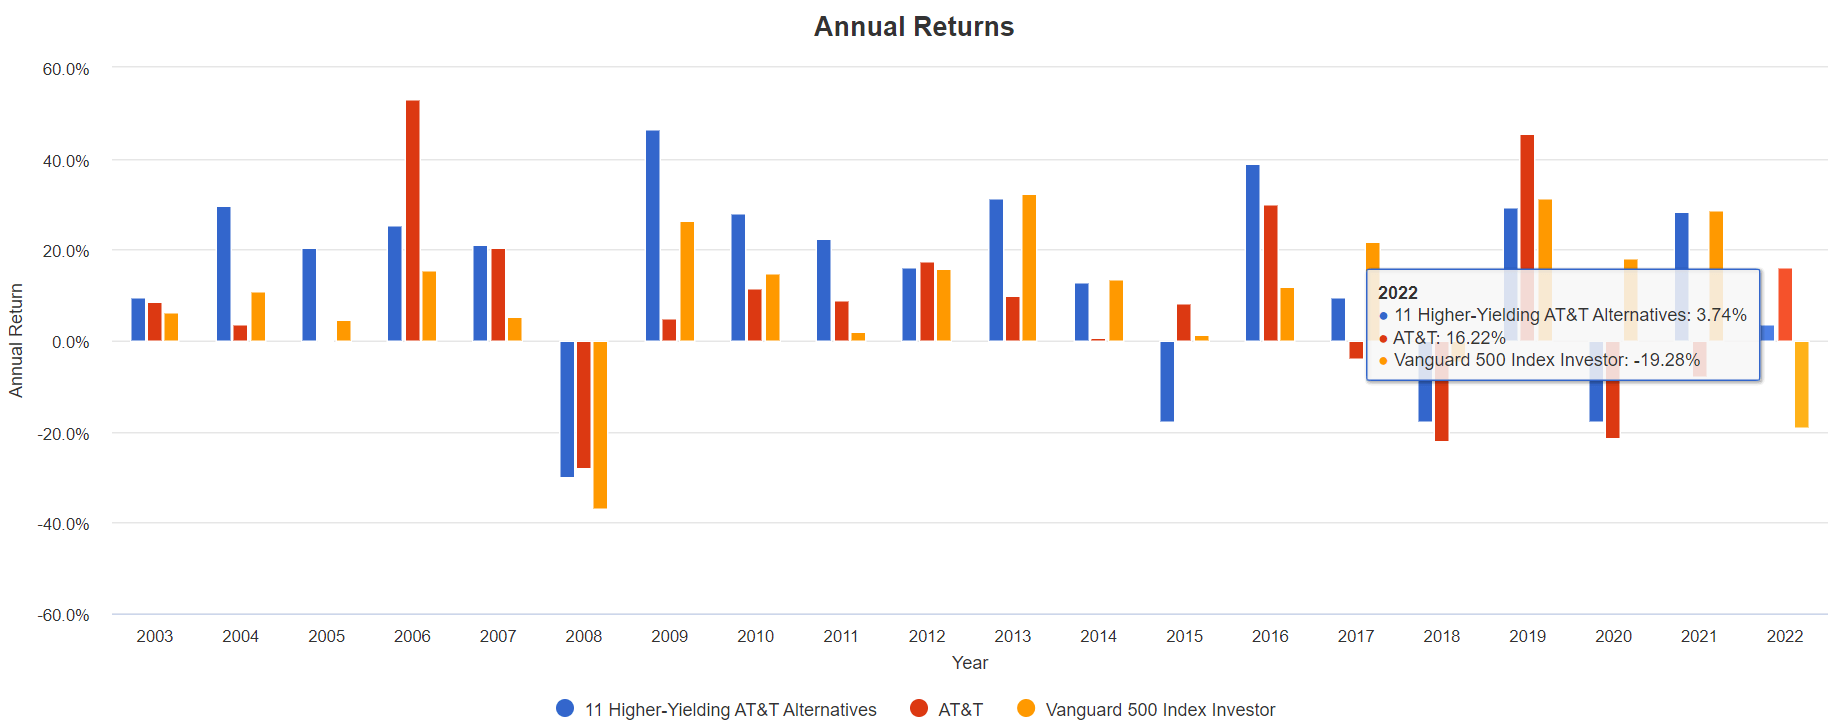
In 2022, when the market is down almost 20%? These 11 high-yield blue-chips are up 4%. Does that mean these blue-chips are bear market-proof?
No company is bear market proof, as you can see from how poorly these companies did in the Pandemic.
(Source: Portfolio Visualizer Premium)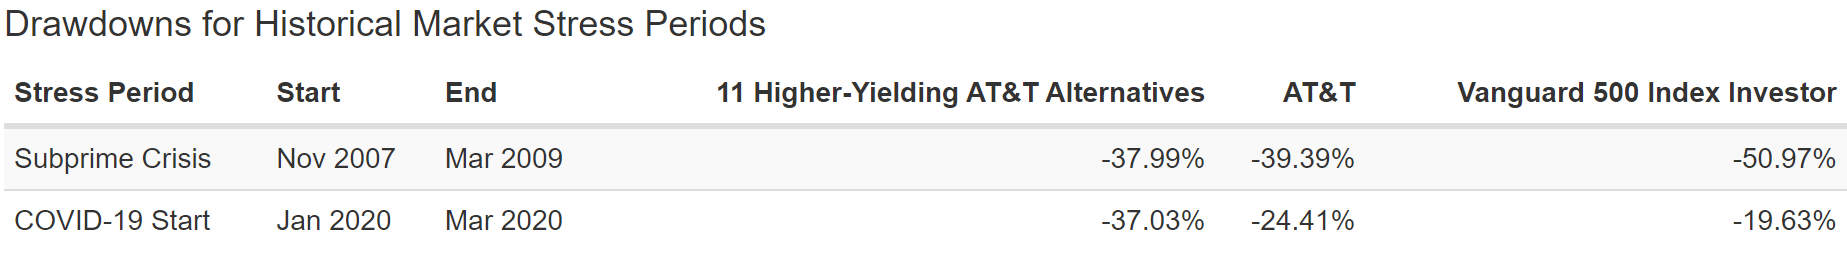
- which is largely why they are still such attractive bargains today
- and yield one of the safest 7% yields in the world
But does that mean these aren’t defensive blue-chips? Not at all.
(Source: Portfolio Visualizer Premium) (Source: Portfolio Visualizer Premium) (Source: Portfolio Visualizer Premium)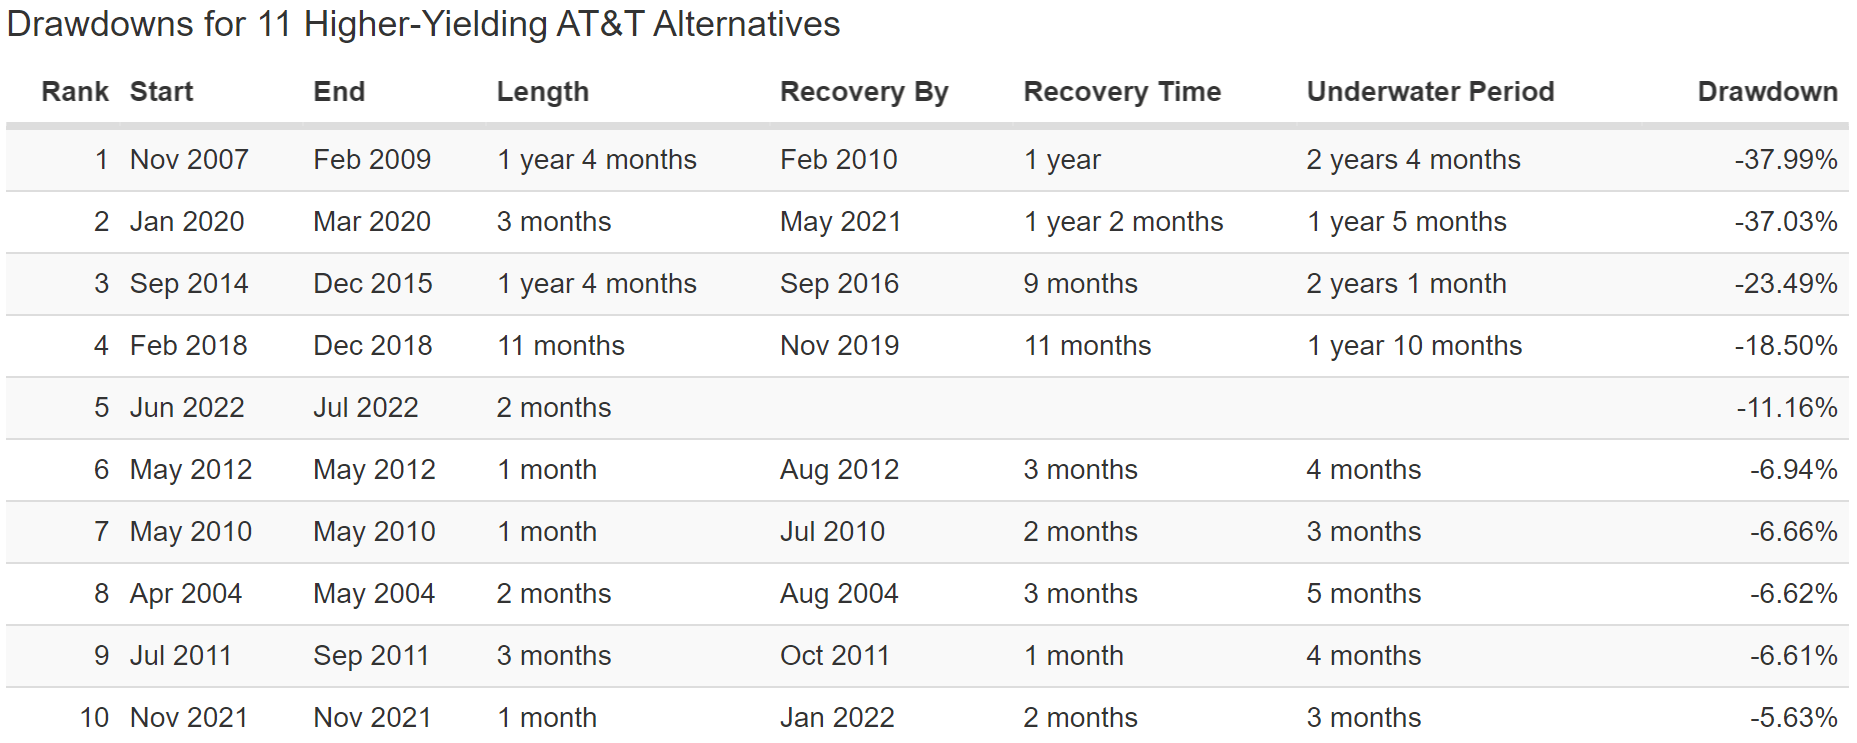
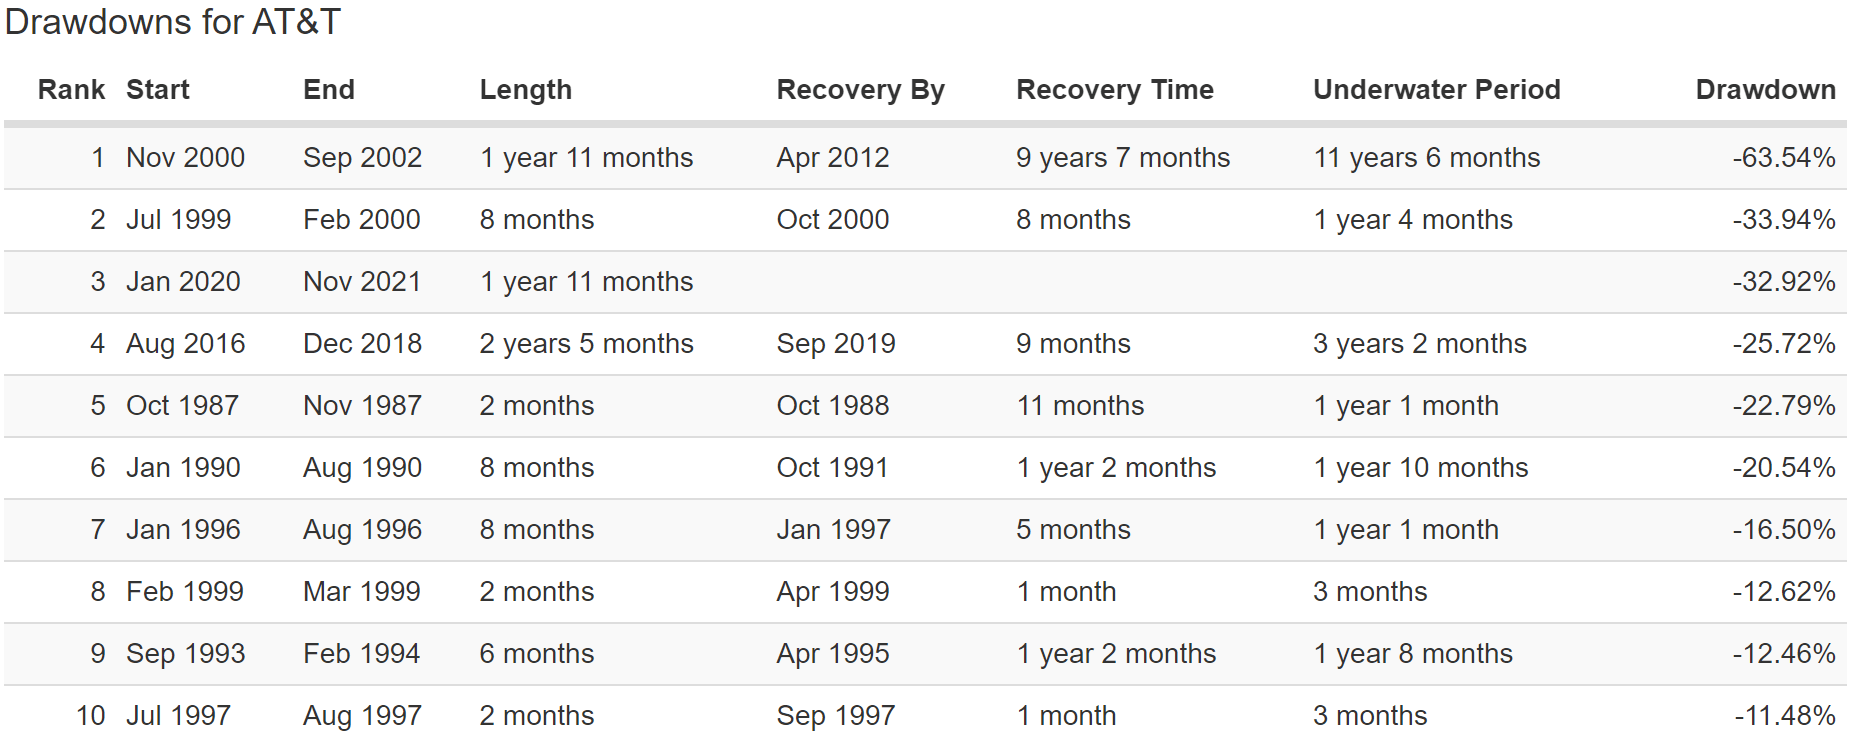
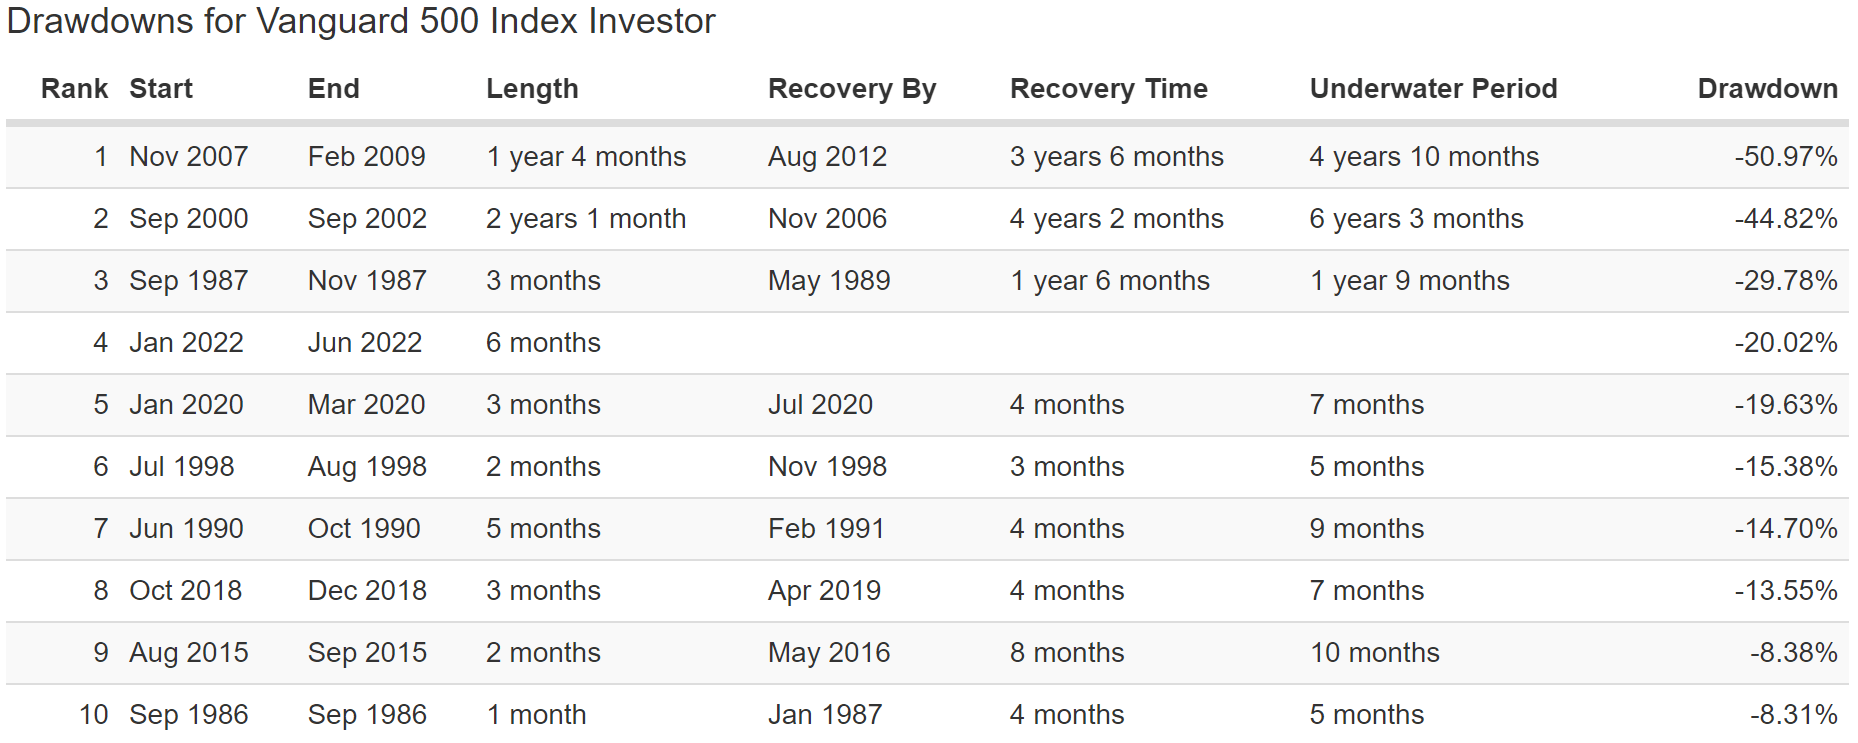
These high-yield blue-chips are currently in an 11% bear market vs 33% for AT&T and 20% for the S&P.
The longest they’ve ever taken to recover record highs after a bear market is 2.5 years, vs 5 years for the S&P 500 and 11.5 years for AT&T.
So higher and much safer yield, stronger returns, smaller declines (usually), and faster bear market recoveries.
And let’s not forget the most important part about high-yield investing, long-term income growth!
High-Yield Dividend Growth Blue-Chips You Can Trust
(Source: Portfolio Visualizer Premium) 2008 was MO’s PM spin-off
If your goal is maximum safe income why would you choose AT&T over these 11 high-yield blue-chip alternatives?
| Portfolio | 2004 Income Per $1,000 Investment | 2021 Income Per $1,000 Investment | Annual Income Growth | Starting Yield |
2021 Yield On Cost |
| S&P 500 | $21 | $77 | 7.94% | 2.1% | 7.7% |
| AT&T | $53 | $222 | 8.79% | 5.3% | 22.2% |
| 11 Higher-Yielding AT&T Alternatives | $83 | $654 | 12.91% | 8.3% | 65.4% |
(Source: Portfolio Visualizer Premium)
They delivered almost 2X the annual income growth of the S&P and AT&T and turned an 8.3% starting yield into a yield on cost of 65% over the last 17 years.
What about future income growth?
| Analyst Consensus Income Growth Forecast | Risk-Adjusted Expected Income Growth | Risk And Tax-Adjusted Expected Income Growth |
Risk, Inflation, And Tax Adjusted Income Growth Consensus |
| 13.1% | 9.2% | 7.8% | 5.3% |
(Source: DK Research Terminal, FactSet)
Analysts expect 13% income growth from these blue-chips in the future, just as they’ve delivered for almost two decades. When adjusted for the risk of it not growing as expected, inflation and taxes is about 5.3% real expected income growth.
Now compare that to what they expect from the S&P 500.
| Time Frame | S&P Inflation-Adjusted Dividend Growth | S&P Inflation-Adjusted Earnings Growth |
| 1871-2021 | 1.6% | 2.1% |
| 1945-2021 | 2.4% | 3.5% |
| 1981-2021 (Modern Falling Rate Era) | 2.8% | 3.8% |
| 2008-2021 (Modern Low Rate Era) | 3.5% | 6.2% |
| FactSet Future Consensus | 2.0% | 5.2% |
(Sources: S&P, FactSet, Multipl.com)
- 1.7% tax and inflation-adjusted S&P consensus income growth
What about a 60/40 retirement portfolio?
- 0.5% consensus inflation, risk, and tax-adjusted income growth.
In other words, these 11 higher-yielding superior AT&T alternatives offer
- almost 4X the market’s yield (and a much safer yield at that)
- 1.33X AT&T’s yield (and a much, much safer yield at that)
- about 3X the S&P’s long-term inflation-adjusted consensus income growth potential
- 11X better long-term inflation-adjusted income growth than a 60/40 retirement portfolio
This is the power of high-yield blue-chip investing done right.
Bottom Line: Don’t Gamble On AT&T’s Turnaround Story When You Can Buy These Higher-Yielding, Far Superior Alternatives Instead
Let me be very clear, AT&T is not a dangerous company that’s likely going to zero. Rating agencies estimate a 92.5% probability AT&T will survive the next three decades.
But what I am saying is that after a careful examination of its fundamentals, I can think of just one group of investors who should own AT&T right now. Index fund investors who own it as part of an ETF or mutual fund.
We all have limited funds, and for new money today there are almost no reasons to buy AT&T over these 11 higher-yielding, much higher quality, much faster growing, and much safer Ultra SWANs.
The Evidence Is Clear: These Are 11 Much Better Alternatives To AT&T
| Metric | Dividend Aristocrats | 11 High-Yield AT&T Alternatives | AT&T | Winner Aristocrats | Winner 11 High-Yield AT&T Alternatives | Winner AT&T |
| Quality | 87% | 88% | 57% | 1 | ||
| Safety | 89% | 90% | 56% | 1 | ||
| Dependability | 84% | 88% | 55% | 1 | ||
| Long-Term Risk Management Industry Percentile | 67% Above-Average | 73% Good | 75% Good | 1 | ||
| Average Credit Rating | A- Stable | BBB+ Stable | BBB Stable | 1 | ||
| Average 30-Year Bankruptcy Risk | 3.01% | 4.09% | 7.50% | 1 | ||
| Average Dividend Growth Streak (Years) | 44.3 | 15.3 | 0 | 1 | ||
| Average Return On Capital | 100% | 478% | 20% | 1 | ||
| Average ROC Industry Percentile | 83% | 87% | 60% | 1 | ||
| 13-Year Median ROC | 89% | 296% | 19% | 1 | ||
| Forward PE | 18.8 | 8.4 | 8.1 | 1 | ||
| Discount To Fair Value | 8.0% | 26.0% | 18.0% | 1 | ||
| DK Rating | Good Buy | Very Strong Buy | Reasonable Buy | 1 | ||
| Yield | 2.6% | 7.0% | 5.4% | 1 | ||
| LT Growth Consensus | 8.6% | 6.6% | 3.4% | 1 | ||
| Total Return Potential | 11.2% | 13.6% | 8.8% | 1 | ||
| Risk-Adjusted Expected Return | 7.6% | 9.1% | 5.7% | 1 | ||
| Inflation & Risk-Adjusted Expected Return | 5.1% | 6.7% | 3.2% | 1 | ||
| Years To Double | 14.02 | 10.80 | 22.30 | 1 | ||
| Total | 4 | 13 | 2 |
(Source: DK Zen Research Terminal)
Don’t get me wrong, I’m not saying that you have to buy all of these companies.
This article is about providing 11 higher-yielding and far superior quality alternatives to AT&T and that’s exactly what MMP, MO, LGGNY, EPD, BTI, OKE, ALIZY, ENB, MFC, PBA, and BNS represent.
Some investors absolutely detest K1 tax forms, and if that describes you then ignore MMP and EPD.
Some investors just can’t stand dividend tax withholdings and extra complexity at tax time, and if that’s the case then ignore PBA, BNS, and ENB.
Some investors avoid tobacco for personal ethical reasons, and in that case MO and BTI are not for you.
The point is that any one of these high-yield blue-chips is a superior alternative to AT&T.
- higher yield
- faster growth
- a safer dividend
- faster growing dividends
- credit ratings as good or better (in some cases much better)
- much higher quality and dependability
- higher long-term return potential
- superior long-term returns
When you have limited capital you need to be reasonable and prudent with where you invest it.
Can AT&T make a good investment from here? That depends on whether the turnaround succeeds and the company delivers on its expected growth.
- 8.8% long-term consensus return potential is in-line with its historical returns
Could AT&T make a potentially fantastic short-term investment? Sure, because a return to fair value could mean 20% annual returns for the next 2.5 years.
- 24% from these higher-yielding alternatives
But whether you are shooting for huge short-term upside or life-changing long-term wealth and income compounding by earning thousands of percent over decades, one thing is clear.
These 11 higher-yielding blue-chips are far superior alternatives to AT&T today.
Be the first to comment