

peshkov
It’s been a rather frightening start to the year for many investors.
Daily Shot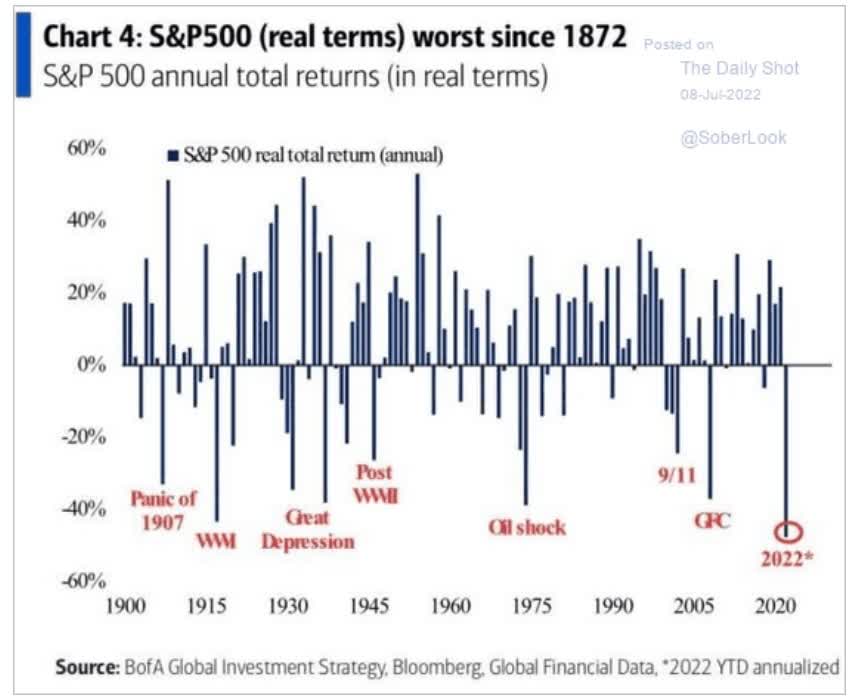
According to Bank of America, the annualized, inflation-adjusted returns of the stock market during the first half were the worst in 150 years.
| Time Frame | Historically Average Bear Market Bottom |
| Non-Recessionary Bear Markets Since 1965 | -21% (Achieved May 20th) |
| Median Recessionary Bear Market Since WWII | -24% (Citigroup base case with a mild recession) June 16th |
| Non-Recessionary Bear Markets Since 1928 | -26% (Goldman Sachs base case with a mild recession) |
| Average Bear Markets Since WWII | -30% (Morgan Stanley base case, no recession) |
| Recessionary Bear Markets Since 1965 | -36% (Bank of America recessionary base case) |
| All 140 Bear Markets Since 1792 | -37% |
| Average Recessionary Bear Market Since 1928 |
-40% (Deutsche Bank, Bridgewater, SocGen Severe Recessionary base case, Morgan Stanley Recessionary Base Case) |
|
(Sources: Ben Carlson, Bank of America, Oxford Economics, Goldman Sachs) |
And if we get a recession in 2023, which is looking more likely, then many blue-chip analyst firms think stocks could fall another 35%, to a 40% peak decline in the S&P 500.
The good news? There is still a decent chance that we can avoid a recession.
- Morgan Stanley now puts the risk of a recession within a year at 36%
- Goldman 34%
- Moody’s 40%
However, Deutsche Bank and Bank of America now think a recession is likely, though very mild and short.
- BAC thinks it will begin in Q4
- Deutsche Bank Q3 2023
- BAC expects -0.2% US GDP growth in 2023
- Deutsche Bank -0.5% US GDP growth in 2023
For context, the mildest recession in US history was 2001’s -0.4%, which means that this recession, which both BAC and Deutsche Bank expect to last 6 months, could be very mild, possibly the mildest in history.
How mild? Moody’s, another blue-chip economist team, expects positive jobs growth of over 175K per month to continue for the next year. If we get a recession, it could very well be a “jobful” recession with very little economic pain for Main Street.
Daily Shot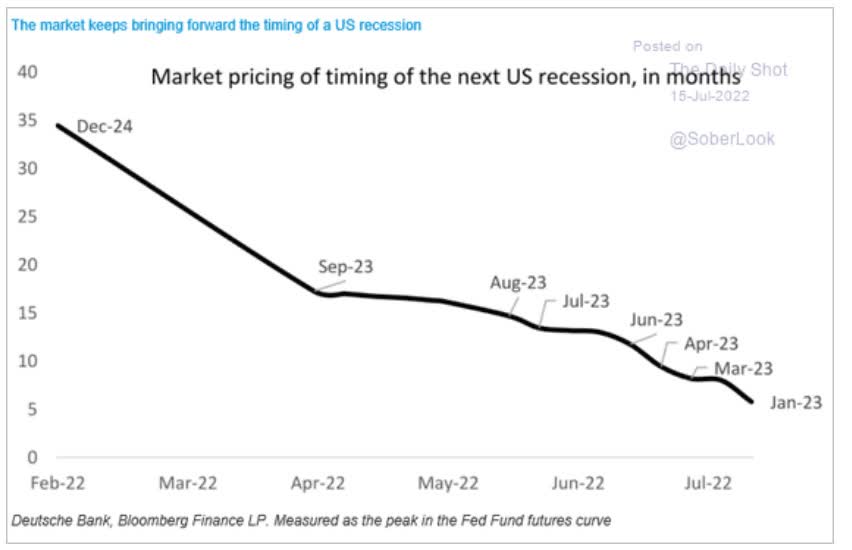
According to Deutsche Bank, the bond market is also expecting a mild recession to begin around January 2023, based on the inversion of several yield curves.
That agrees with the economic data, which has been weakening at a rapid pace for several weeks.
David Rice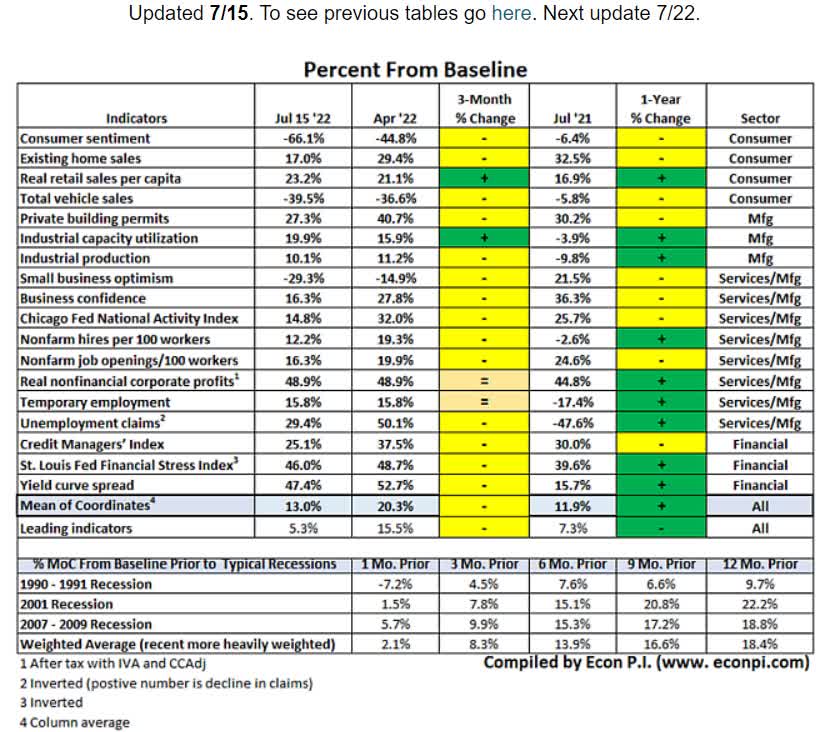
Based on the fact that the average of 18 economic metrics is now 13% above historical baseline (since 1990) and leading indicators are just 5.3% above baseline, a potential recession could begin in about five months.
- in December
- agreeing with BAC
- and the bond market
But even if we avoid a recession entirely, as most blue-chip economists still think is the most likely outcome, that doesn’t necessarily mean the stock market is out of the woods yet.
Counter-trend rally may continue, but make no mistake, we don’t believe this bear market is over, even if we avoid a recession,” he wrote in a note on Monday…
The combination of continued labor, raw material, inventory and transport cost pressures coupled with decelerating demand poses a risk to margins that is not reflected in consensus estimates,” Wilson said, adding that even if estimates for revenue growth remain static, a return to pre-Covid net margin levels implied a 10% hit to forward earnings-per-share.” – Bloomberg (emphasis added)
Morgan Stanley has long been forecasting the market would fall to 3,400 to 3,500 on the S&P 500 (about -30% from its peak and 10% lower than now), not due to recession but because earnings estimates are 10% too high.
In the event of a mild recession, they think earnings decline 20% and take the market down to about 3,000.
- approximately 15X trough forward earnings
- due to the market’s typical 13 to 15X trough forward PE in bear market bottoms
Morgan Stanley thinks that the S&P will still be about 3,800 by July 1st, 2023, meaning no sharp V-shaped recovery.
- but a historically normal and protracted bear market that takes about 2 years to recover new highs after bottoming
It might be tempting to sell all your stocks and just “wait for the dust to settle,”, especially with so many blue-chip economist/analyst teams forecasting further declines.
- the blue-chip consensus are the 16 most accurate economist teams as tracked by MarketWatch in terms of accuracy of forecasts
- it includes Goldman Sachs, JPMorgan, Wells Fargo, Morgan Stanley, Bank of America, Societe Generale, Citigroup, and Deutsche Bank
However, selling stocks after a historically awful bear market is almost always a mistake.
Charlie Bilello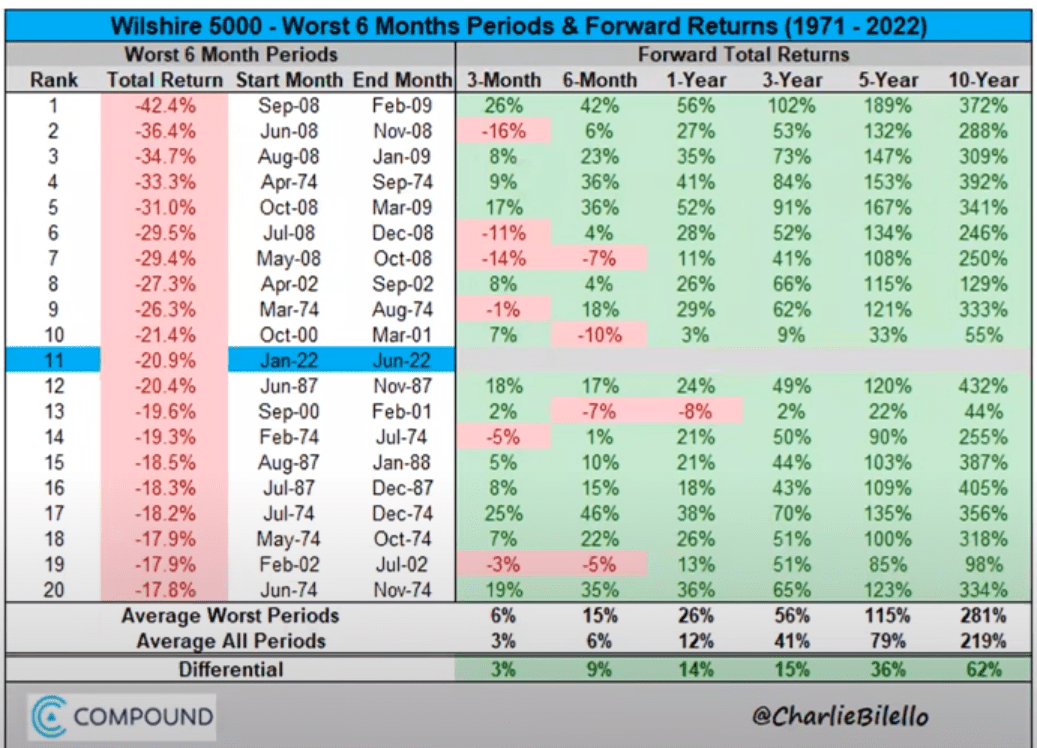
For example, looking at the 20 worst first half of the year for US stocks, as represented by the Wilshire 5,000, we can see that forward returns are significantly higher in the future after a terrible first half. How much higher?
On average:
- 14% higher over the next 12 months
- 4.8% higher annual returns over the next 3 years
- 6.3% higher annual returns over the next five years
- 4.9% higher annual returns over the next decade
In fact, the average three, five, and 10-year total returns following such horrific six-month periods are 56%, 115%, and 281%, respectively.
And most of these gains are front-loaded early in the eventual bull market that begins after the stock market bottoms and no one can accurately or consistently predict exactly when that is.
In other words, no one rings a bell at either the top or bottom of market cycles.
“I never buy at the bottom and I always sell too soon.” – Baron Rothschild
“Don’t try to buy at the bottom and sell at the top. This can’t be done – except by liars.” – Bernard Baruch
So how can you patiently wait out this bear market, whether it is almost over or still has several months and legs lower before finally ending?
This is where the power of high-yield, defensive dividend aristocrats can help you remain calm, rational, disciplined, patient, and ultimately potentially retire in safety and splendor.
How To Quickly And Easily Find The Best Defensive High-Yield Dividend Aristocrats
Defensive sectors are recession-resistant; thus, earnings tend to fall less during recessions.
Daily Shot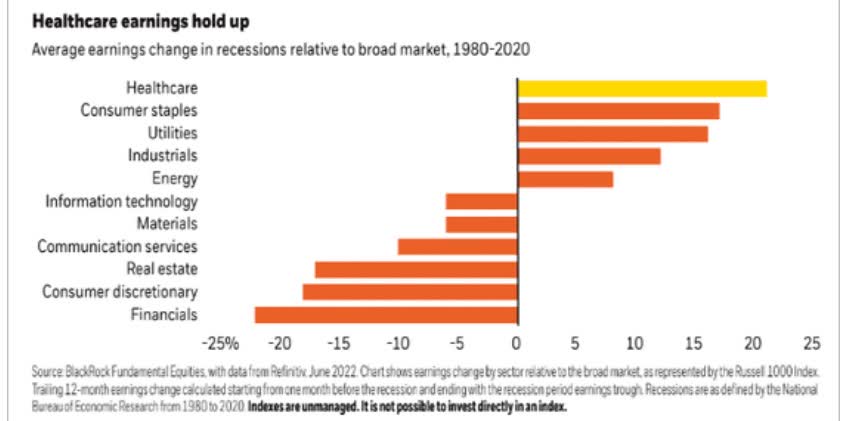
It might surprise you to learn that since 1980 industrials and energy have been relatively defensive, though healthcare, consumer staples, and utilities are by far the most likely sectors to avoid steep earnings declines.
This is why they also tend to be the best performing sectors during recessions, during what’s called “bull steepening” interest rate regimes.
Reuters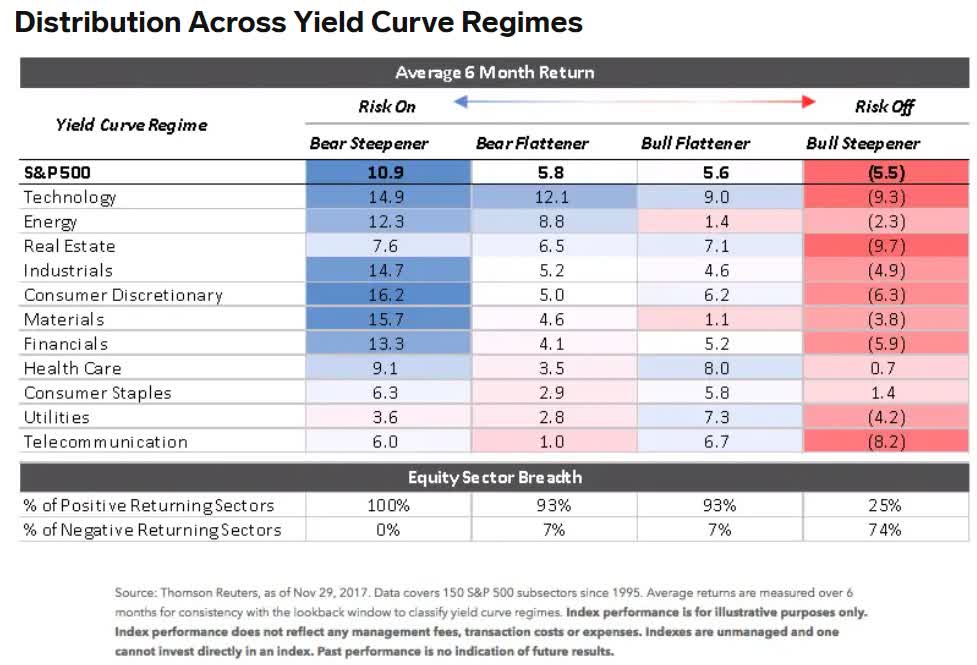
In fact, since 1995, consumer staples and healthcare are the only sectors that generally go up, a modest amount, during recessions.
Utilities, energy, and industrials also tend to be relatively defensive because their earnings fall less than other sectors.
Defensive sectors, in addition to having smaller than normal declines in earnings during a recession, are famous for being low volatility. Across the entire economic cycle, consumer staples, healthcare, and utilities are the best-known defensive sectors.
Ok, so now that we understand why these three sectors are great potential ones to target ahead of a mild recession (or even a severe one in a worst-case scenario), what about the dividend aristocrats?
According to research from S&P Global, since 1990, dividend aristocrats tend to fall less than the S&P 500 during bear markets 69% of the time.
Aristocrats, S&P companies with 25+ year dividend growth streaks, are famous for being the bluest of blue-chips and tend to have lower volatility as a result.
- average 15-year annual volatility of 23% vs. 28% for standalone companies
Defensive aristocrats in the consumer staples, healthcare, and utility sectors average 21% average annual volatility.
- 25% average lower volatility than most companies
So let me show you how I used the Dividend Kings Zen Research Terminal to quickly and easily find the best high-yield defensive dividend aristocrats for a potential recession that’s coming in the next few months.
We’ve spent three years building this tool that runs off the Dividend Kings Master 500 watchlist.
The DK 500 Master List includes:
- every dividend aristocrat (S&P companies with 25+ year dividend growth streaks)
- every dividend champion (every company, including foreign, with 25+ year dividend growth streaks)
- every dividend king (every company with 50+ year dividend growth streaks)
- every foreign aristocrat (every company with 20+ year dividend growth streaks)
- every Ultra SWAN (wide moat aristocrats, as close to perfect quality companies as exist)
- 40 of possibly the world’s best growth stocks
Here is the very simple screen I used to find these high-yield defensive aristocrats in two minutes.
- dividend champions list (including any company with a 25+ year dividend growth streak, including foreign ones)
- good and reasonable buys (nothing overvalued)
- utility, consumer staples, and healthcare sectors
- 3+% dividend yield
- 8+% long-term consensus return potential (my rule of thumb for minimum returns appropriate from defensive sectors)
Total time: 2 minutes
11 High-Yield Dividend Aristocrats Perfect For The Coming Recession
Dividend Kings Zen Research Terminal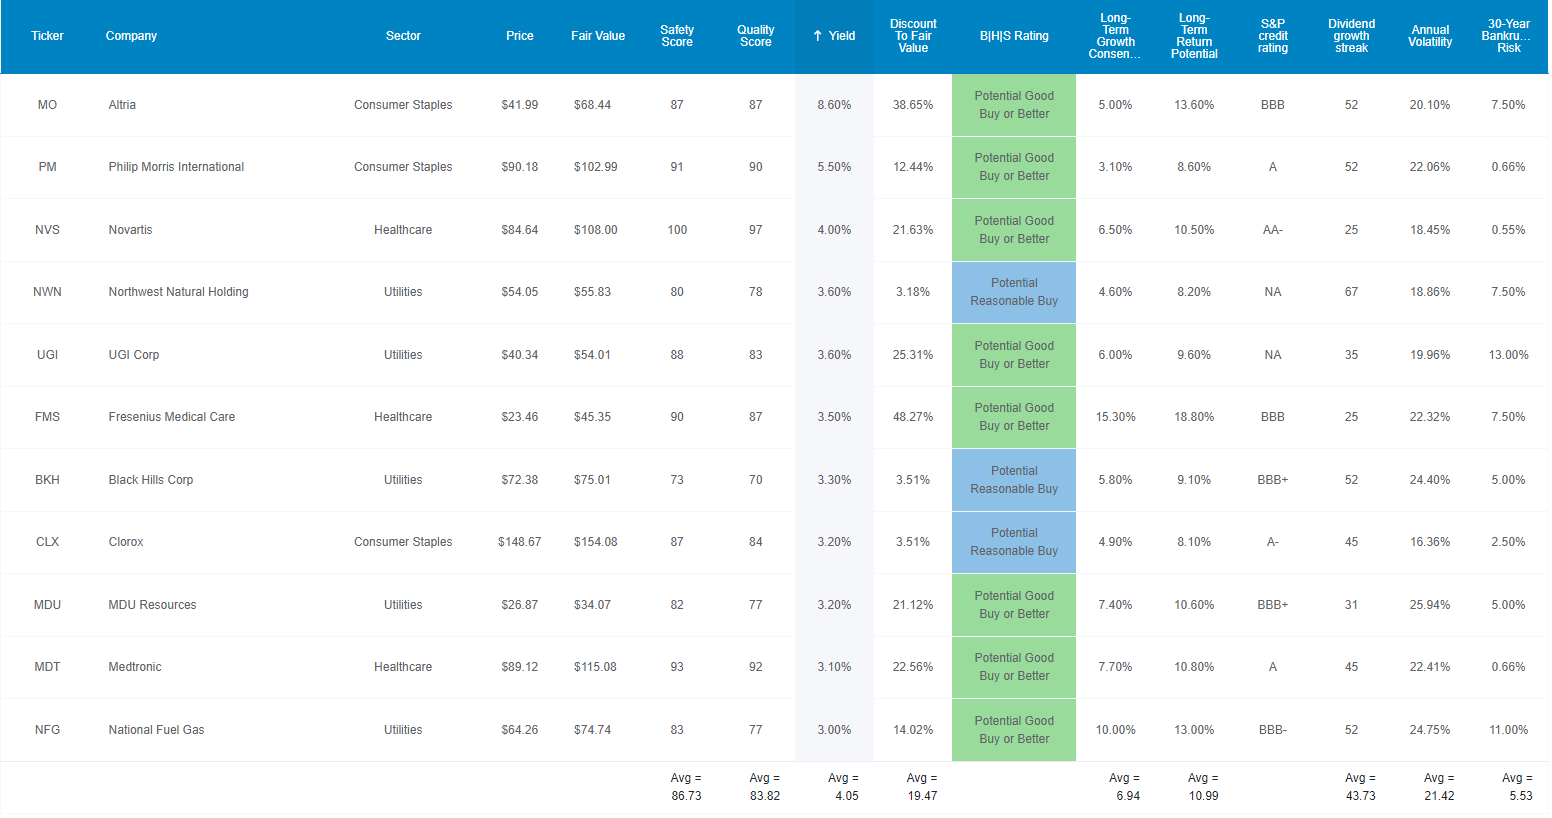
I’ve linked to articles providing a deeper look at each company’s investment thesis, growth outlook, risk profile, valuation, and total return potential.
FAST Graphs Upfront
Altria 2024 Consensus Total Return Potential
(Source: FAST Graphs, FactSet)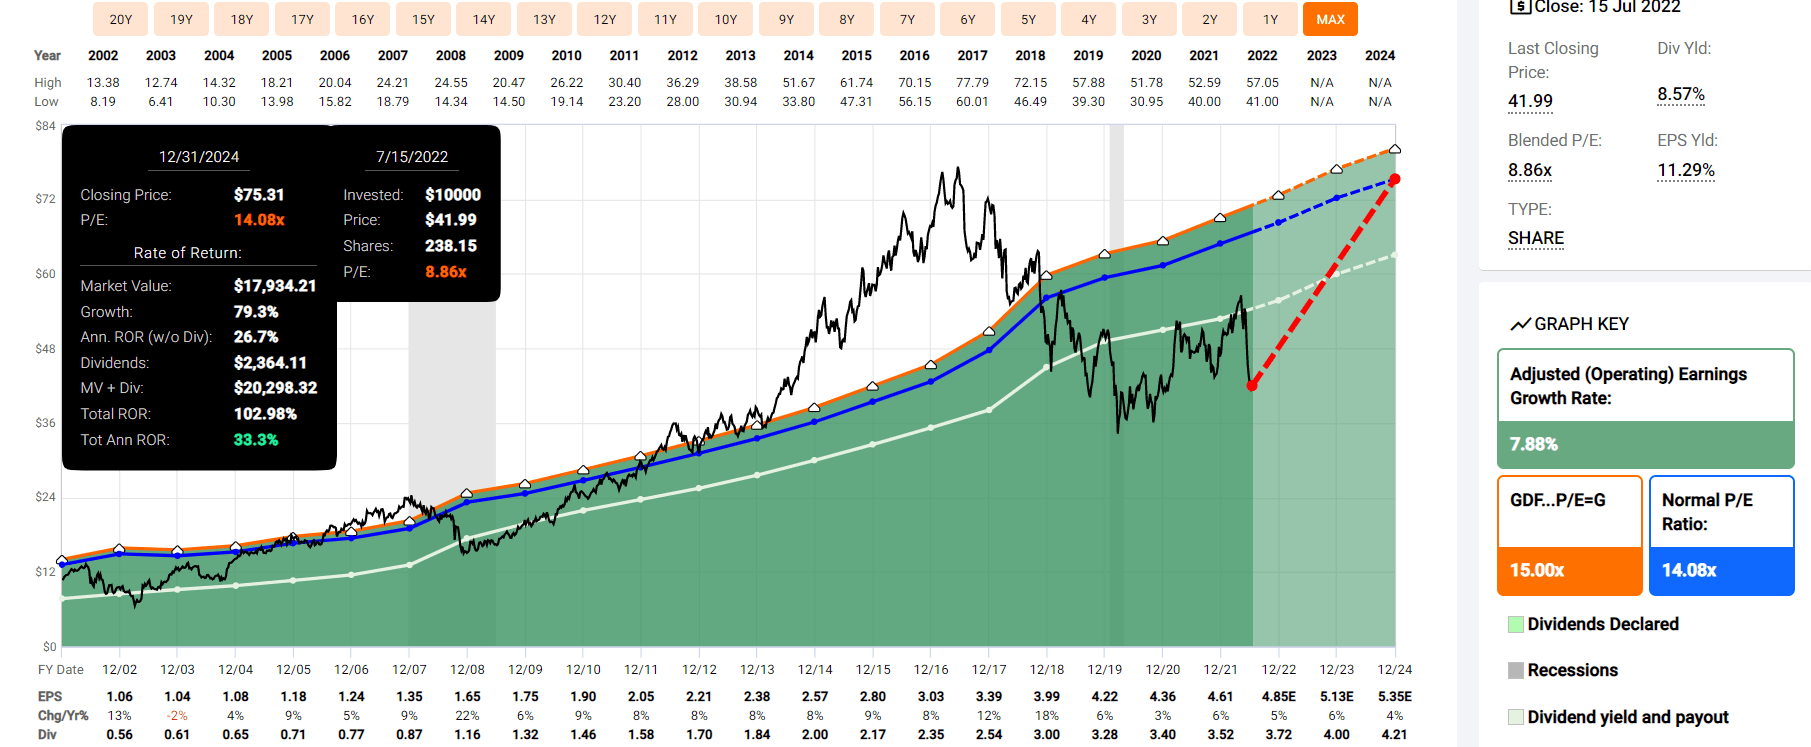
Philip Morris International 2024 Consensus Total Return Potential
(Source: FAST Graphs, FactSet)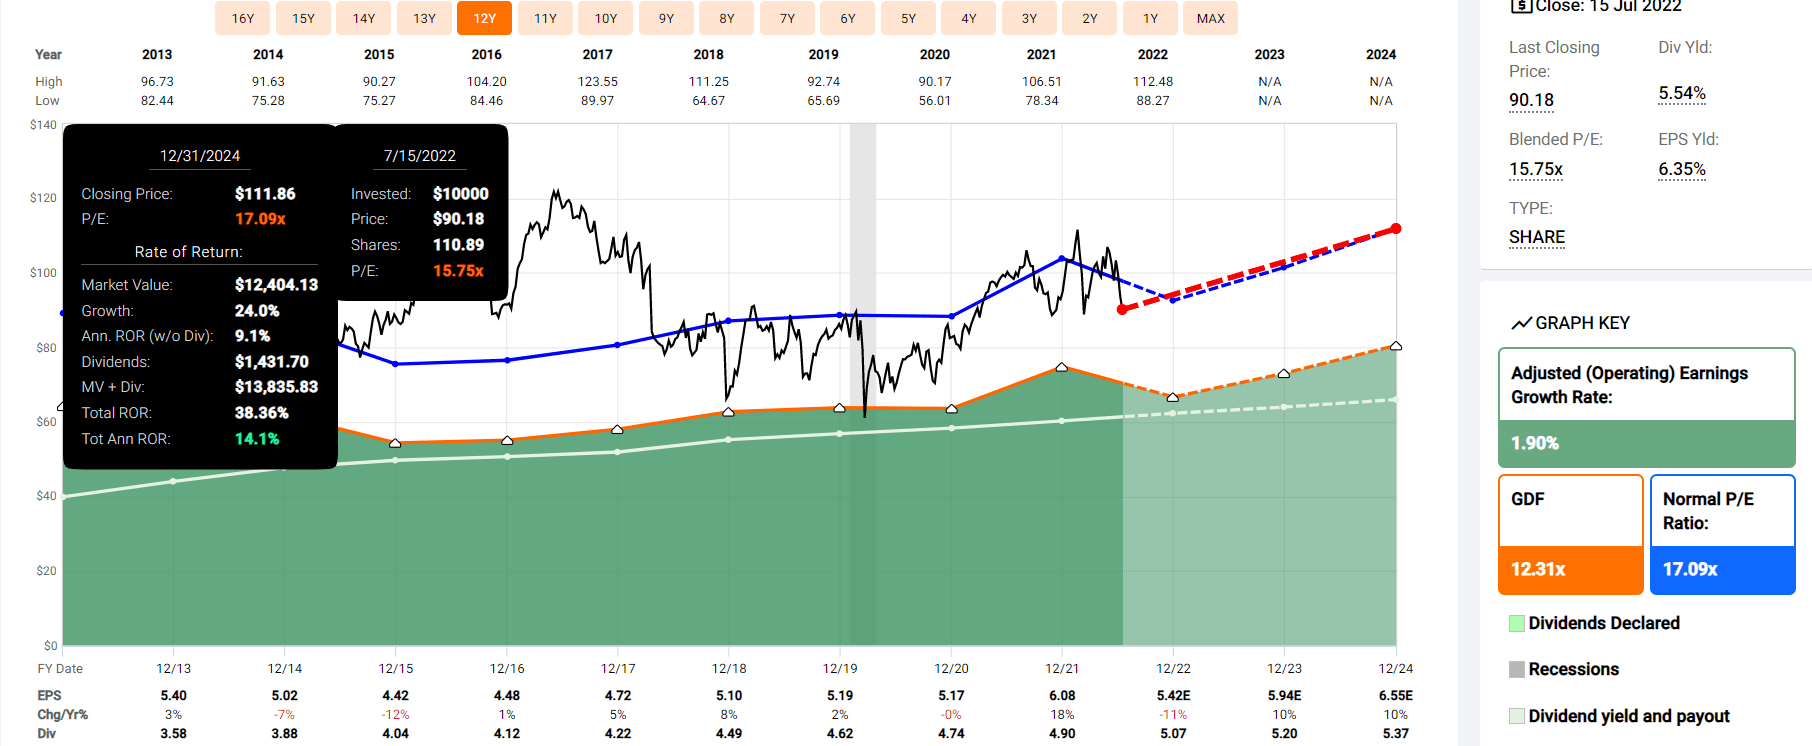
Novartis 2024 Consensus Total Return Potential
(Source: FAST Graphs, FactSet)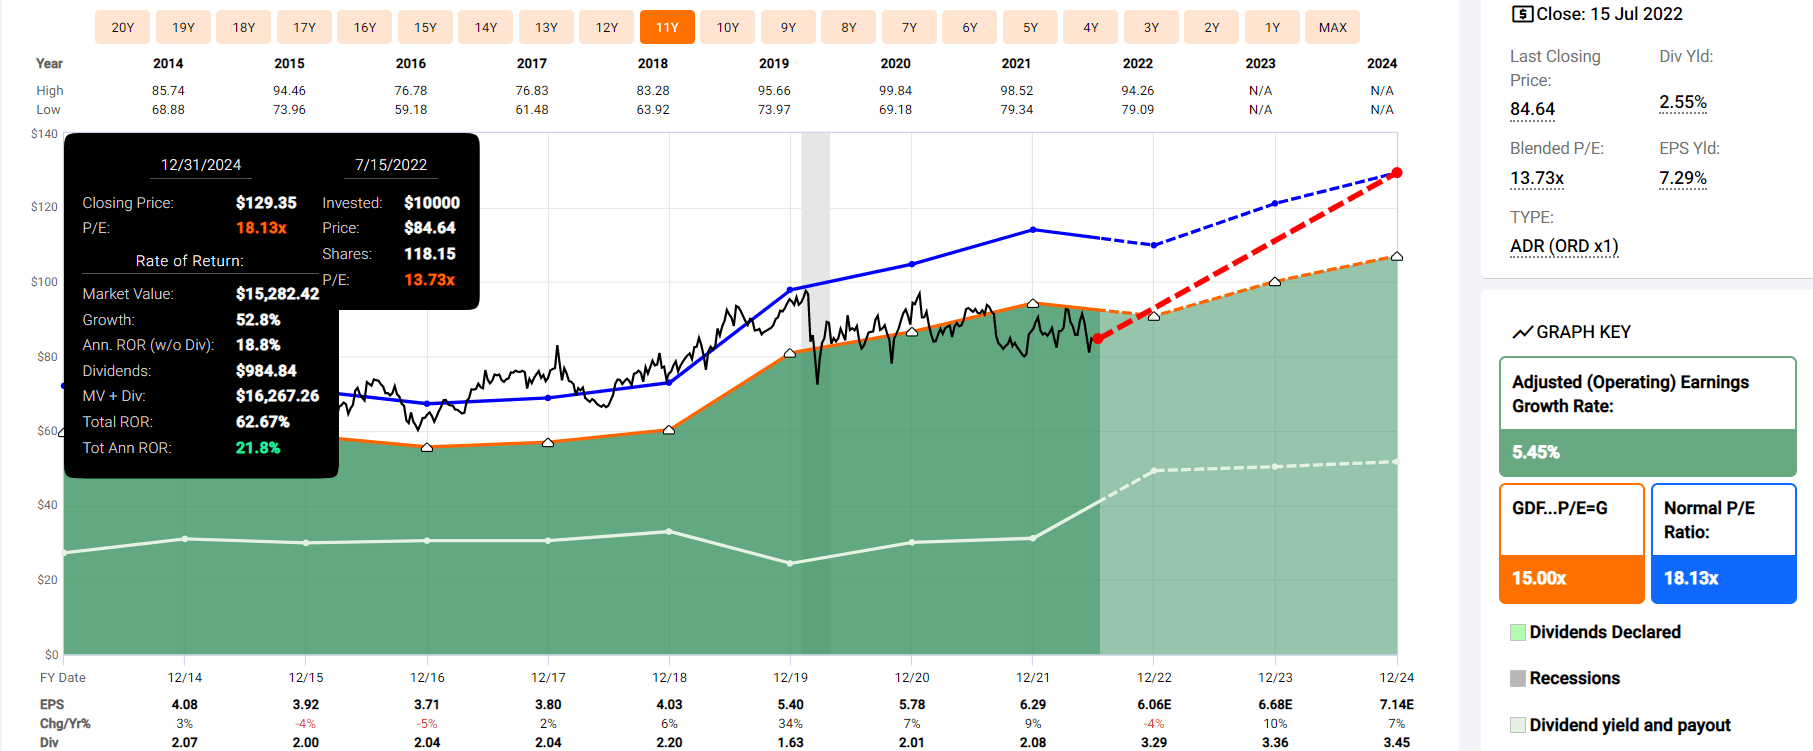
Northwest Natural Holding 2024 Consensus Total Return Potential
(Source: FAST Graphs, FactSet)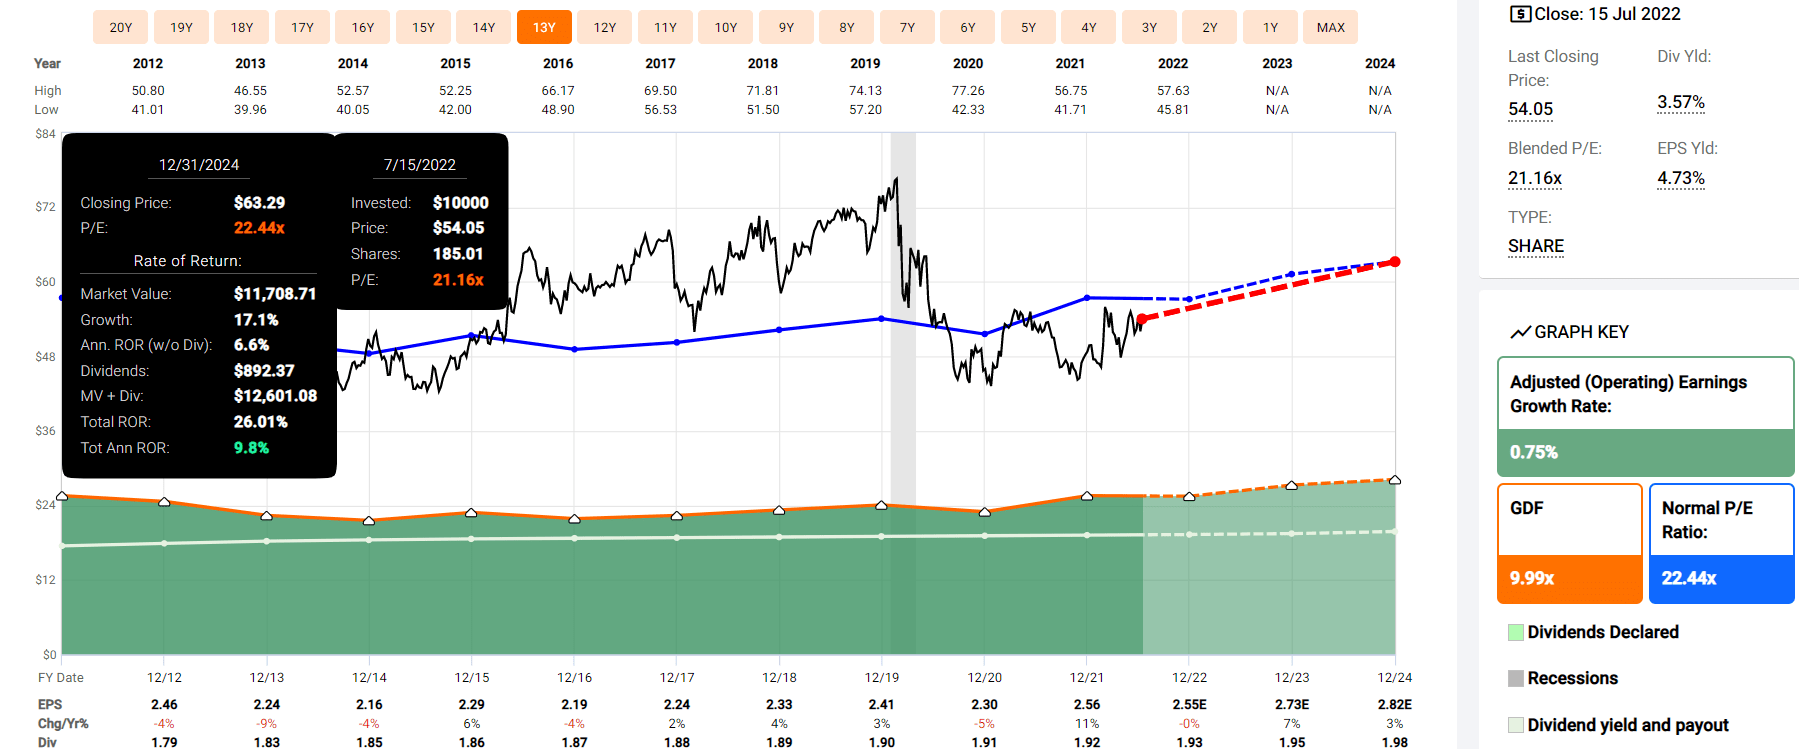
UGI Corp. 2024 Consensus Total Return Potential
(Source: FAST Graphs, FactSet)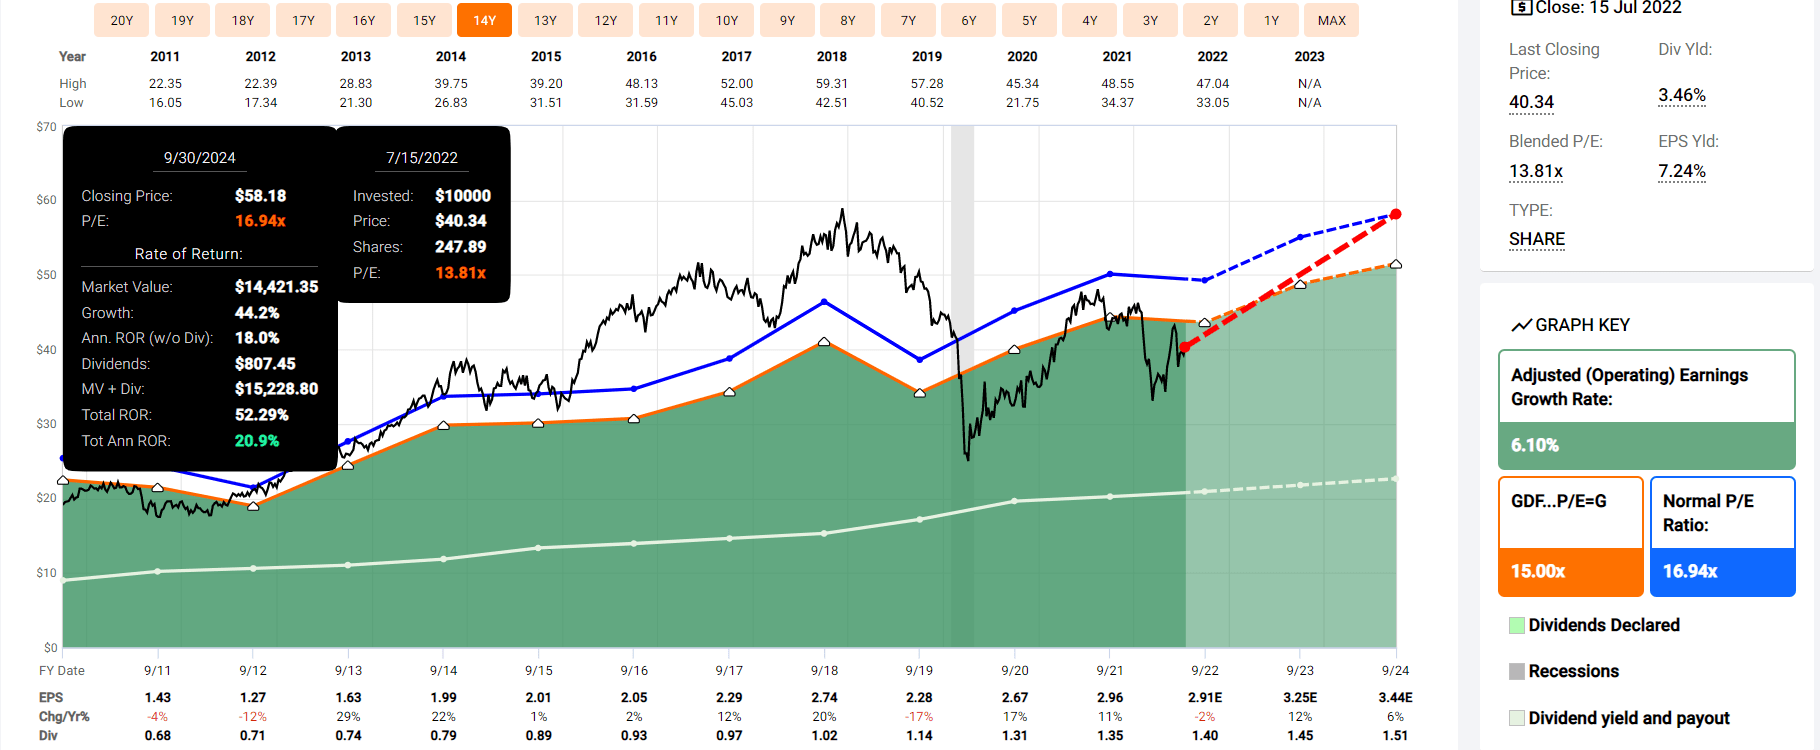
Fresenius Medical Care 2024 Consensus Total Return Potential
(Source: FAST Graphs, FactSet)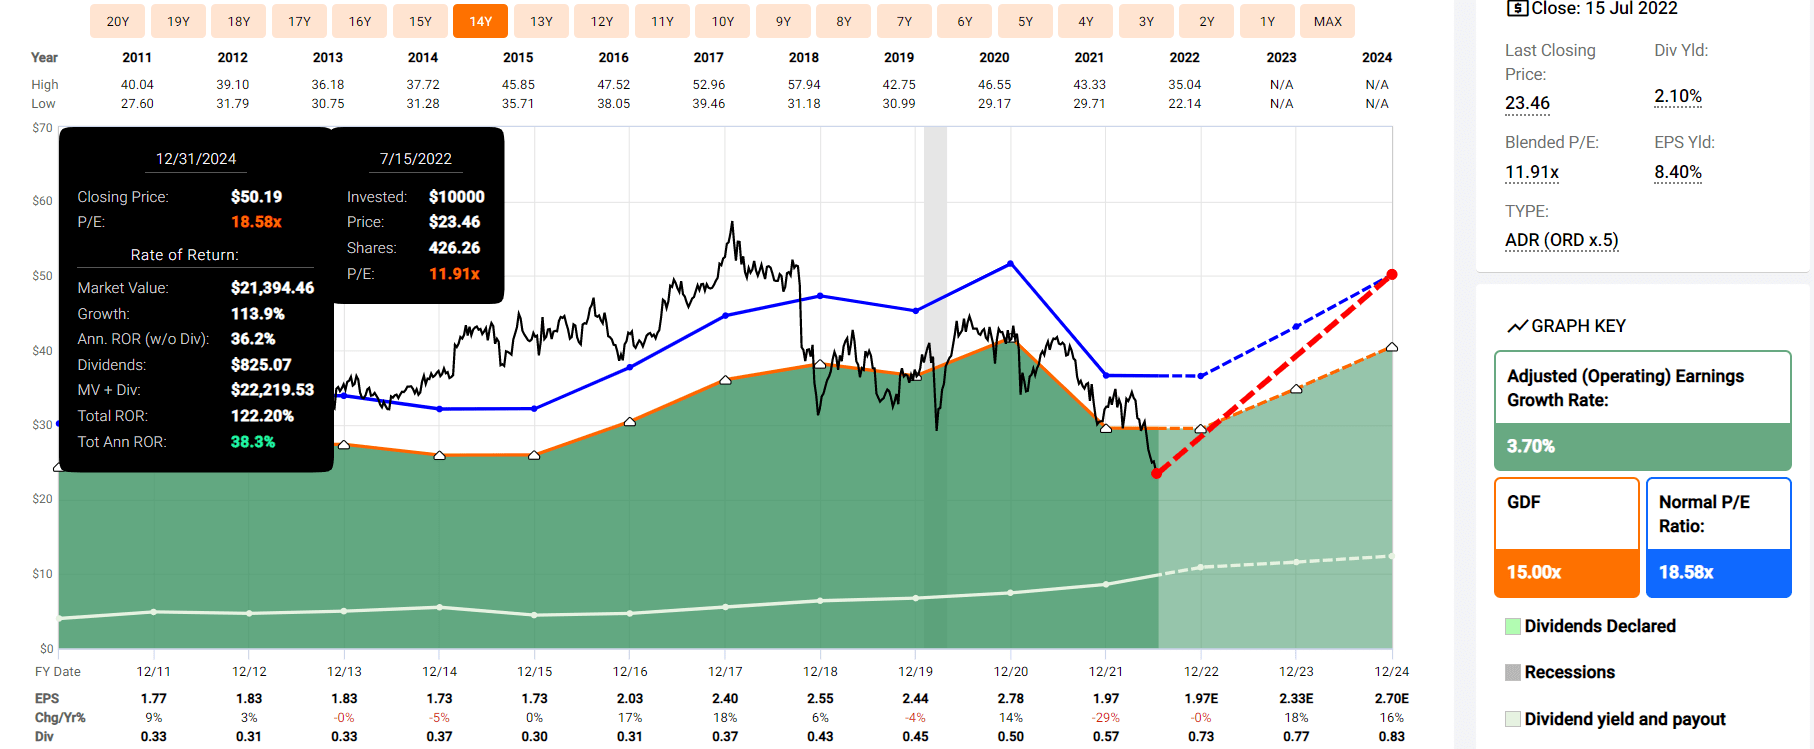
Black Hills Corp. 2024 Consensus Total Return Potential
(Source: FAST Graphs, FactSet)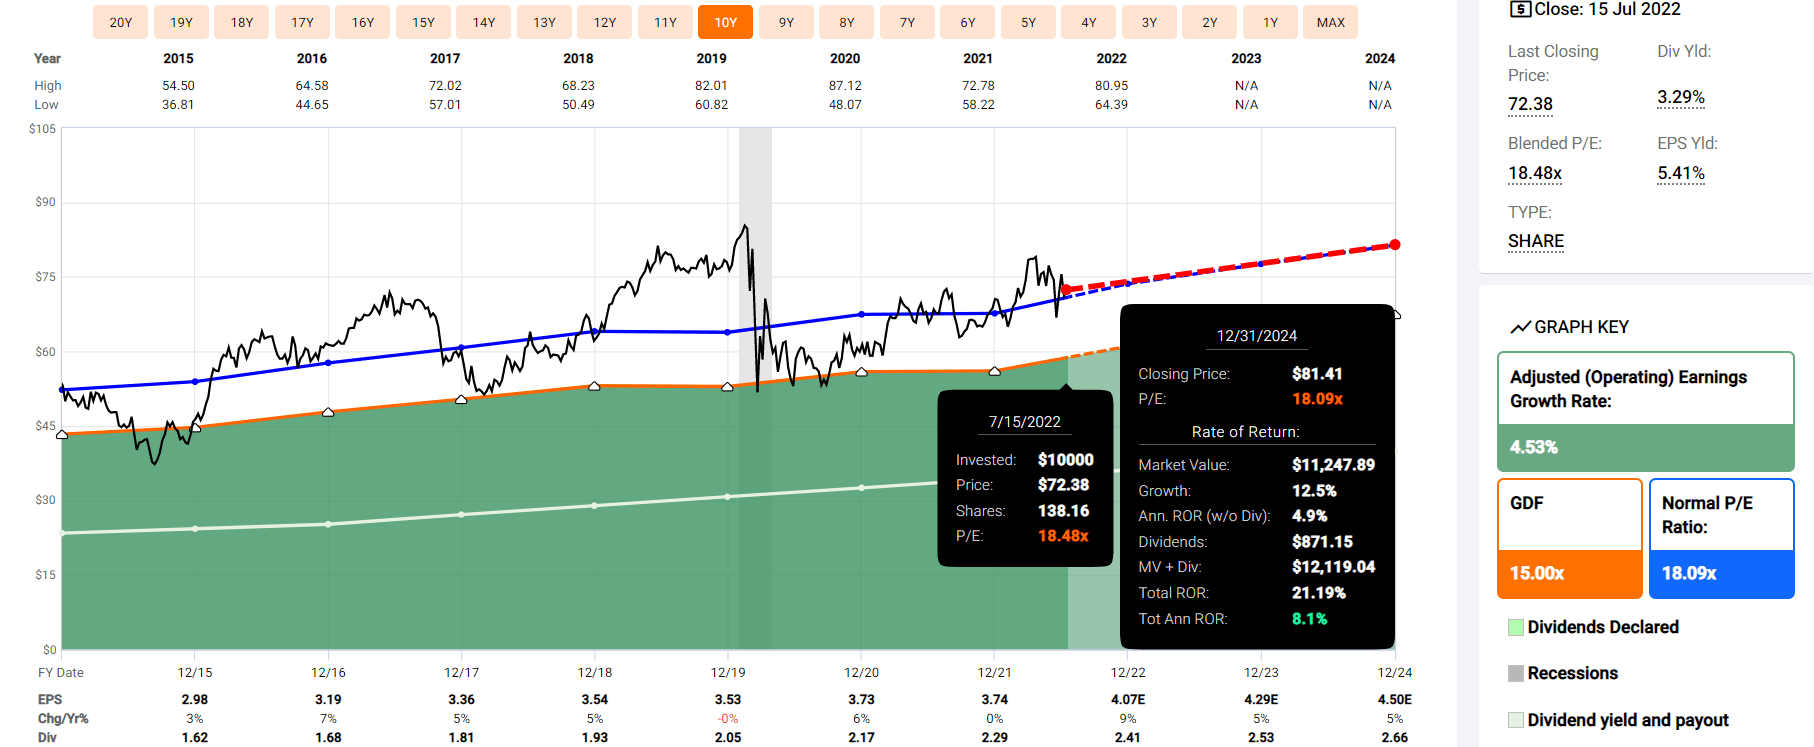
Clorox 2024 Consensus Total Return Potential
(Source: FAST Graphs, FactSet)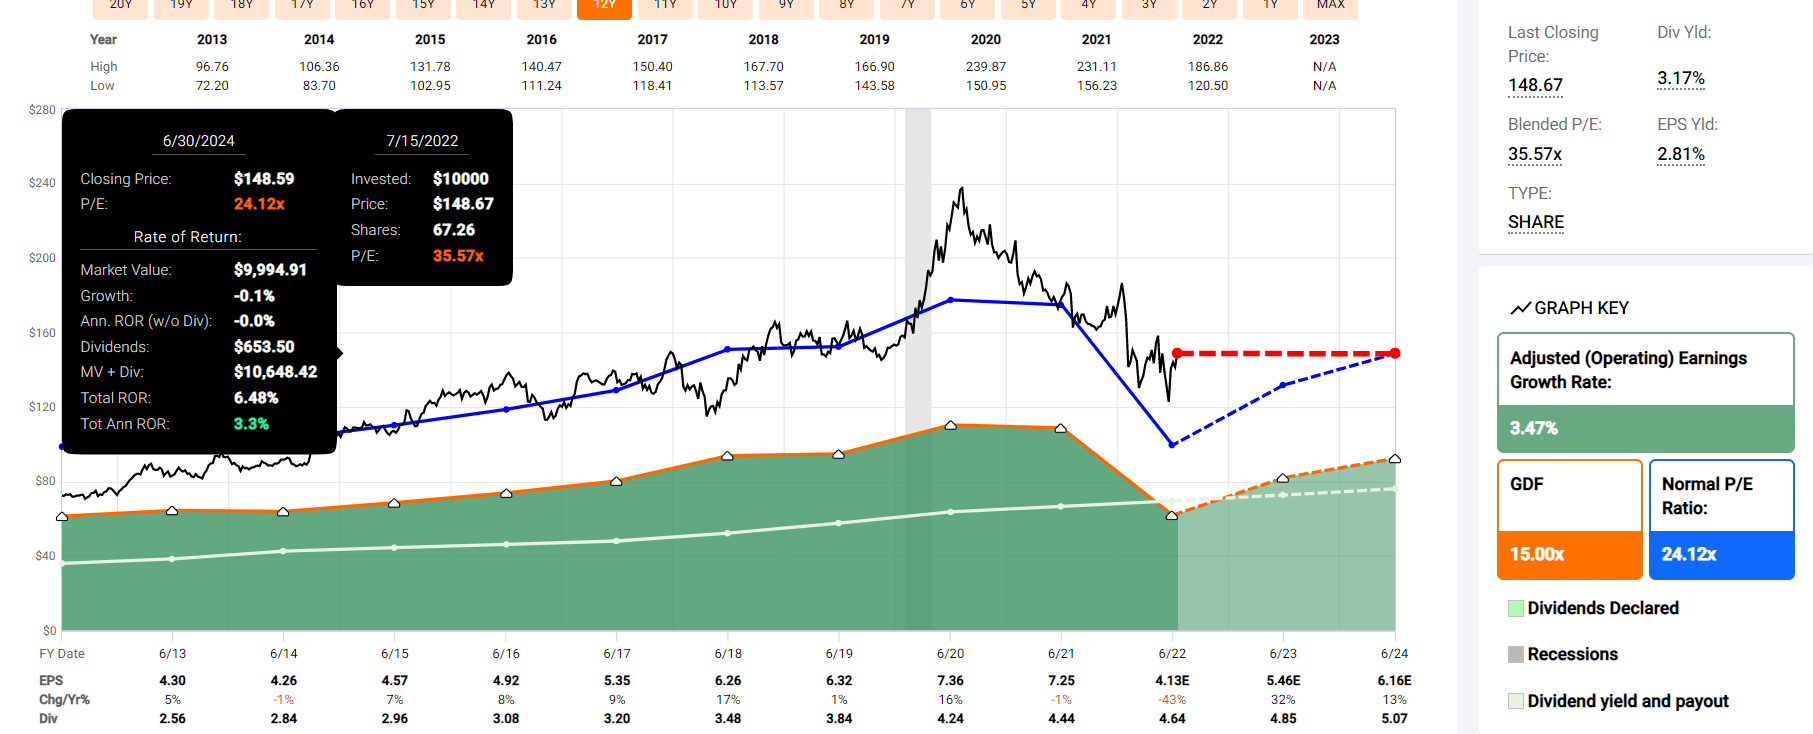
MDU Resources 2024 Consensus Total Return Potential
(Source: FAST Graphs, FactSet)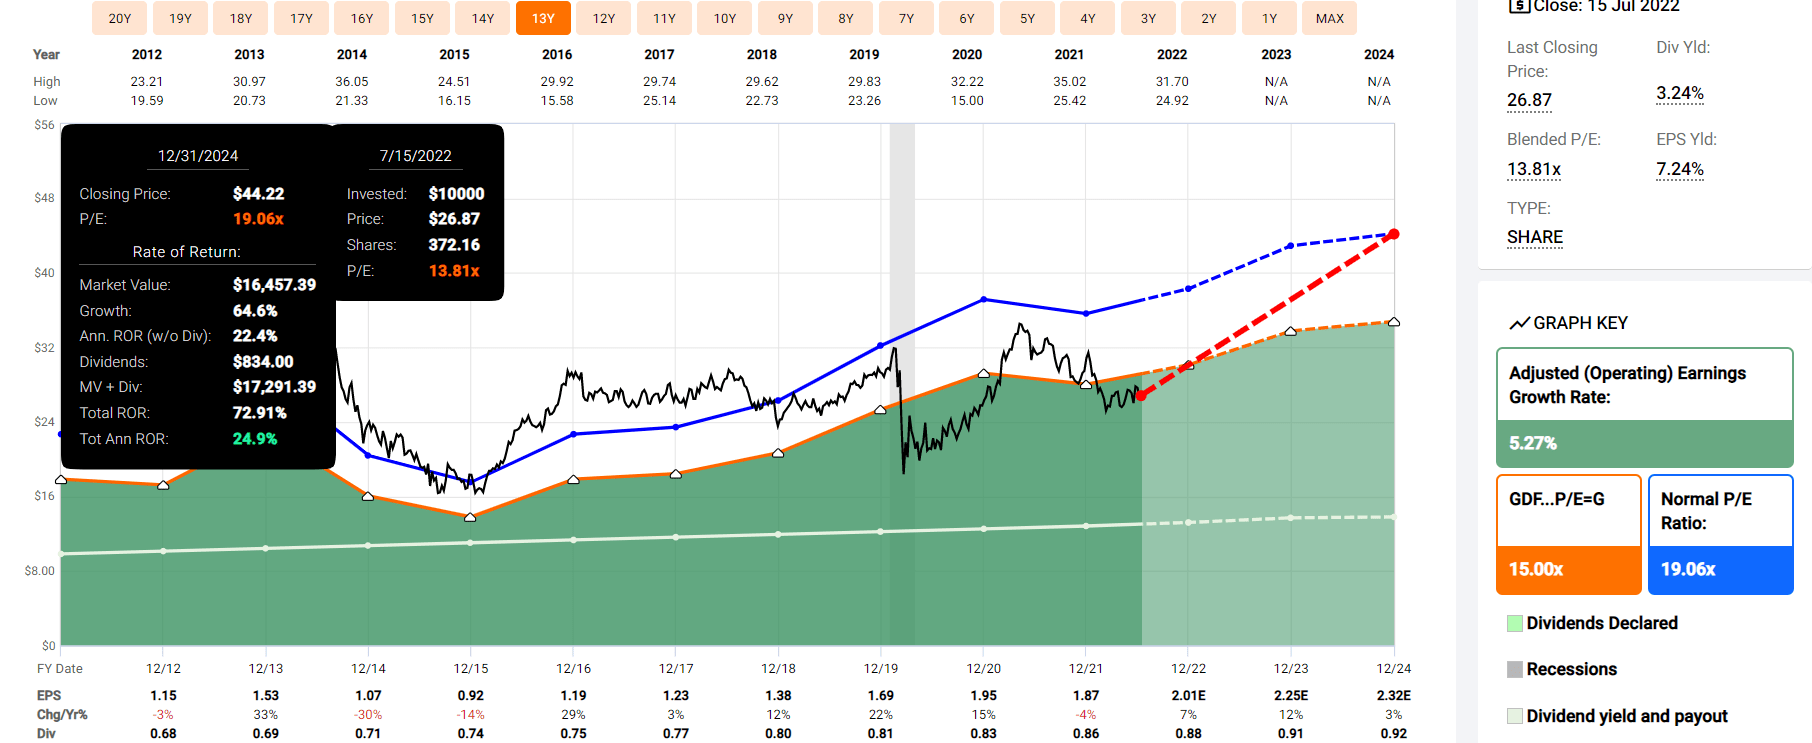
Medtronic 2024 Consensus Total Return Potential
(Source: FAST Graphs, FactSet)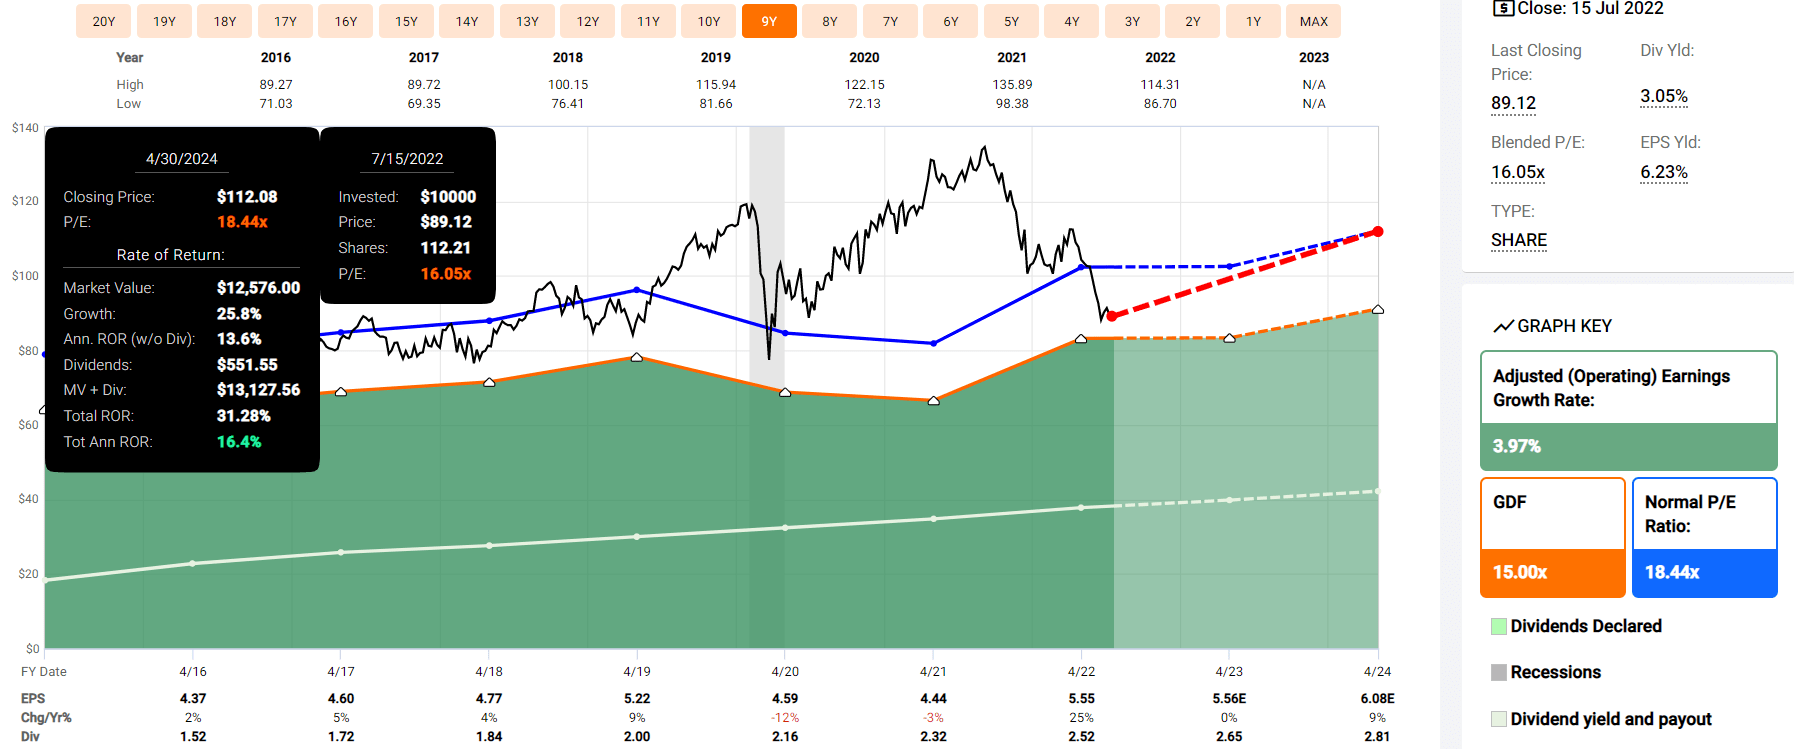
National Fuel Gas 2024 Consensus Total Return Potential
(Source: FAST Graphs, FactSet)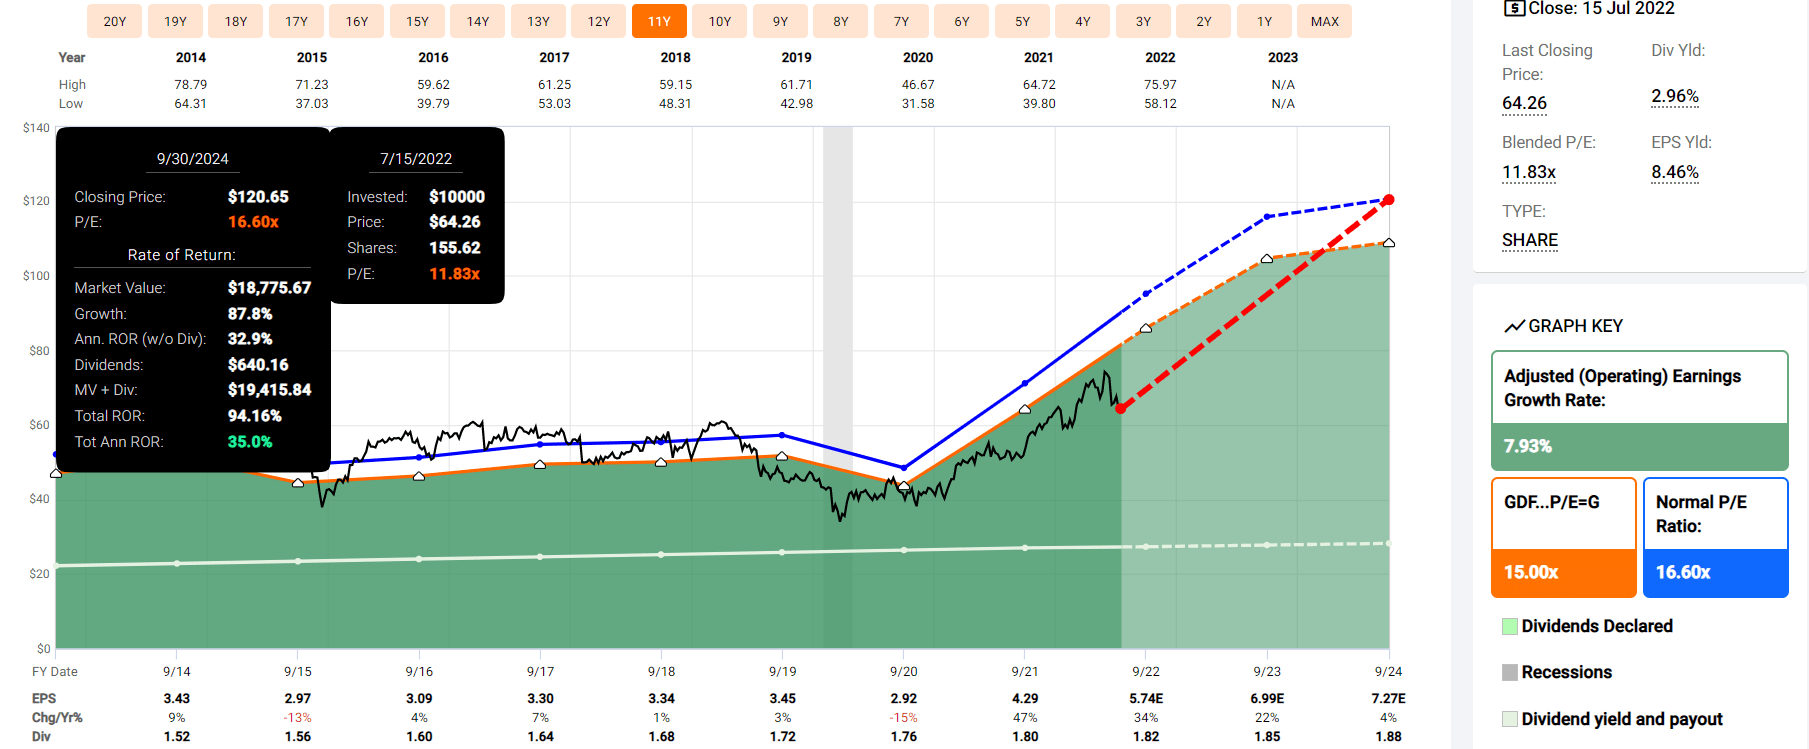
- average 2024 consensus total return potential: 20.5% CAGR
- Buffett-like return potential from high-yield defensive dividend aristocrat bargains hiding in plain sight
S&P 500 2024 Consensus Total Return Potential
(Source: FAST Graphs, FactSet)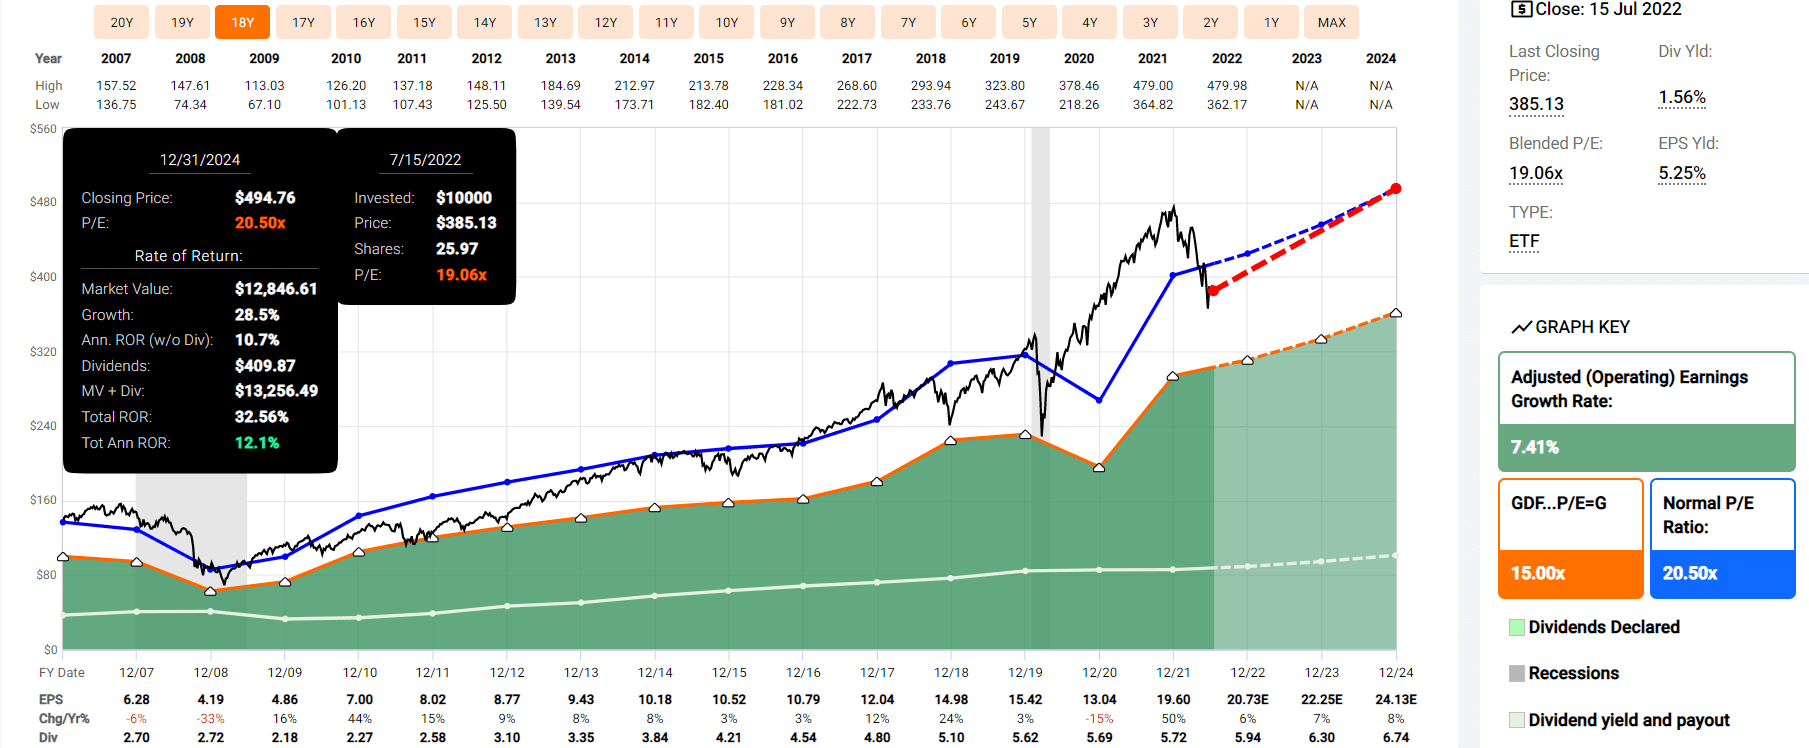
These 11 high-yield defensive aristocrats have almost 2X the consensus 2024 return potential of the S&P 500.
But with 2.5X, the much safer yield, and far lower volatility over time, from some of the world’s highest quality companies, you might not have considered.
Some Of The Safest High-Yield Blue-Chips On Earth
Dividend Kings Zen Research Terminal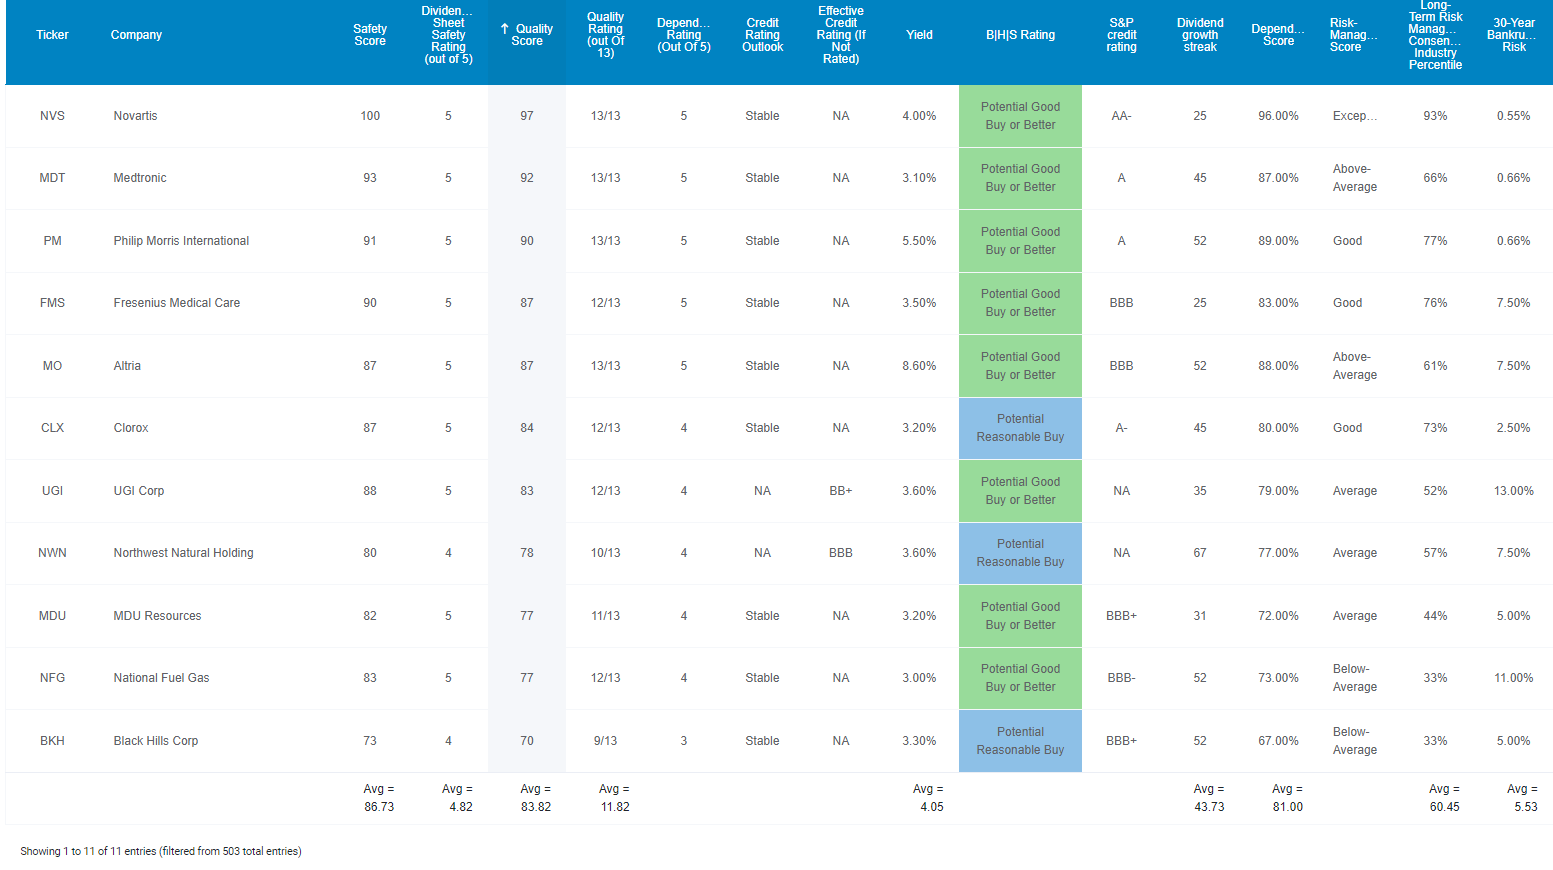
These aren’t just blue-chips they are Super SWANs, a highly caliber of blue-chip. How can we tell? By comparing their quality to the famous dividend aristocrats.
Quality That’s Nearly As High As The Dividend Aristocrats
| Metric | Dividend Aristocrats | 11 High-Yield Defensive Dividend Aristocrats | Winner Dividend Aristocrats |
Winner 11 High-Yield Defensive Dividend Aristocrats |
| Quality | 87% | 84% | 1 | |
| Safety | 89% | 87% | 1 | |
| Dependability | 84% | 81% | 1 | |
| Long-Term Risk Management Industry Percentile | 67% Above-Average | 60% Above-Average | 1 | |
| Average Credit Rating | A- Stable | BBB+ Stable | 1 | |
| Average 30-Year Bankruptcy Risk | 3.01% | 5.53% | 1 | |
| Average Dividend Growth Streak (Years) | 44.3 | 43.7 | 1 | |
| Average Return On Capital | 100% | 268% | 1 | |
| Average ROC Industry Percentile | 83% | 82% | 1 | |
| 13-Year Median ROC | 89% | 144% | 1 | |
| Forward PE | 18.8 | 15.9 | 1 | |
| Discount To Fair Value | 8.0% | 20.0% | 1 | |
| DK Rating | Good Buy | Strong Buy | 1 | |
| Yield | 2.6% | 4.1% | 1 | |
| LT Growth Consensus | 8.6% | 6.9% | 1 | |
| Total Return Potential | 11.2% | 11.0% | 1 | |
| Risk-Adjusted Expected Return | 7.6% | 7.3% | 1 | |
| Inflation & Risk-Adjusted Expected Return | 5.1% | 4.8% | 1 | |
| Years To Double | 14.0 | 15.0 | 1 | |
| Total | 13 | 6 |
(Source: DK Zen Research Terminal)
It’s true the aristocrats collectively beat these high-yield defensives in most categories of safety and quality because of being represented by just three defensive sectors.
However, the aristocrats just barely beat in most categories, such as a dividend growth streak that’s less than one year longer.
For context, Ben Graham considered a 20+ year dividend growth streak an important sign of excellent quality, and these 11 high-yield defensive aristocrats average a 43-year streak, more than 2X as long.
Joel Greenblatt, whose 21 years of 40% annual total returns make him possibly one of the greatest investors in history, considered return on capital his gold standard proxy for quality and moatiness.
The S&P 500’s ROC is 14.6%, and the dividend aristocrats 100%. These aristocrats have a 12-month TTM ROC of 268%.
- 2.7X more than the dividend aristocrats
- and 18.4X more than the S&P 500
The aristocrats beat them in ROC industry percentile by 1%, 83% vs. 82%, but that still means that these aristocrats’ ROC is in the top 18% of their respective industries.
And their 13-year median ROC is 144% vs. the aristocrat’s 89%, indicating a wide and stable or even growing moat.
S&P estimates the average 30-year bankruptcy risk of the aristocrats at 3%, an A- stable credit rating.
- long-term bankruptcy is a proxy for the risk of losing all your money in a company, Buffett’s definition of fundamental risk
These aristocrats have an average credit rating of BBB+ stable, with 5.5% fundamental risk.
And according to six rating agencies, their average long-term risk management is in the 60th industry percentile.
These Aristocrats Have Above-Average Long-Term Risk-Management
| Classification | Average Consensus LT Risk-Management Industry Percentile |
Risk-Management Rating |
| S&P Global (SPGI) #1 Risk Management In The Master List | 94 | Exceptional |
| Strong ESG Stocks | 78 |
Good – Bordering On Very Good |
| Foreign Dividend Stocks | 75 | Good |
| Ultra SWANs | 71 | Good |
| Low Volatility Stocks | 68 | Above-Average |
| Dividend Aristocrats | 67 | Above-Average |
| Dividend Kings | 63 | Above-Average |
| Master List average | 62 | Above-Average |
| Hyper-Growth stocks | 61 | Above-Average |
| Monthly Dividend Stocks | 60 | Above-Average |
| 11 High-Yield Defensive Aristocrats | 60 | Above-Average |
| Dividend Champions | 57 | Average bordering on above-average |
(Source: DK Research Terminal)
That’s slightly better than the dividend champions as a group whose risk-management averages 57th industry percentile.
How safe are these aristocrat’s 4.1% average yield?
Dividend You Can Trust In Any Future Recession
| Rating | Dividend Kings Safety Score (162 Point Safety Model) | Approximate Dividend Cut Risk (Average Recession) | Approximate Dividend Cut Risk In Pandemic Level Recession |
| 1 – unsafe | 0% to 20% | over 4% | 16+% |
| 2- below average | 21% to 40% | over 2% | 8% to 16% |
| 3 – average | 41% to 60% | 2% | 4% to 8% |
| 4 – safe | 61% to 80% | 1% | 2% to 4% |
| 5- very safe | 81% to 100% | 0.5% | 1% to 2% |
| 11 High-Yield Defensive Dividend Aristocrats | 87% | 0.5% | 1.7% |
| Risk Rating | Low-Risk (60th industry percentile risk-management consensus) | BBB+ stable outlook credit rating 5.5% 30-year bankruptcy risk | 15% OR LESS Max Risk Cap Recommendation (Each) |
(Source: DK Research Terminal)
In the average recession since WWII, their average risk of a dividend cut is about 1 in 200. In a severe recession, like the Pandemic or Great Recession, it’s about 1 in 59.
So that’s why you can trust these high-yield defensive aristocrats, but here’s why you might want to buy them today.
Wonderful Companies At Wonderful Prices
Dividend Kings Zen Research Terminal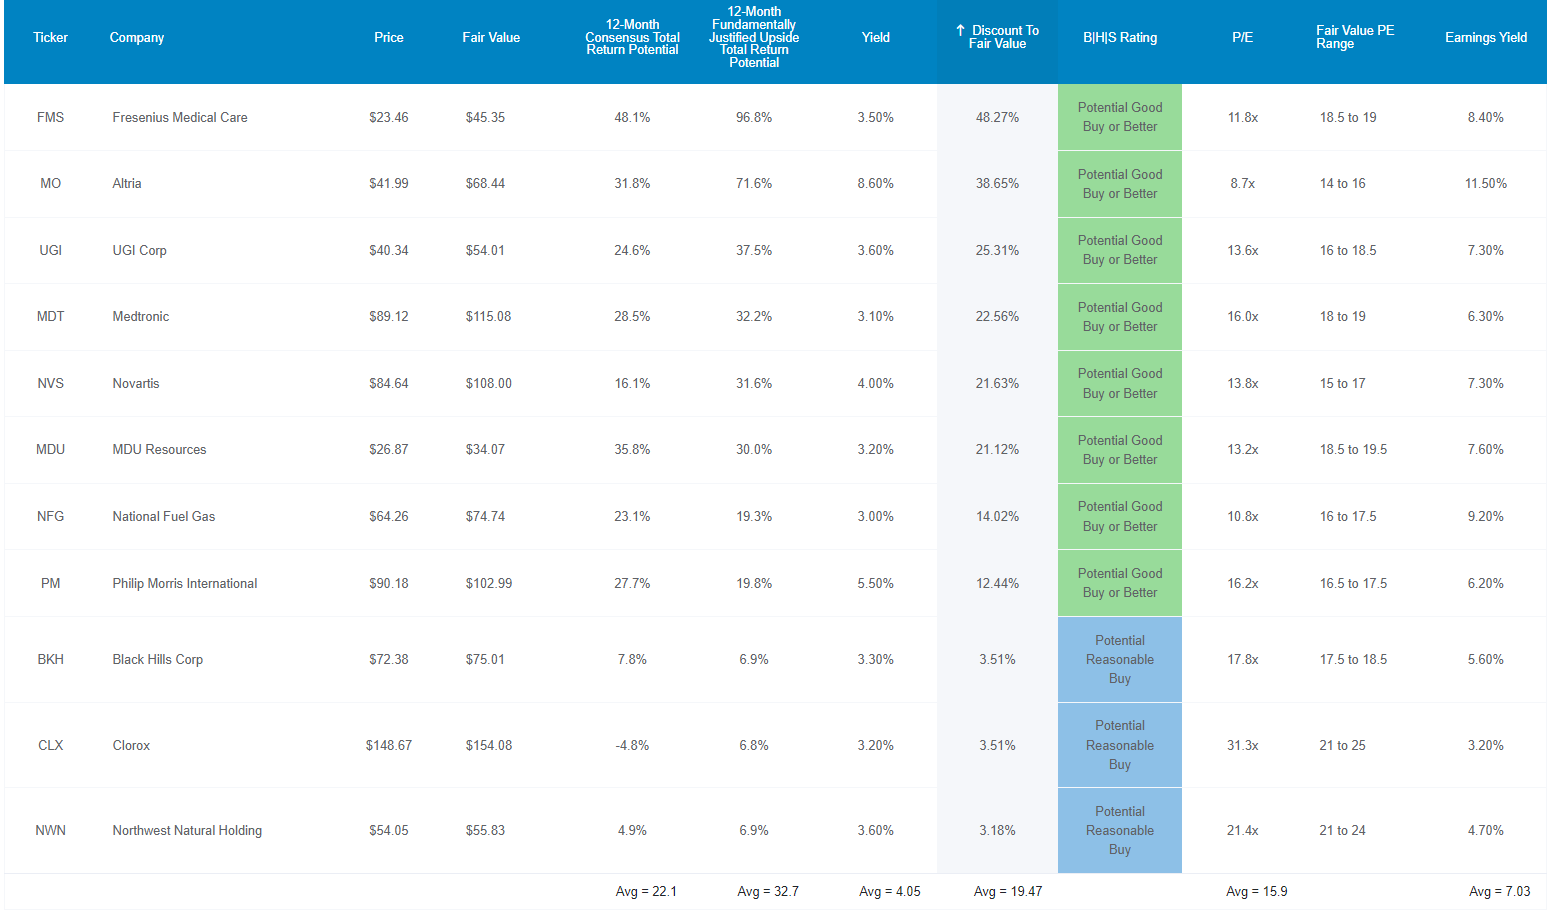
The S&P 500 trades at 16.3X forward earnings, an 4% historical discount.
The dividend aristocrats trade at 18.8X earnings, an 8% historical discount.
These aristocrats trade at 15.9X, a 20% historical discount.
- 25% total return potential just to fair value
Analysts expect these defensive aristocrats to deliver 22% total returns within just 12 months, and 33% would be justified by fundamentals.
- if each of these companies grows as expected and returns to historical mid-range fair value within 12 months, investors will make 33% total returns
But my goal isn’t to help you earn a quick 22%, 25%, or even 33% within a year. My goal is to help you achieve life-changing 12X real returns over decades so you can sleep well at night while retiring safely and in splendor.
Long-Term Return Potential That Can Help You Retire Rich Sleep Well At Night
Dividend Kings Zen Research Terminal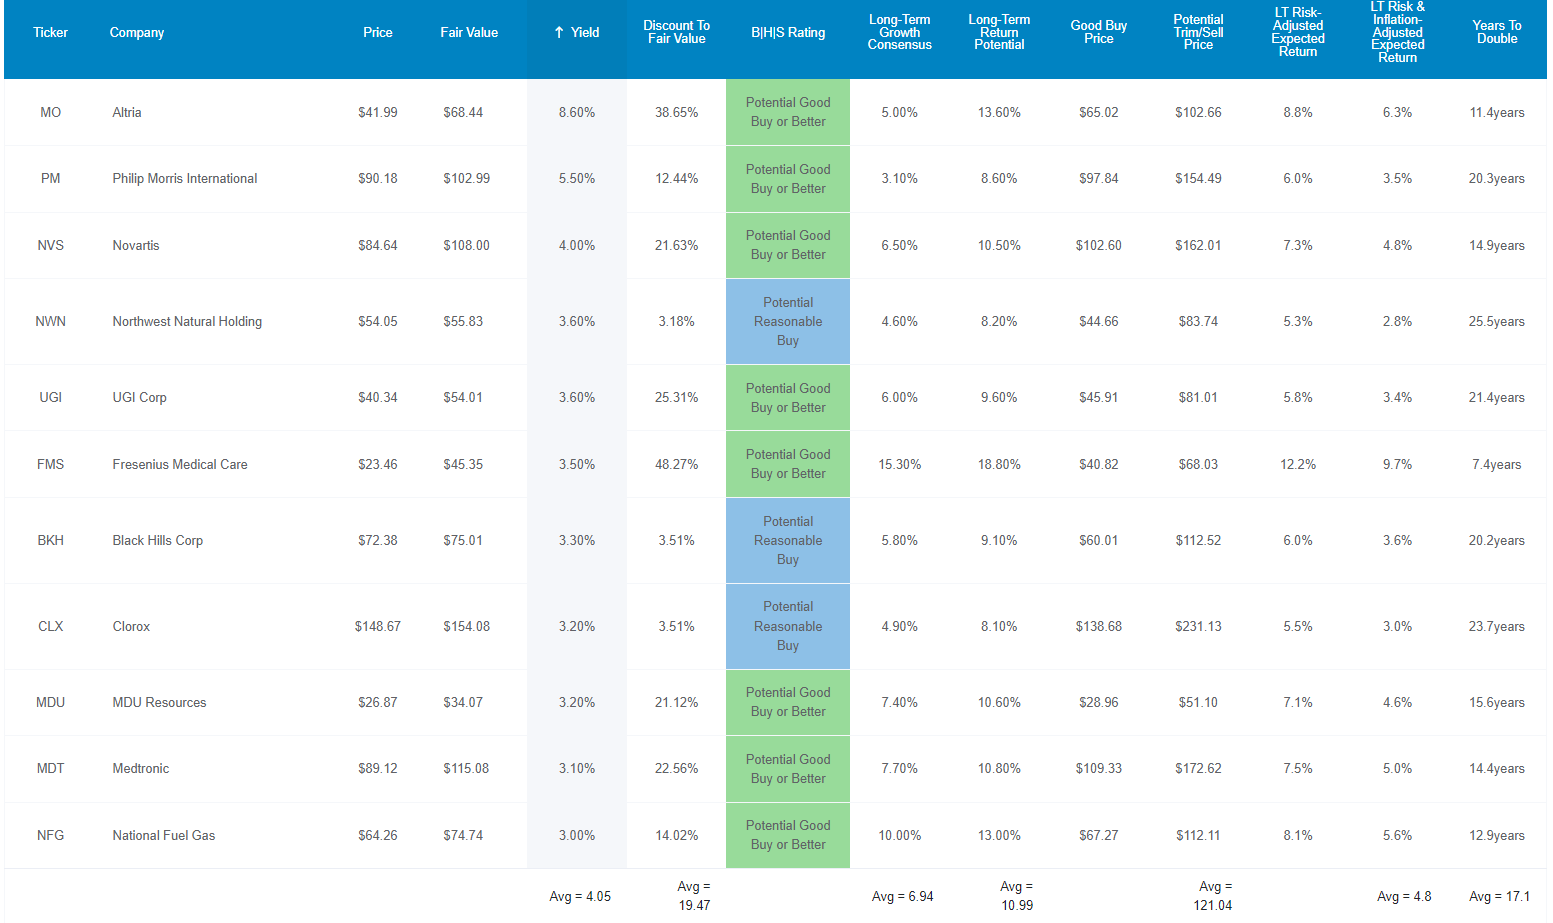
Not only do these defensive aristocrats offer a very safe 4.1% yield but analysts think they can grow at 7% over the long-term and deliver 11% long-term returns.
For context, analysts expect the S&P 500 to deliver 10.2% long-term returns and aristocrats 11.2%.
- returns potentially matching the aristocrats
- and beating the S&P by about 1% per year
What does that potentially mean for you?
Inflation-Adjusted Consensus Total Return Potential: $1,000 Initial Investment (Ignoring Valuations)
| Time Frame (Years) | 7.7% CAGR Inflation-Adjusted S&P Consensus | 8.7% Inflation-Adjusted Aristocrats Consensus | 8.5% CAGR Inflation-Adjusted 11 High-Yield Defensive Aristocrats Consensus | Difference Between Inflation-Adjusted 11 High-Yield Defensive Aristocrats Consensus Vs S&P Consensus |
| 5 | $1,451.05 | $1,519.66 | $1,505.74 | $54.68 |
| 10 | $2,105.56 | $2,309.37 | $2,267.24 | $161.69 |
| 15 | $3,055.27 | $3,509.46 | $3,413.87 | $358.60 |
| 20 | $4,433.36 | $5,333.20 | $5,140.39 | $707.03 |
| 25 | $6,433.04 | $8,104.66 | $7,740.07 | $1,307.03 |
| 30 | $9,334.69 | $12,316.34 | $11,654.51 | $2,319.82 |
(Source: DK Research Terminal, FactSet)
Analysts think these high-yield defensive aristocrats could potentially deliver 12X returns over the next 30 years.
| Time Frame (Years) | Ratio Aristocrats/S&P Consensus | Ratio Inflation-Adjusted LOW 11 High-Yield Defensive Aristocrats vs. S&P consensus |
| 5 | 1.05 | 1.04 |
| 10 | 1.10 | 1.08 |
| 15 | 1.15 | 1.12 |
| 20 | 1.20 | 1.16 |
| 25 | 1.26 | 1.20 |
| 30 | 1.32 | 1.25 |
(Source: DK Research Terminal, FactSet)
That’s potentially 25% more than the dividend aristocrats and on par with what the lower-yielding aristocrats offer.
- but with far less volatility than either the aristocrats or S&P 500
What evidence is there that these 11 high-yield defensive aristocrats can deliver anything close to 11% long-term returns?
Historical Returns Since December 1996 (Equal Weight, Annual Rebalancing)
“The future doesn’t repeat, but it often rhymes.” – Mark Twain
Past performance is no guarantee of future results, but studies show that blue-chips with relatively stable fundamentals over time offer predictable returns based on yield, growth, and valuation mean reversion.
Bank of America
So let’s see how these 11 high-yield defensive aristocrats performed over the last 26 years when approximately 95% of total returns were explained by fundamentals and not luck.
(Source: Portfolio Visualizer Premium)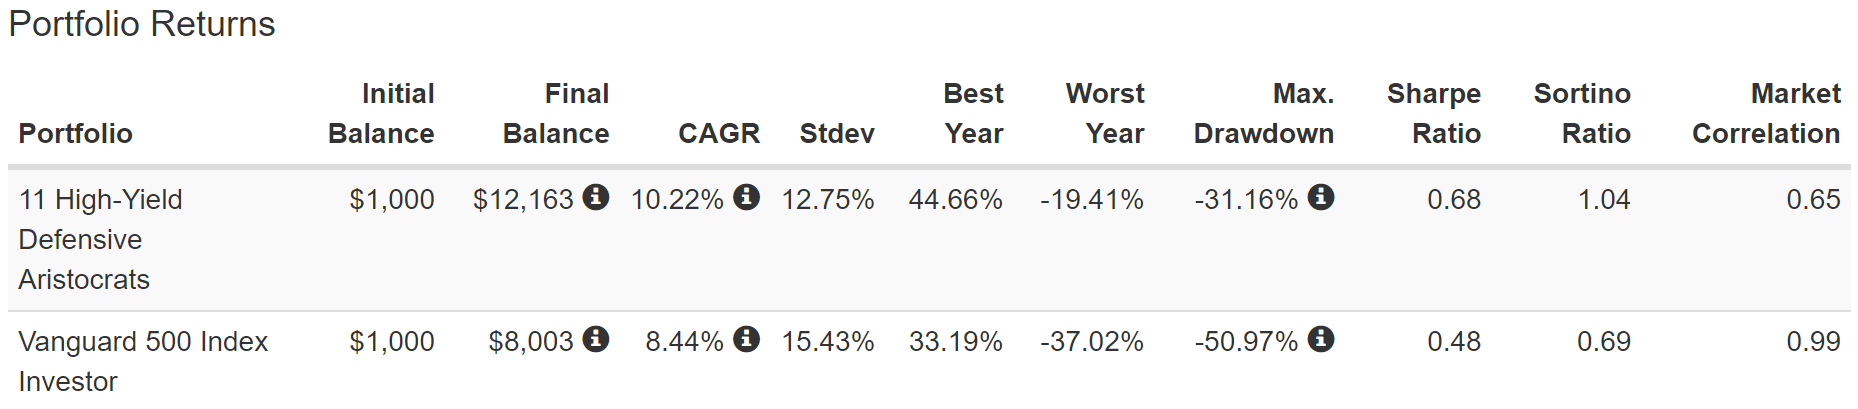
Including the current bear market, these aristocrats have delivered 10.2% annual returns over 26 years but with just 13% annual volatility, 16% less than the S&P 500.
They beat the market by 1.8% annually, with a peak decline of 31%, 40% less than the S&P 500 (20% in absolute terms).
- 60/40 in the Great Recession fell 31%
- these aristocrats were able to deliver bond-like defensiveness with no bond exposure at all
They delivered 51% better negative volatility-adjusted total returns (Sortino ratio) than the S&P 500 for over a quarter century.
(Source: Portfolio Visualizer Premium)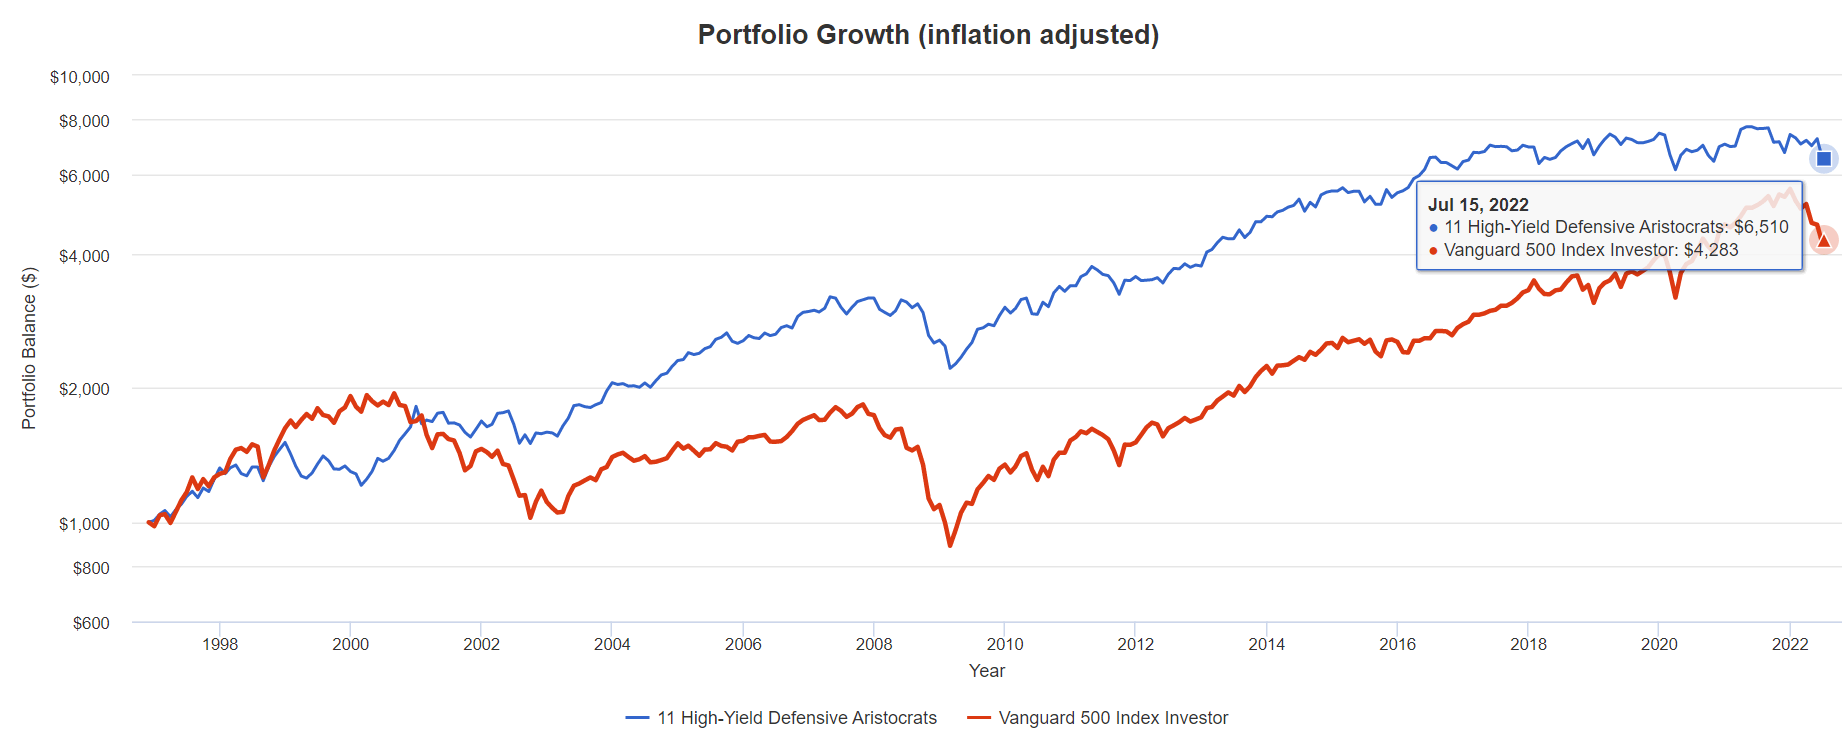
Over the last 26 years, analysts expected about 7.7X inflation-adjusted returns, and they delivered 6.5X.
- 51% better than the S&P 500 and with a lot less volatility, especially in bear markets
(Source: Portfolio Visualizer Premium)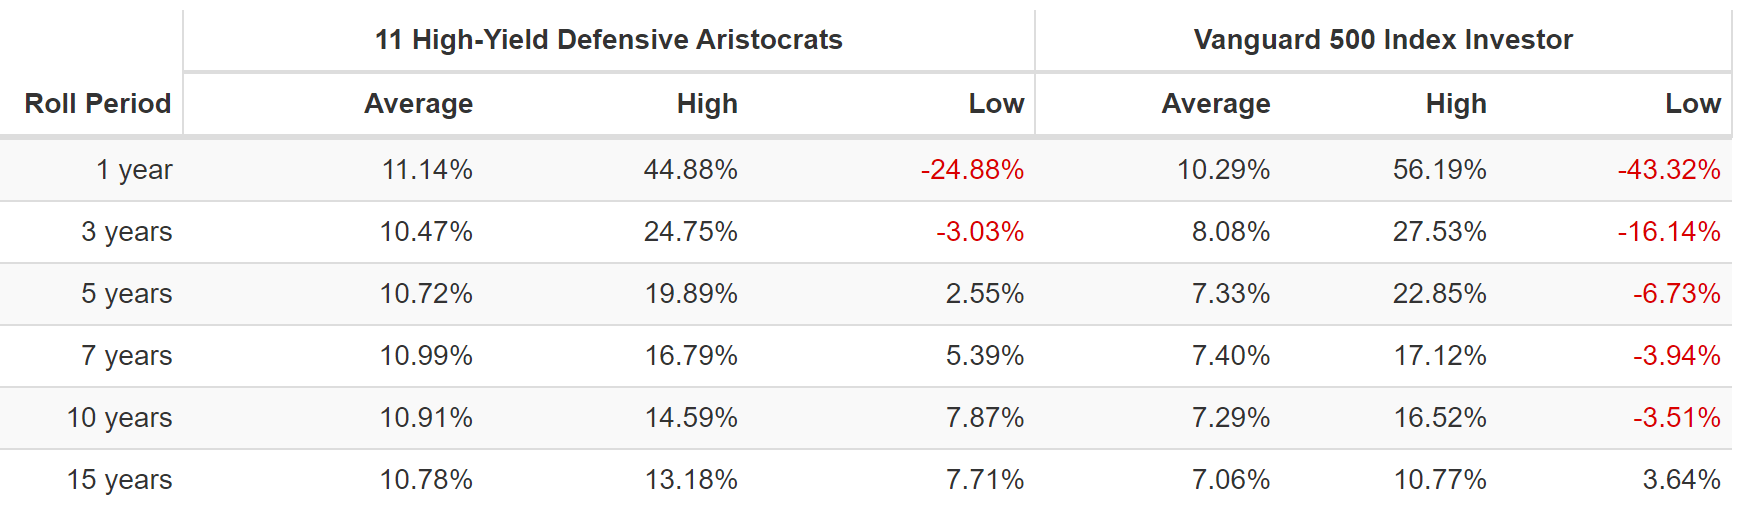
What evidence is there that these aristocrats can deliver 11% annual returns over time? For 26 years, they delivered:
- average annual returns of 11.1% vs S&P 500’s 10.3% (10.2% is S&P long-term consensus)
- average 10-year returns of 10.9% CAGR vs. 7.3% for the S&P
- average 15-year returns of 10.8% CAGR vs. 7.1% for the S&P
Sleep Well At Night Dream Stocks
(Source: Portfolio Visualizer Premium)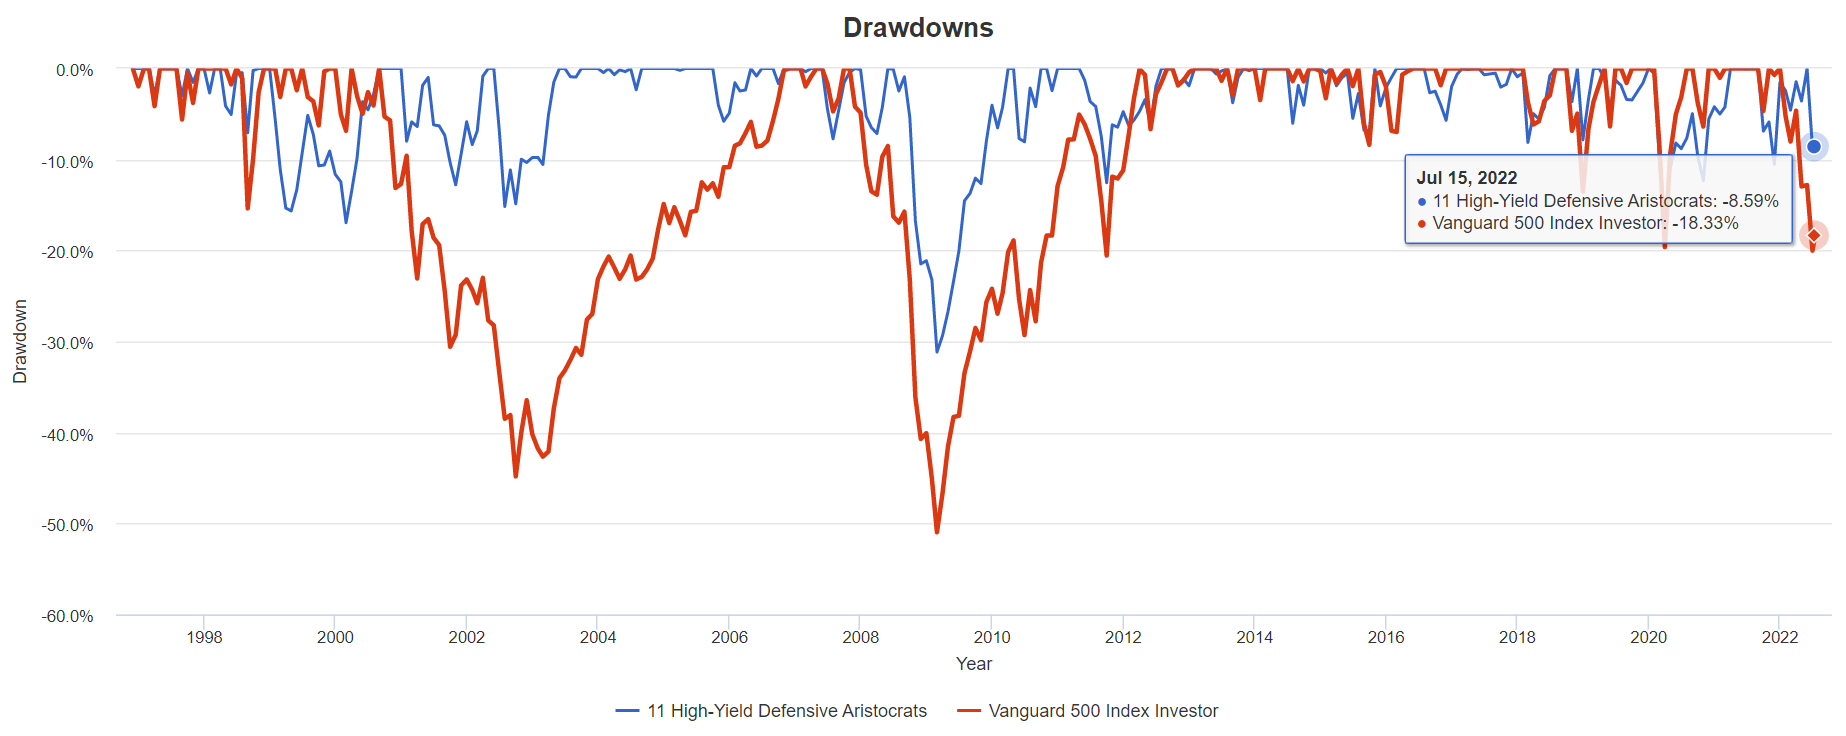
These aristocrats collectively have far lower volatility in every major market decline of the last 26 years.
(Source: Portfolio Visualizer Premium)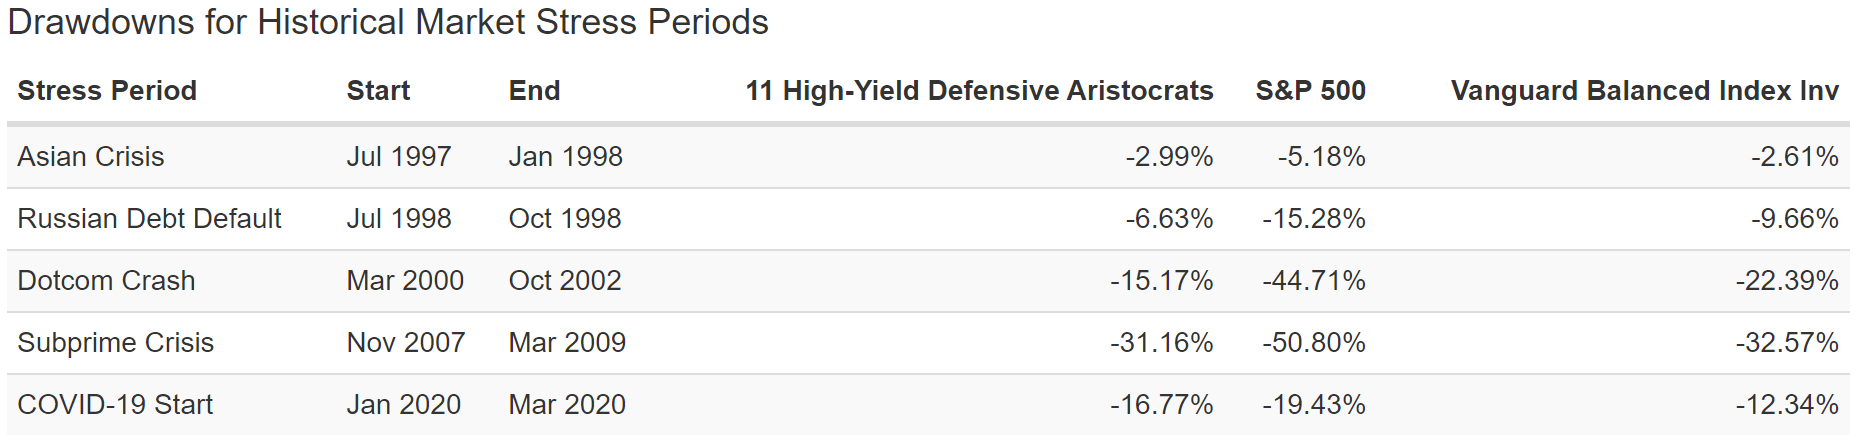
In most major market corrections, these defensive aristocrats fall 50% to 66% less than the S&P 500.
In fact, they are so defensive that they often fall less than a 60/40 retirement portfolio as they did during the:
- Russian debt default crisis of 1998
- tech crash of 2000 to 2022
- Great Recession
- The bear market of 2022
(Source: Portfolio Visualizer Premium) (Source: Portfolio Visualizer Premium) (Source: Portfolio Visualizer Premium)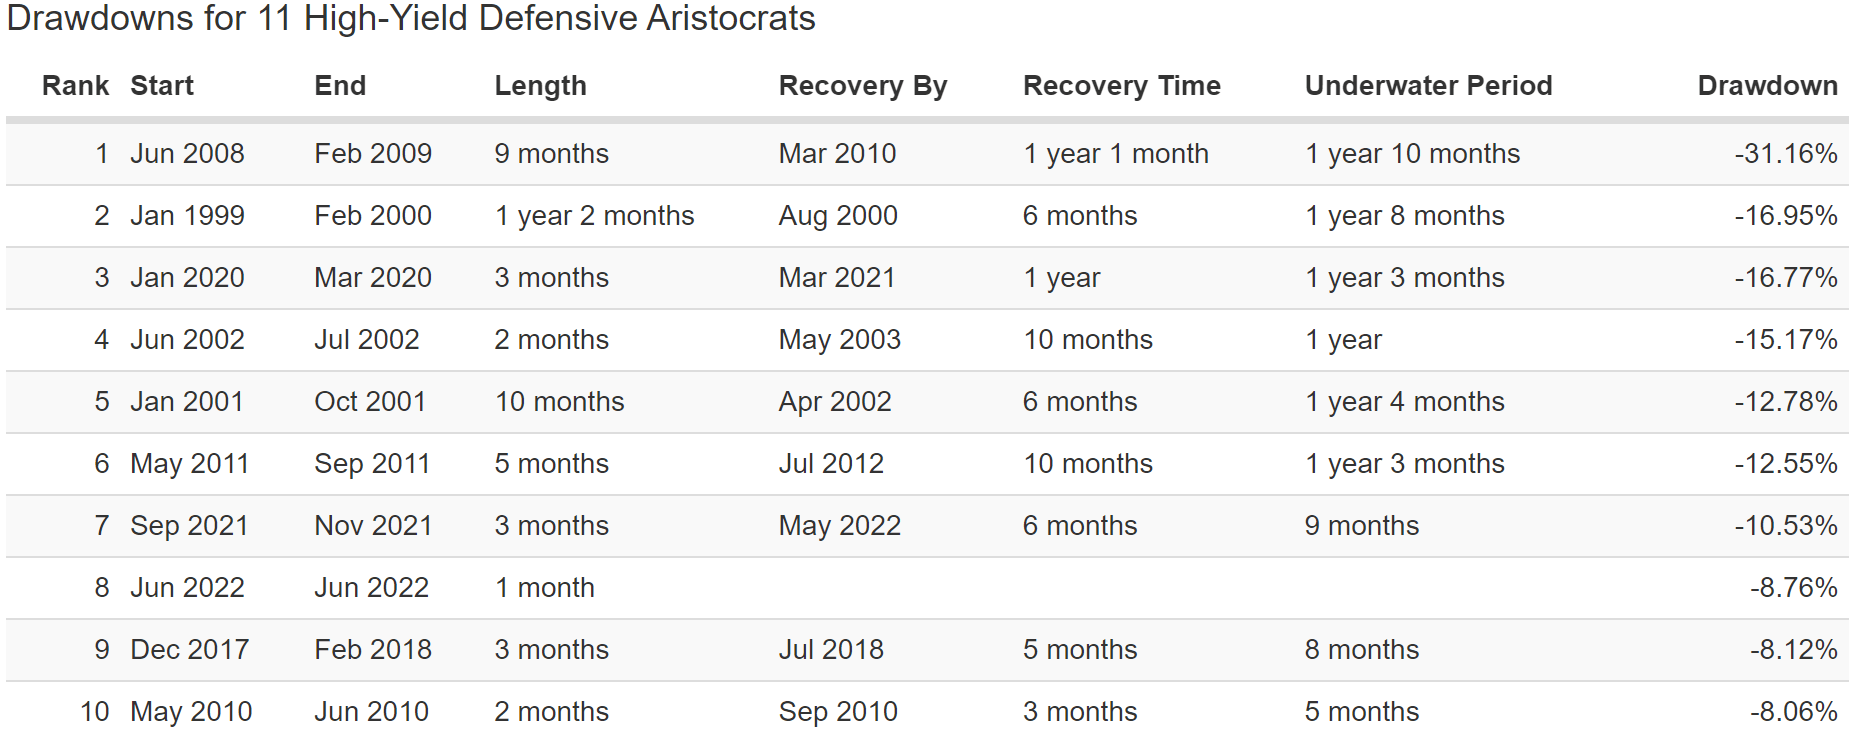
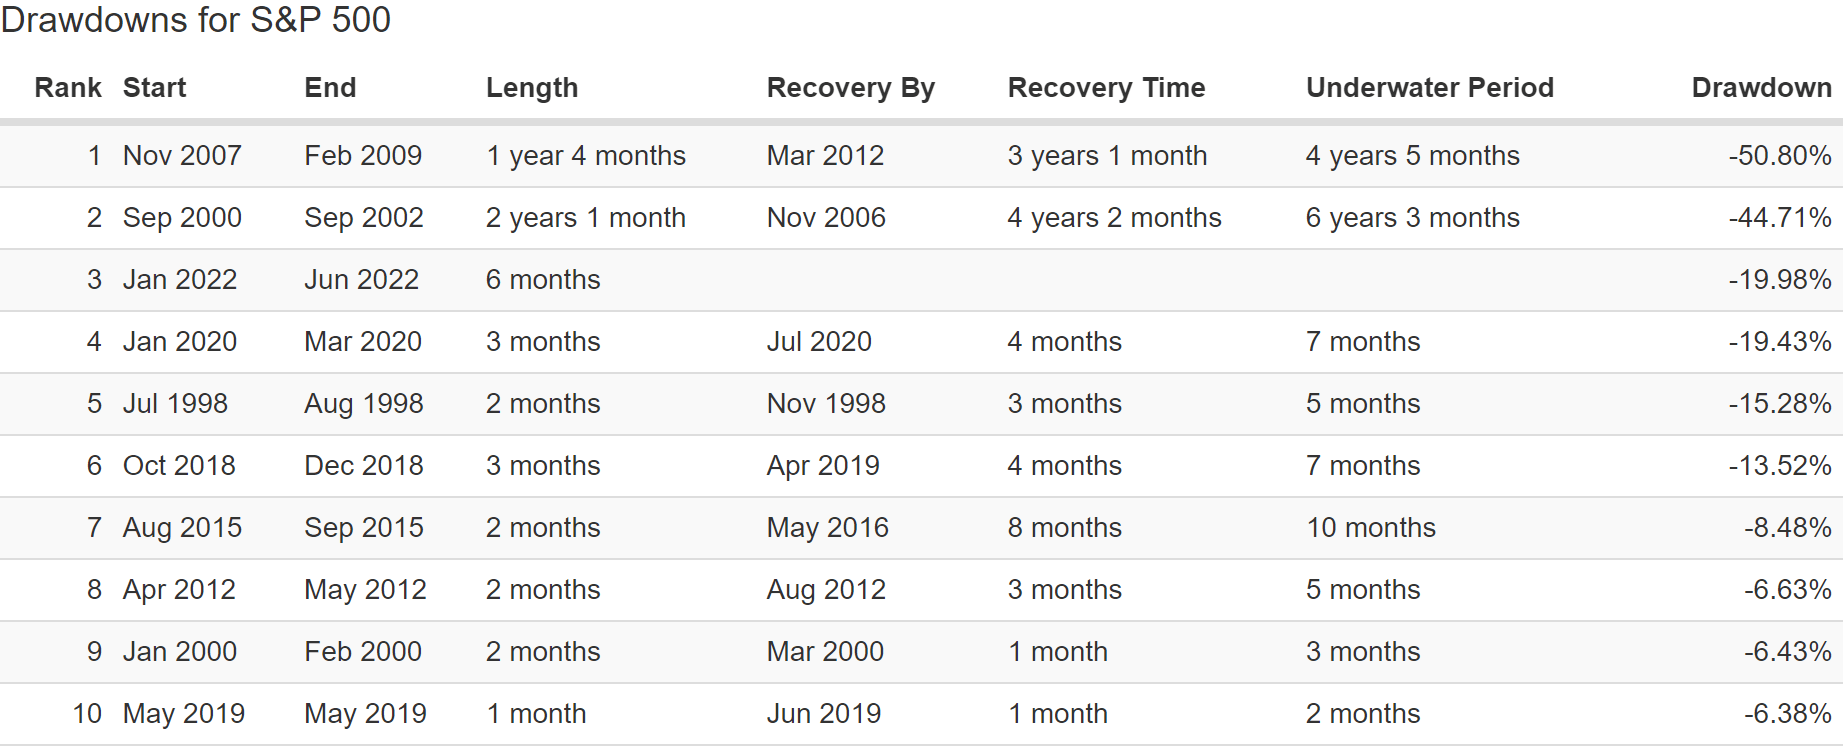
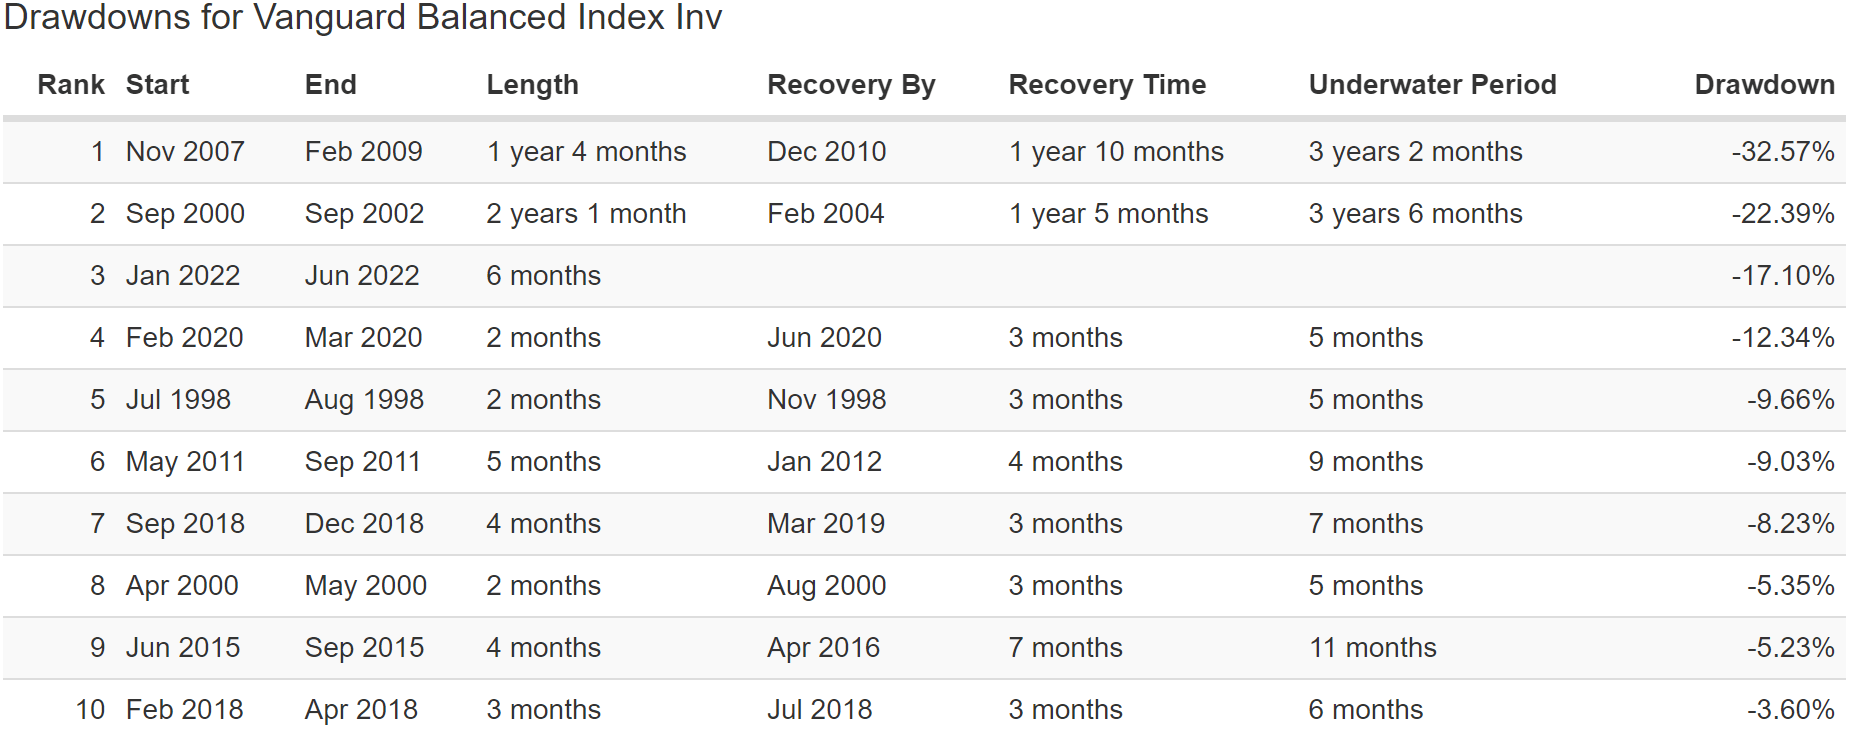
A 60/40 is down 17%, and the S&P is in a 20% bear market. These 11 defensive aristocrats? A 9% pullback and they are down just 6% this year.
(Source: Portfolio Visualizer Premium)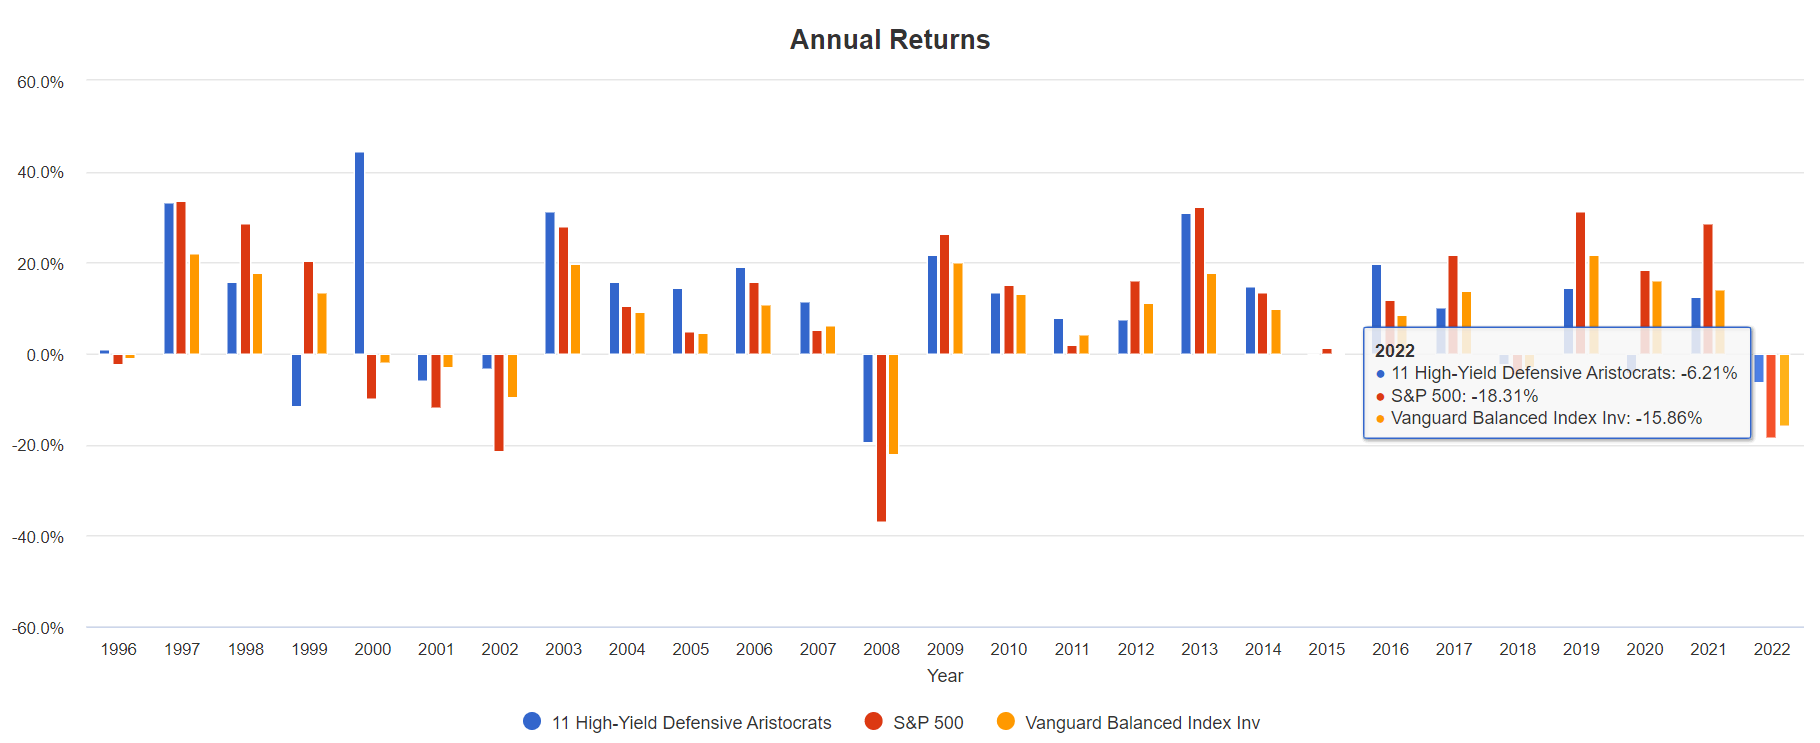
That’s a 66% smaller decline than the S&P 500 and a 60% smaller decline than a 60/40. In fact, take a look at some of the annual returns during the worst years for stocks in the last quarter century.
- 2000: +44% vs. S&P’s -10% vs. 60/40’s -2%
- 2001: -6% vs. S&P’s -12% vs. 60/40’s -3%
- 2002: -3% vs. S&P’s -22% vs. 60/40s -10%
- 2008: -19% vs. S&P 500’s -37% vs. 60/40’s -22%
- 2018 (2 corrections including 1 bear market): -2% vs S&P 500’s -5% vs. 60/40’s -3%
- 2022: -6% vs. S&P’s -18% vs. 60/40’s -16%
And what about income? The main long-term purpose of owning high-yield aristocrats?
Dividend Growth You Can Rely On No Matter What The Economy Or Market Is Doing
2007 And 2008 Were The Altria Spin-Offs (Source: Portfolio Visualizer Premium)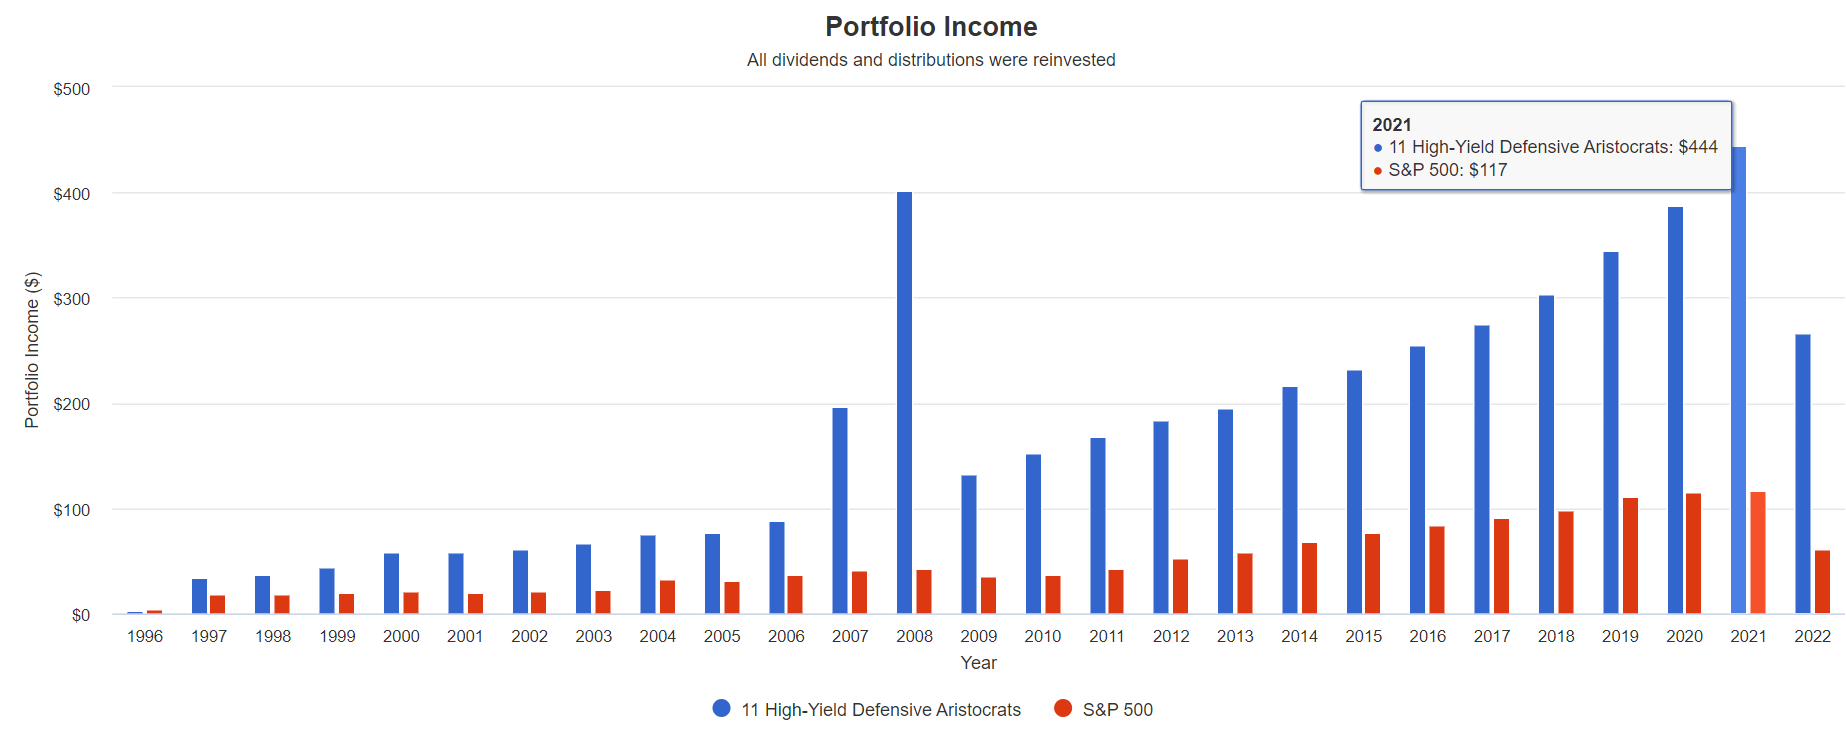
What’s the benefit of high-yield aristocrat investing? How about significantly faster income growth than the S&P 500?
| Portfolio | 1997 Income Per $1000 Investment | 2022 Income Per $1000 Investment | Annual Income Growth | Starting Yield |
2022 Yield On Cost |
| S&P 500 | $18 | $122 | 7.96% | 1.8% | 12.2% |
| 11 High-Yield Defensive Aristocrats | $34 | $534 | 11.65% | 3.4% | 53.4% |
(Source: Portfolio Visualizer Premium)
Over the last 25 years, these aristocrats delivered almost 12% annual income growth turning a 3.4% starting yield into a 53.4% yield on cost.
What about future income?
| Analyst Consensus Income Growth Forecast | Risk-Adjusted Expected Income Growth | Risk And Tax-Adjusted Expected Income Growth |
Risk, Inflation, And Tax Adjusted Income Growth Consensus |
| 12.5% | 8.8% | 7.5% | 4.9% |
(Source: DK Research Terminal, FactSet)
Analysts expect 12.5% income growth from these aristocrats in the future, similar to its historical income growth rate. When adjusted for the risk of it not growing as expected, inflation and taxes are about 4.9% real expected income growth.
Now compare that to what they expect from the S&P 500.
| Time Frame | S&P Inflation-Adjusted Dividend Growth | S&P Inflation-Adjusted Earnings Growth |
| 1871-2021 | 1.6% | 2.1% |
| 1945-2021 | 2.4% | 3.5% |
| 1981-2021 (Modern Falling Rate Era) | 2.8% | 3.8% |
| 2008-2021 (Modern Low Rate Era) | 3.5% | 6.2% |
| FactSet Future Consensus | 2.0% | 5.2% |
(Sources: S&P, FactSet, Multipl.com)
- 1.7% post-tax inflation-adjusted income growth from the S&P 500
- S&P 500’s historical post-tax inflation-adjusted income growth rate (current tax code) is 5.8% CAGR
What about a 60/40 retirement portfolio?
- 0.5% consensus inflation, risk, and tax-adjusted income growth.
Or, to put it another way:
- 2.5X the market’s yield today (and a much safer yield at that)
- with potentially 3X faster real income growth than the S&P 500
- and potentially 10X faster real income growth than a 60/40
This is the power of high-yield defensive dividend aristocrat investing in a bear market.
Bottom Line: 11 High-Yield Dividend Aristocrats Perfect For The Coming Recession
Am I saying that stocks are going to fall 10% to 35% more? No, those are just the consensus estimates from blue-chip economists about what MIGHT happen if we get a mild to severe recession.
Am I saying that you can replace bonds with low-volatility defensive aristocrats? No, because in a market panic, almost all stocks decline while bonds remain the lowest risk way of hedging your portfolio.
Ycharts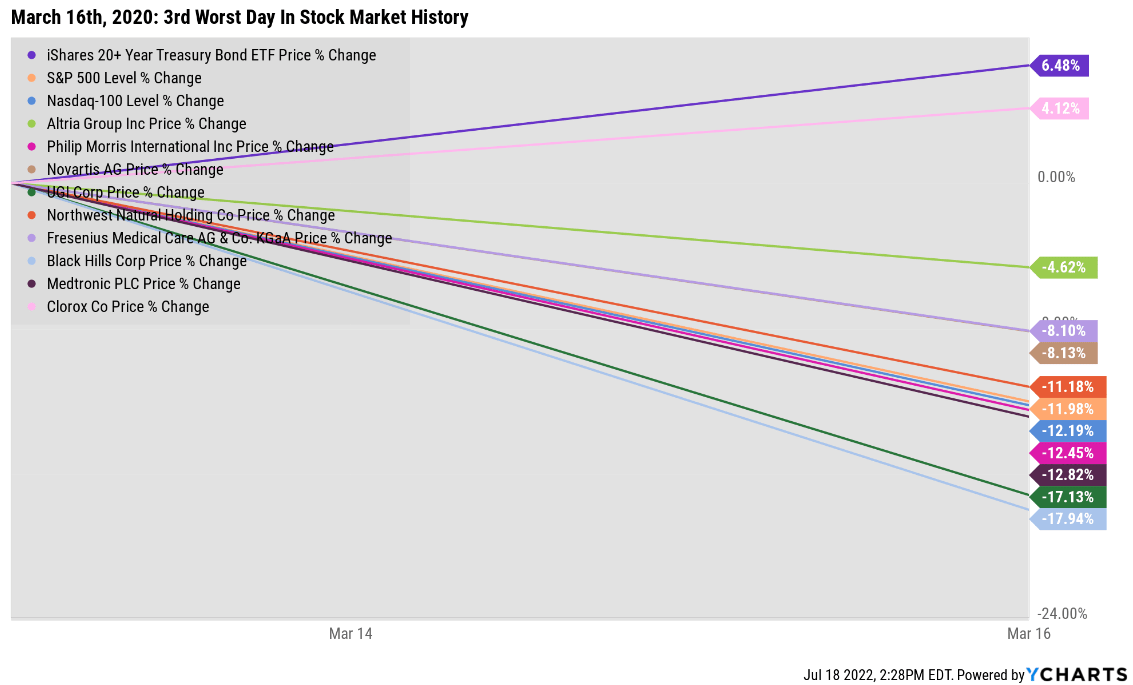
On March 16th, 2020, we had a global margin call that saw almost every company fall significantly on the 3rd worst day in US market history.
- S&P and Nasdaq were both down 12%
- aristocrats ranging from MDT to MO were down 4.6% to 18%
- only CLX went up 4%
- long US treasuries soared 6.5% in a classic flight to safety
No stock is a true bond alternative, and here’s what happens if you allocate 33% of your portfolio to long-duration US treasuries.
- according to Duke University, the best long-term hedging strategy in history
Historical Returns Since August 2002 (Annual Rebalancing)
(Source: Portfolio Visualizer Premium)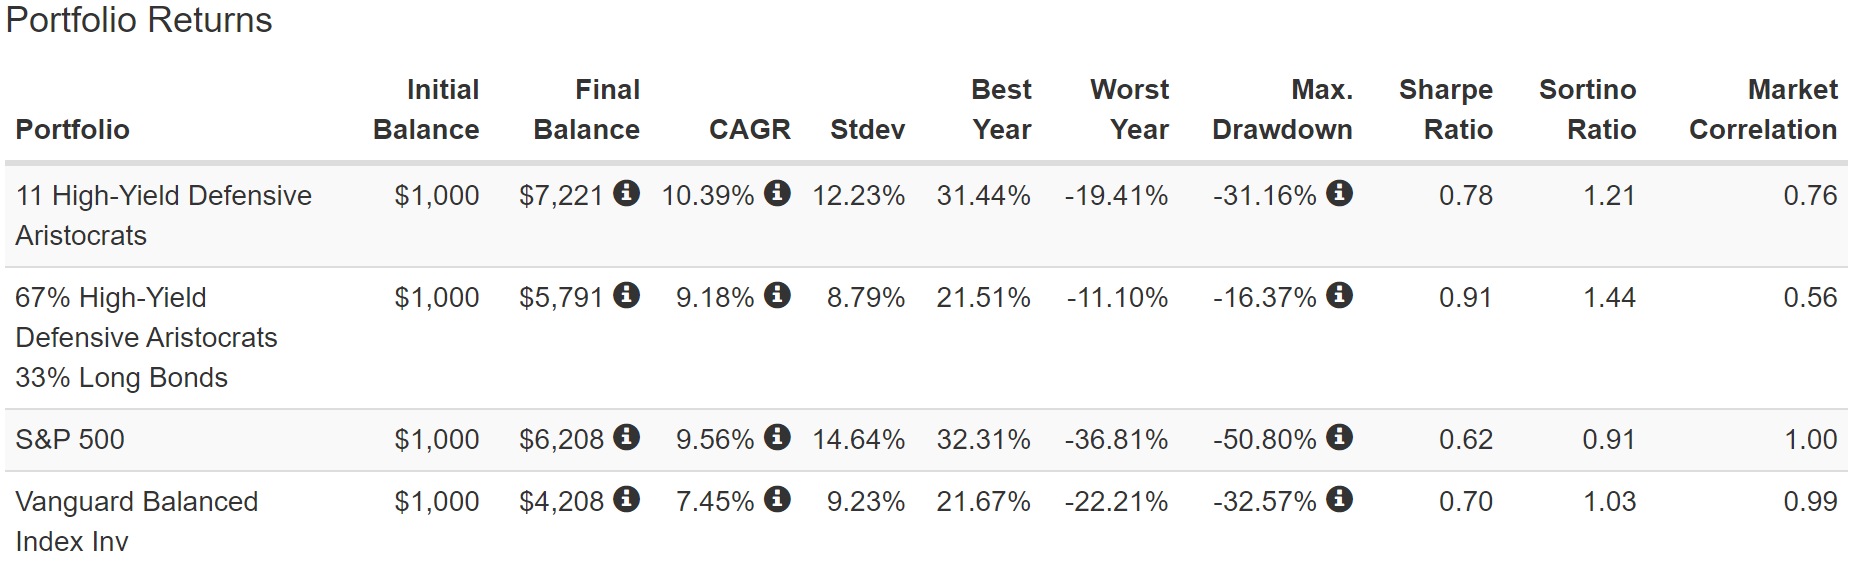
In the Great Recession, these high-yield defensive aristocrats fell just 31%, 40% less than the S&P 500. Adding 33% long bonds to your portfolio would have cut that decline in half.
The annual volatility of this portfolio was just 8.8% over the last two decades, less than a 60/40.
- but with 1.7% higher annual returns than a 60/40 and almost as high returns as the S&P 500
- 19% higher negative volatility-adjusted returns than defensive aristocrats alone
- 58% more than the S&P 500
- 40% more than a 60/40
(Source: Portfolio Visualizer Premium)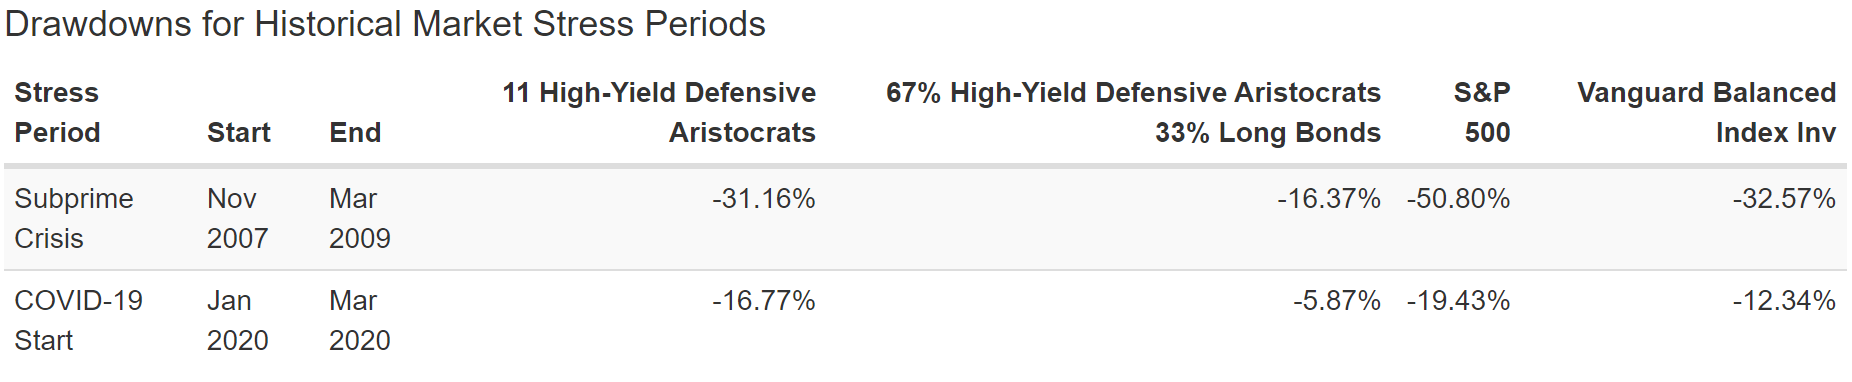
How does falling 16% in the Great Recession and just 6% during the Pandemic strike you? To me, it sounds like a great way to sleep well at night in even the most terrifying market conditions.
(Source: Portfolio Visualizer Premium)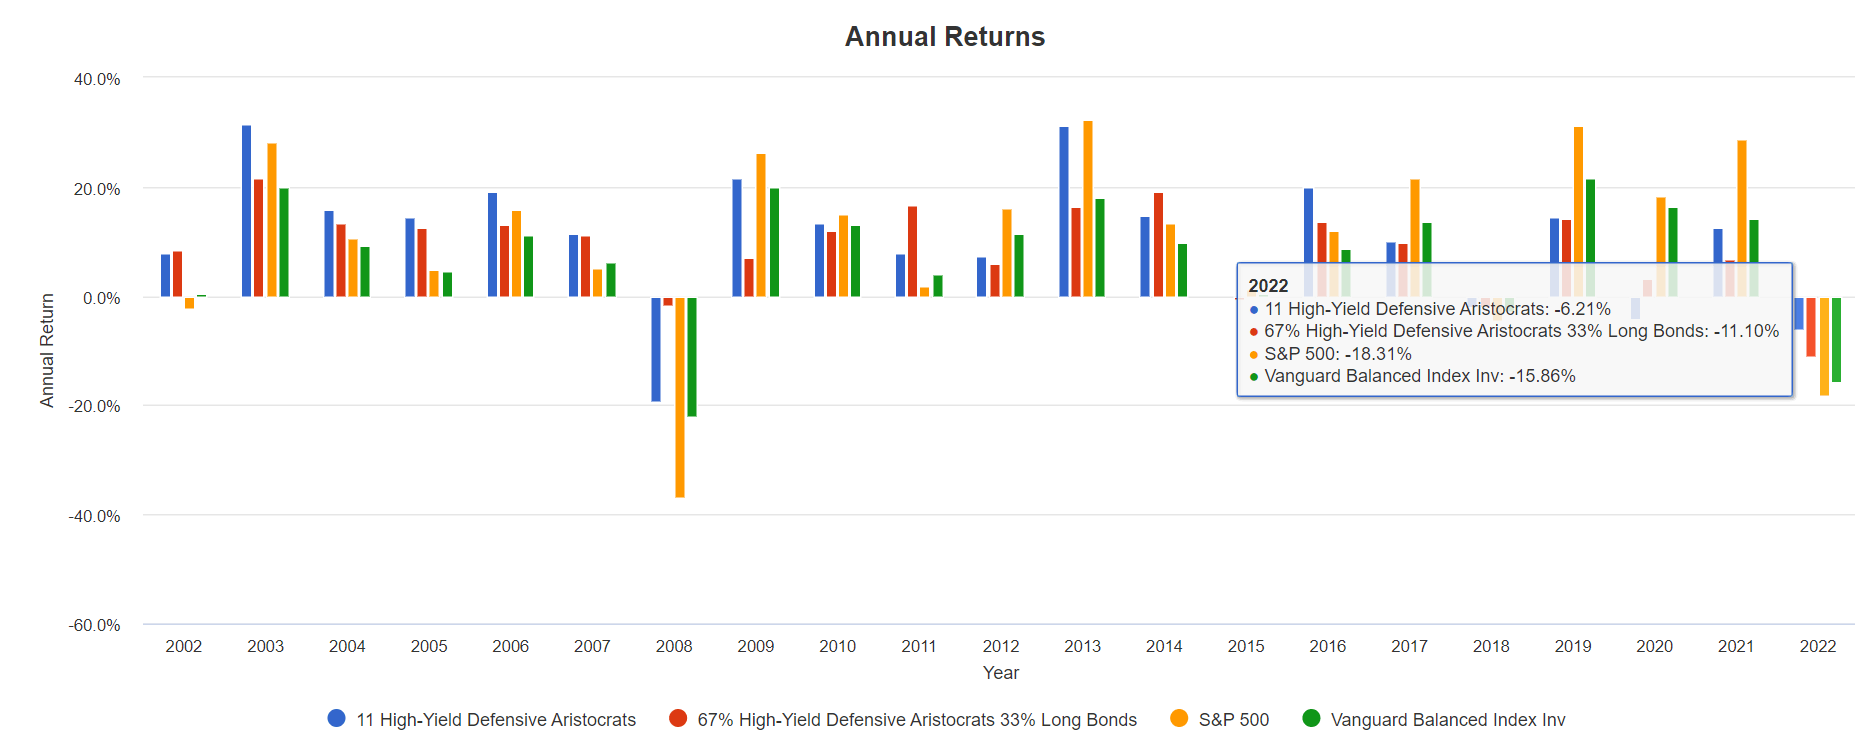
How about during 2008?:
- high-yield defensive aristocrats -19%
- 67% aristocrats/33% bonds -1.6%
- S&P -37%
- 60/40 -22%
In 2008, the most terrifying year for stocks since 1929, a 67/33 version of this portfolio would have been down 1.6%.
Now, of course, there is no free lunch. The worst bond bear market is history means that in 2022 the 67/33 version of this portfolio is down 11%, but that’s still far less than the S&P or 60/40.
- the consensus long-term return potential for this 67/33 portfolio is 8.4%
- 1.6% lower than the pure defensive aristocrat version
| Metric | 60/40 | 67% High-Yield Defensive Aristocrats/33% Long Bonds | X Better Than 60/40 |
| Yield | 1.7% | 3.8% | 2.24 |
| Growth Consensus | 5.1% | 4.6% | 0.90 |
| LT Consensus Total Return | 6.8% | 8.4% | 1.24 |
| Risk-Adjusted Expected Return | 4.8% | 5.9% | 1.24 |
| Safe Withdrawal Rate (Risk And Inflation-Adjusted Expected Returns) | 2.3% | 3.4% | 1.49 |
| Time To Double (Years) | 31.4 | 21.1 | 0.67 |
(Source: DK Research Terminal, FactSet Research)
However, compared to a 60/40, this potential ultra-low volatility high-yield portfolio is certainly one worth considering if it meets your goals and personal risk tolerances.
But the point is that stocks are not bonds, even low volatility defensive names like MO, PM, NVS, UGI, NWN, FMS, BKH, MDU, MDT, NFG, and CLX.
But what these high-yield defensive aristocrats can offer you is:
- 4.1% very safe yield (basically as safe as the aristocrats but almost 2X higher immediate income)
- super low volatility, 50% to 66% smaller historical declines in the most extreme market crashes
- including a 6% YTD decline in 2022 vs. the S&P 500’s 18% and 60/40’s 16%
- an average dividend growth streak of almost 44 years
- an average credit rating of BBB+ stable = 5.5% average 30-year bankruptcy risk 11% long-term return potential vs. 11% historical returns for 26 years
- 11% long-term return potential vs. 11% historical returns for the last 26 years
This is how you can harness the incredible power of the world’s most defensive high-yield aristocrats to sleep well at night while still compounding your income and wealth.
Not just to score a quick 22% to 35% gain in 12 months (though these aristocrats could potentially do so), but to grow your inflation-adjusted savings by potentially 12X over the next 30 years.
- the standard retirement time frame
- even those who are retired today need to keep ahead of inflation after all
If you’re tired of obsessing over the market’s daily gyrations? Consider high-yield defensive dividend aristocrats like these.
If you’re sick of feeling powerless in the face of terrifying but completely normal and inevitable bear markets such as 2022? Then maybe high-yield defensive aristocrat investing is for you.
Most importantly, if you want to sleep well at night knowing you’re likely to achieve your retirement goals and potentially even retire in safety and splendor, no matter what the stock market does in the coming years and decades, then it’s time to take a look at these high-yield defensive dividend aristocrats.
Be the first to comment