


Sometimes we have to make hard decisions as we pick between competing shares.
William_Potter
Get ready for charts, images, and tables because they are better than words. The ratings and outlooks we highlight here come after Scott Kennedy’s weekly updates in the REIT Forum. Your continued feedback is greatly appreciated, so please leave a comment with suggestions.
This article comes from an alert I sent to subscribers. I want to share why we swapped between two similar shares. If you haven’t seen our alerts before, the layout may seem a bit different. This is the format I found most efficient for relaying our trades.
Our goal is to maximize the value of our portfolio. We don’t have unlimited cash because our portfolio has to exist in reality. That means making some tough choices and sometimes selling a share we don’t really want to sell. This is one of those cases where we gave up a very good deal to get an even better deal. This is an ongoing process. When we get a better opportunity, we would be happy to change again.
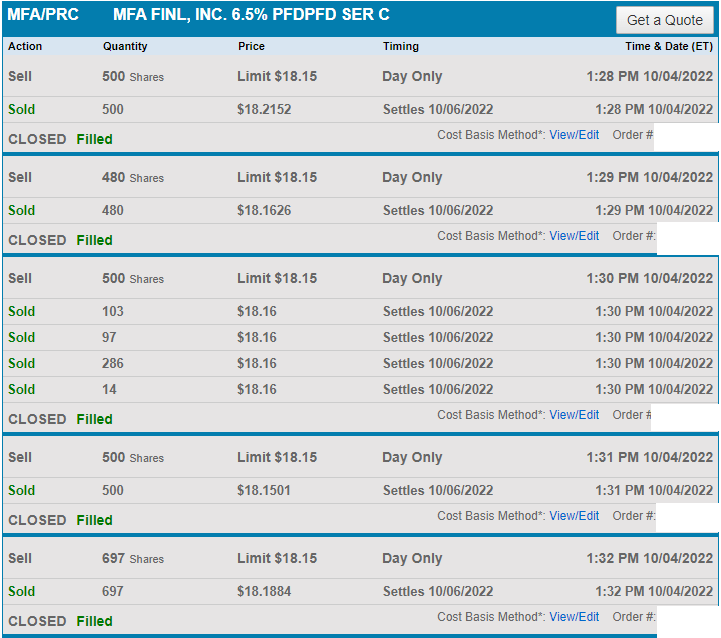
Trades Placed
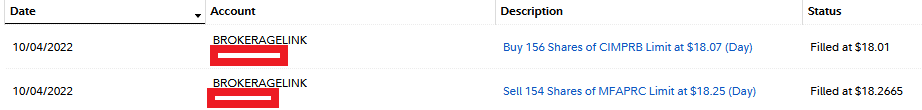
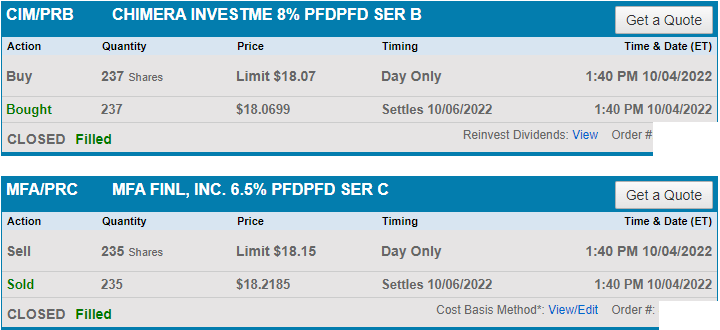
- Sold 3,591 shares of MFA-C (MFA.PC) at $18.17866 per share (weighted average) for proceeds of $65,283.15.
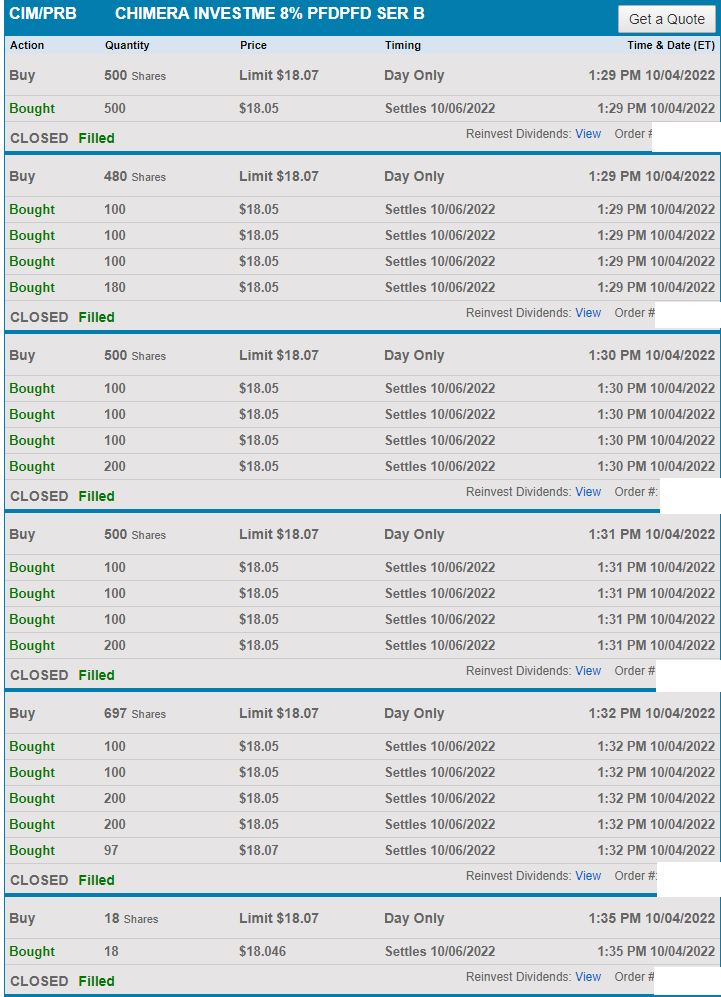
- Used proceeds to buy 3,616 shares of CIM-B (CIM.PB) at $18.05019 per share for a total cost of $65,269.47.
The total transaction values are very similar as this move was intended to reallocate within the portfolio.
Other viable options for buyers include CIM-C (CIM.PC) and CIM-D (CIM.PD). Either would’ve met my goals well. These are also deep within our target buying ranges.
Brief Commentary
Sometimes we get the opportunity to swap between relatively similar preferred shares at attractive ratios. While MFA-C still looks much too cheap, the CIM fixed-to-floating preferred shares had a clear edge.
CIM-B had a slightly lower share price despite offering
- Lower risk rating: 3.0 vs. 3.5
- Higher initial coupon rate: 8.0% vs. 6.5%
- Early floating date: 3/30/2024 vs. 3/31/2025
- Larger floating spread: 5.791% vs. 5.345%
Consequently, it’s no surprise it also offered a larger discount to our target prices (22% vs 27%).
The Chart
For this chart, I want to use a simple price comparison. Shares may have a slightly different ex-dividend date (though it’s very close), but the chart is very simple to read:
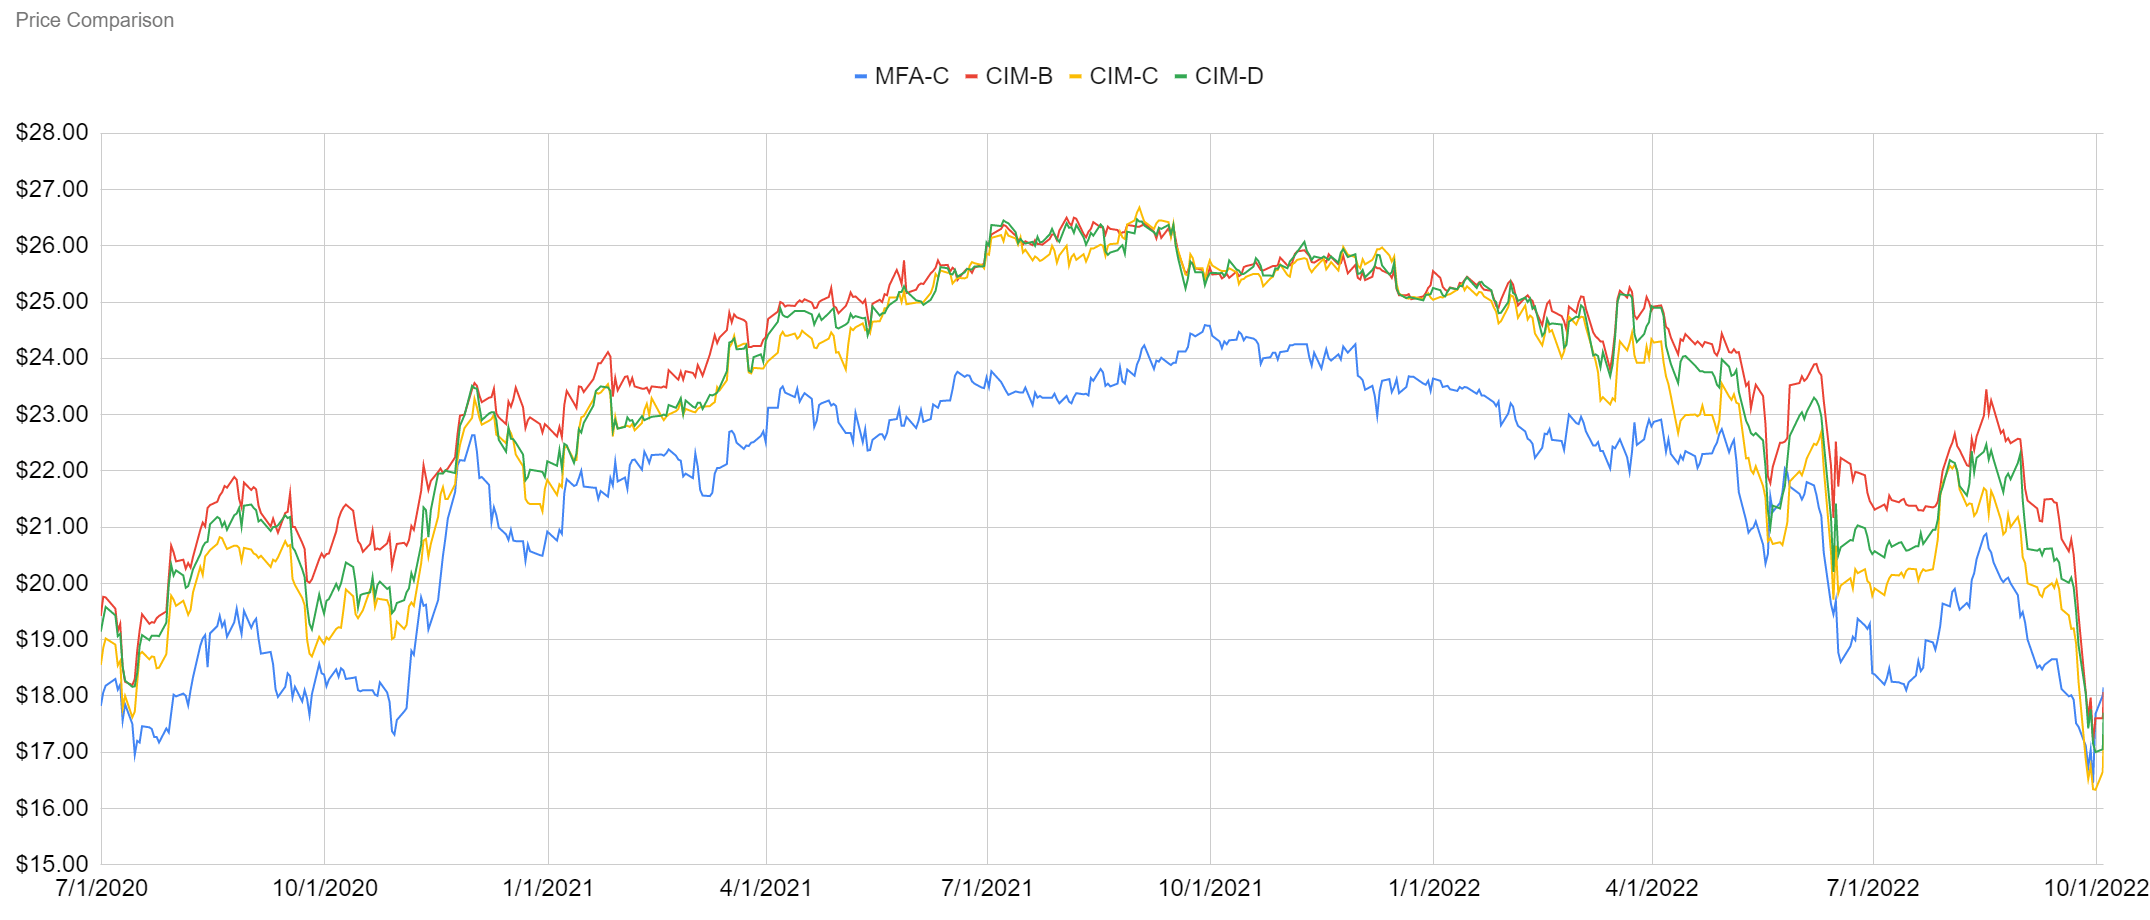
The REIT Forum
When looking at the price per share, MFA-C usually has a lower share price than any of the fixed-to-floating preferred shares. The same scenario was also true during the pandemic and just prior to the pandemic (MFA-C was issued just before it).
We told investors for many months that MFA-C was the better deal. That the price disparity between shares was simply too large. The market refused to agree, up until about two weeks ago. Then it overcorrected and we ended up with a great opportunity to make this swap.
The idea was first called out in chat by a REIT Forum member who noticed that MFA-C was trading above the CIM preferred shares in a very unusual move. He was precisely right. This was a nice opportunity to swap.
Account
These trades went through our tax-advantaged accounts. No benefit for a capital loss, but no penalty if we take capital gains later. We may get another opportunity to swap between shares in the future and we like to make those trades without considering any tax consequences.
We previously provided a brief guide on utilizing tax-advantaged accounts.
Execution
I used several smaller trades to move the position to reduce the risk of being unable to complete the second side of the trade.
Fidelity
Schwab

Schwab
Schwab
Schwab
Yeah, it took quite a few trades to move that many shares. They were also spread across different tax-advantaged accounts. For Schwab, that’s a solo 401k, traditional IRA, and Roth IRA.
Returns for Closed Positions
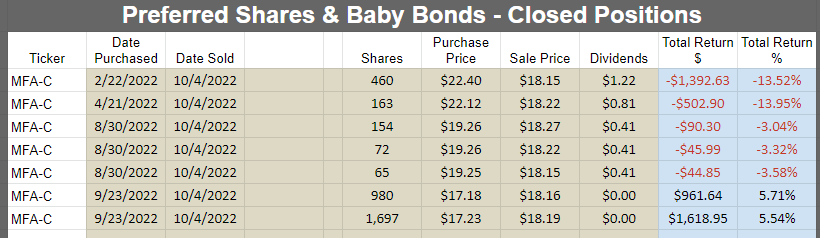
The REIT Forum
Thanks to buying so many shares at such a low price, we ended up with a net profit of about $500. That’s better than expected given the carnage in the sector lately.
However, the real purpose of this trade was simply to exchange our MFA-C for CIM-B.
Returns for Open Positions
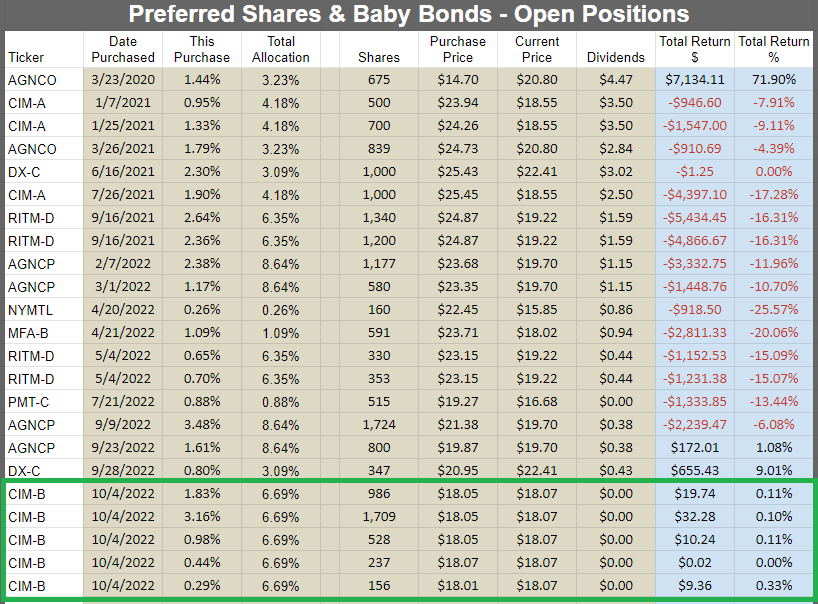
The REIT Forum
The latest trades are highlighted
Shares bumped higher while preparing the article for this trade alert, but CIM-D hasn’t bumped as much as CIM-B. Consequently, CIM-D looks like a superior choice at the moment.
Conclusion
MFA-C is still cheap with a big discount to our target prices. However, the CIM fixed-to-floating preferred shares offered an even bigger discount. The disparity grew to the extent that CIM-B traded slightly below MFA-C.
For several months we argued that the gap between the shares was too wide as CIM-B costs about $2.00 more than MFA-C on average. When MFA-C outperformed (thanks to the CIM preferred shares plunging), it created a material shift in the relative values.
Previously the market was valuing my 3,591 shares of MFA-C as being worth about 3,294 shares of CIM-B. I felt MFA-C was better in that case.
However, today the market felt 3,591 shares of MFA-C was worth 3,616 shares of CIM-B. In that case, I would rather have the CIM-B.
Update
Since sending out the alert above, CIM-B rallied and MFA-C declined. The gap between the two share prices (currently $1.24) is still lower than average by historical standards (around $2.00), but it was in clear homerun territory for the trade (negative $.13).
We’re not emotionally invested in CIM-B. We are not attached to the shares in any way. When we have a better option for where to deploy the capital, we are perfectly fine with making that trade. While the market is pretty rough today, we’re simply looking to maximize our positions.
The rest of the charts in this article may be self-explanatory to some investors. However, if you’d like to know more about them, you’re encouraged to see our notes for the series. The part below is reproduced in each article to provide investors with easy access to the updated charts. It is my gift to readers.
Stock Table
We will close out the rest of the article with the tables and charts we provide for readers to help them track the sector for both common shares and preferred shares.
We’re including a quick table for the common shares that will be shown in our tables:
Let the images begin!
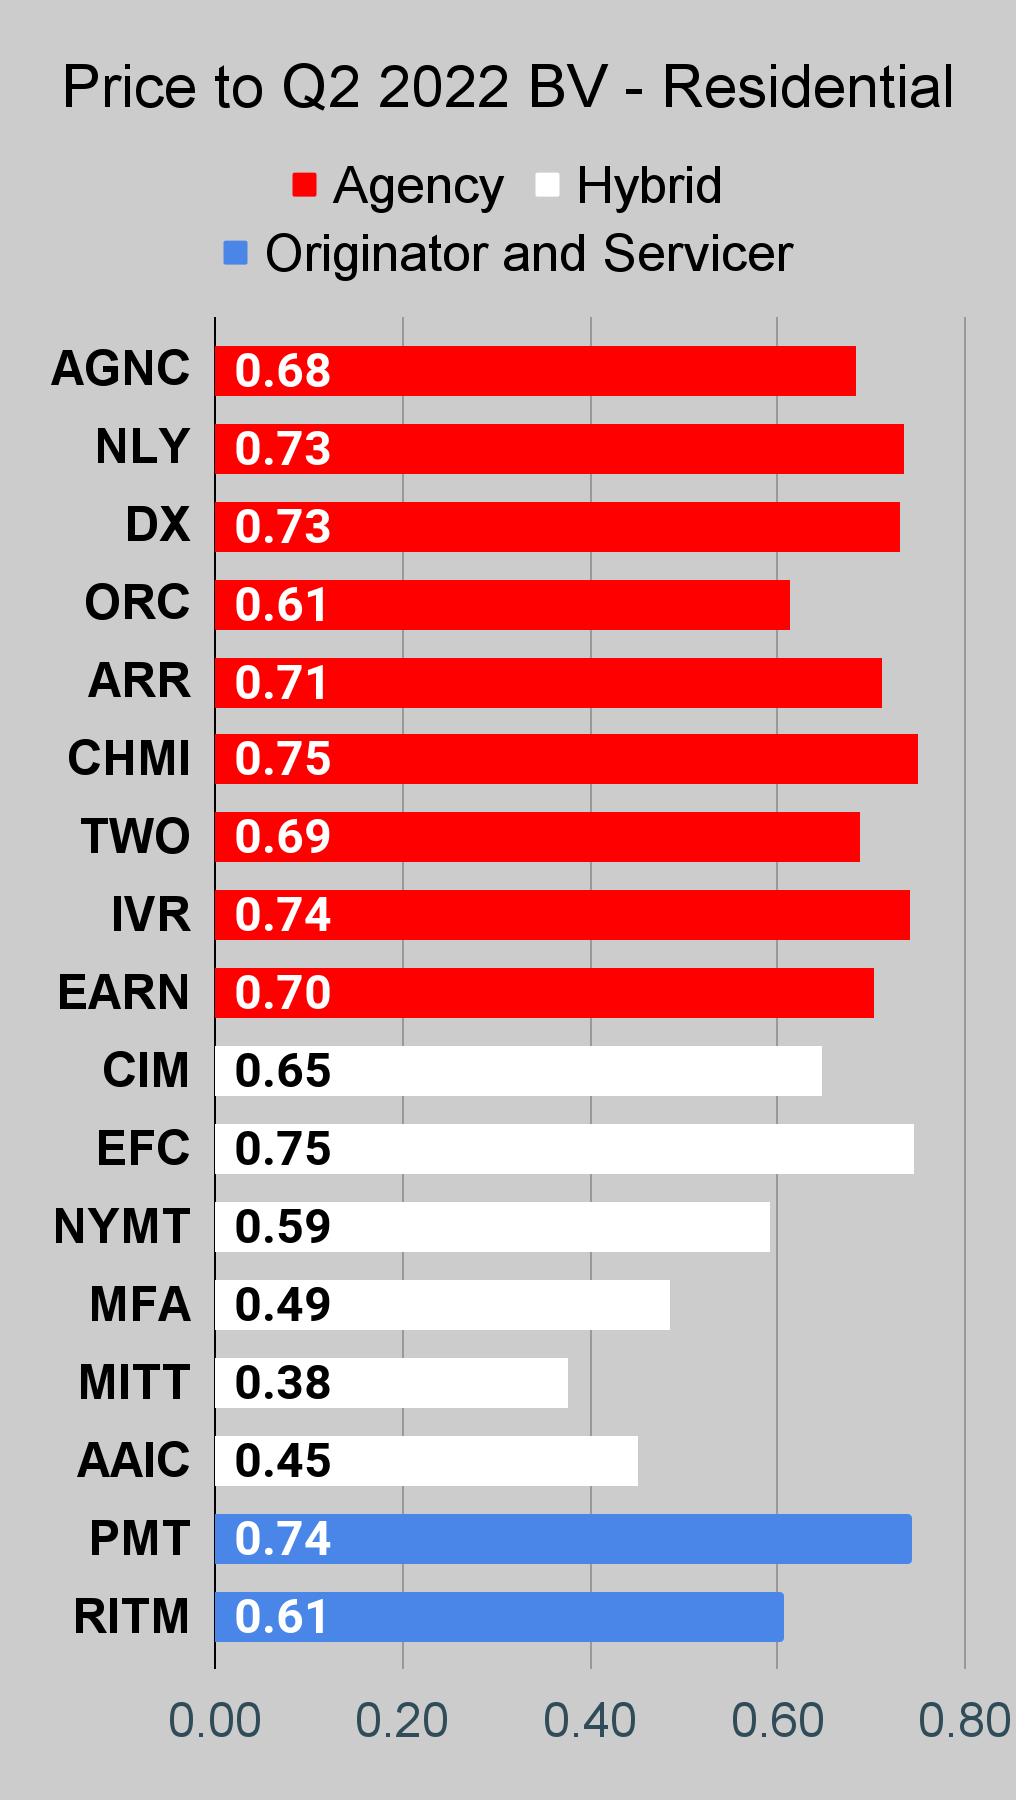
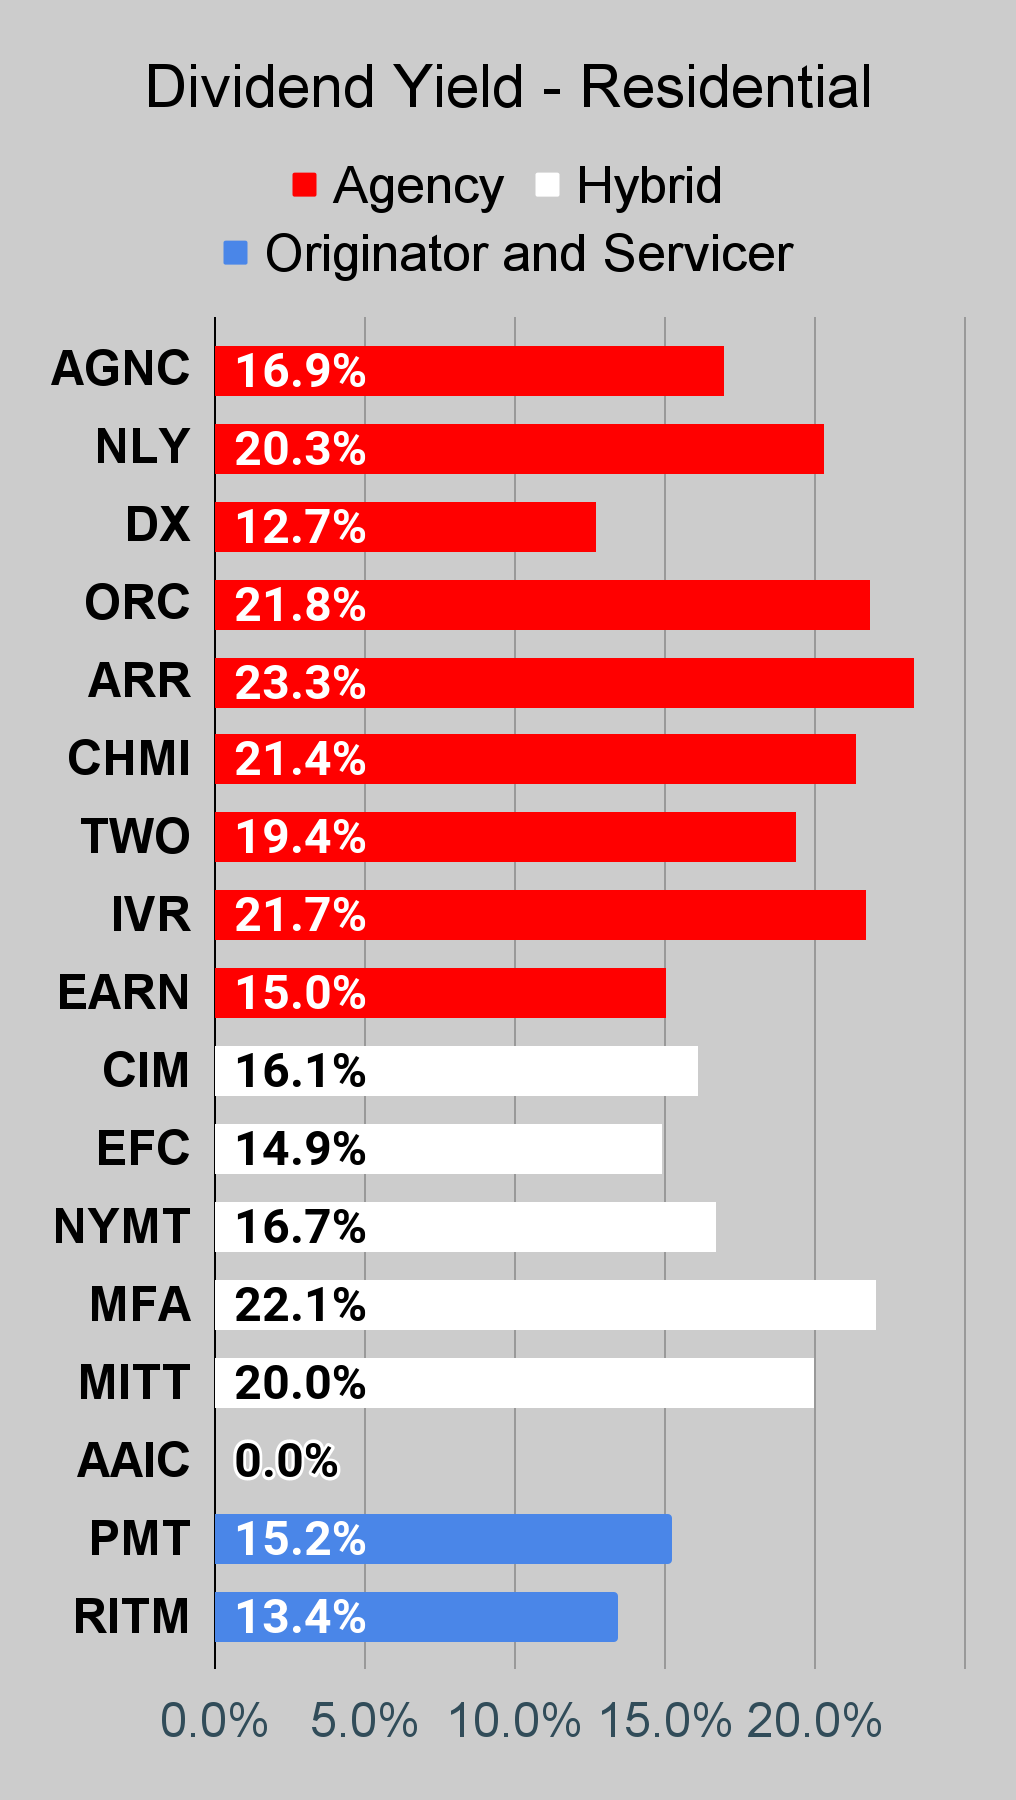
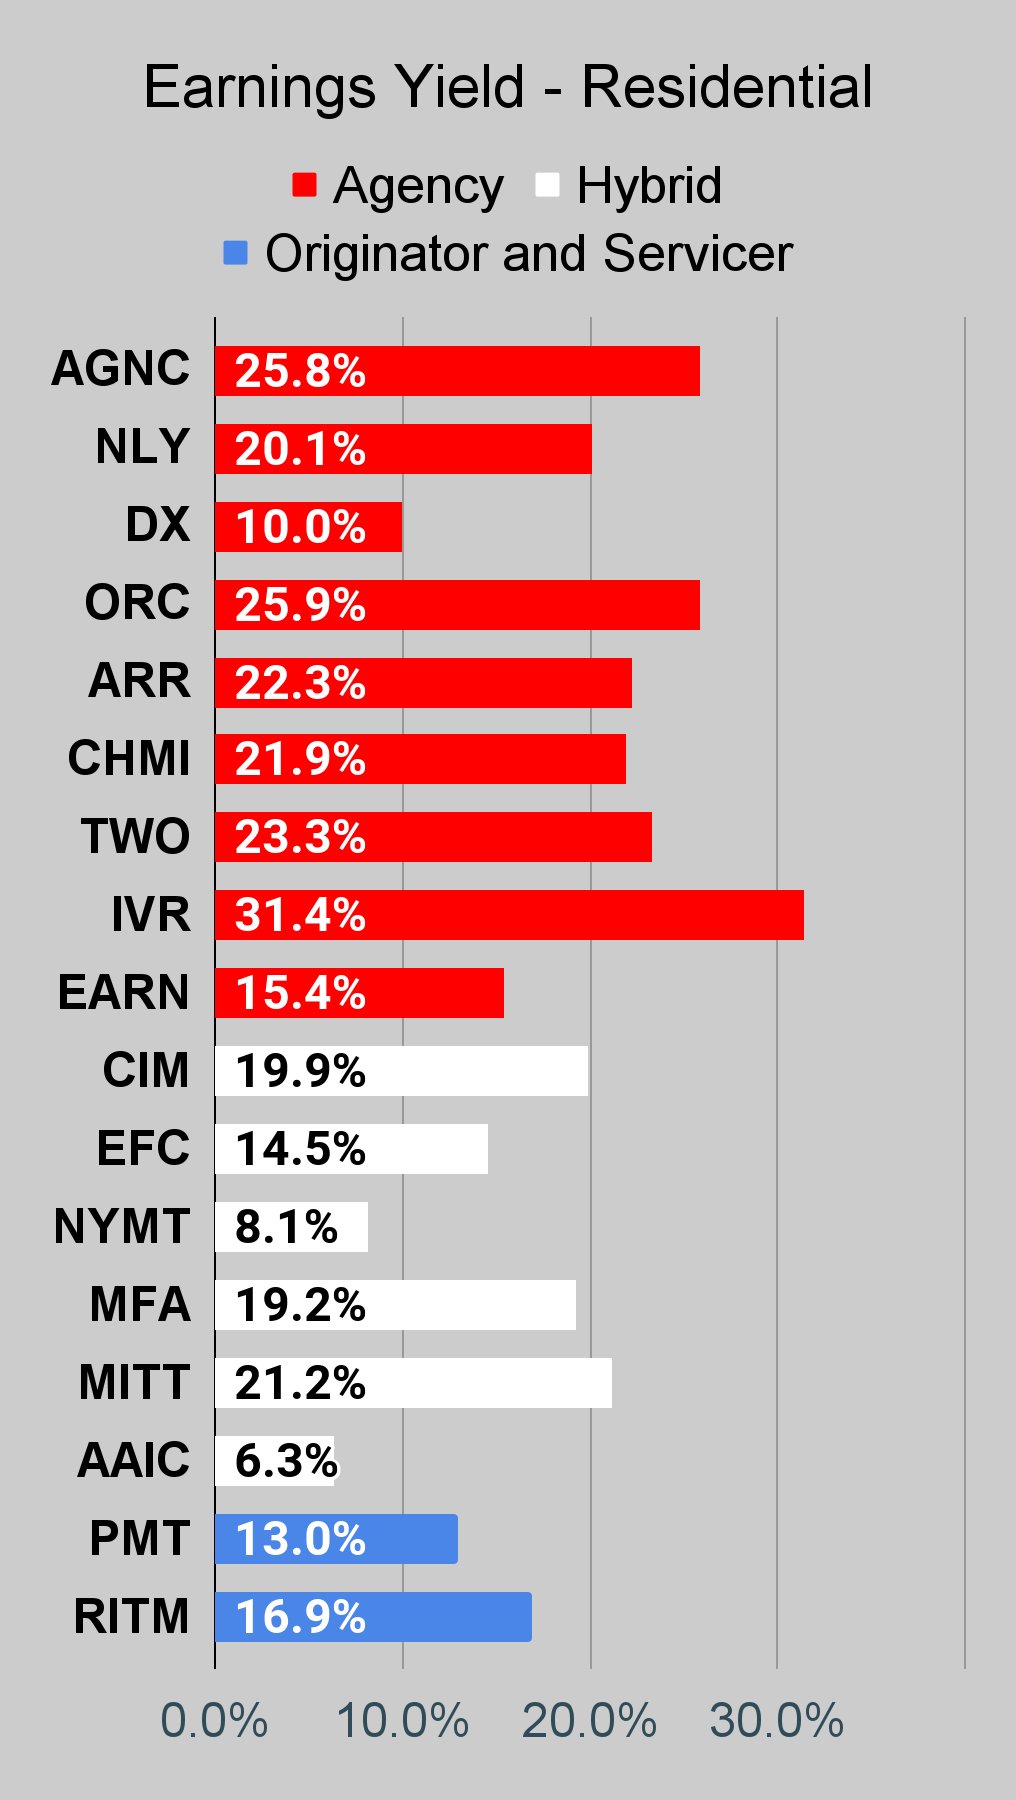
Residential Mortgage REIT Charts
Note: The chart for our public articles uses the book value per share from the latest earnings release. Current estimated book value per share is used in reaching our targets and trading decisions. It is available in our service, but those estimates are not included in the charts below.
 The REIT Forum |
 The REIT Forum |
 The REIT Forum |
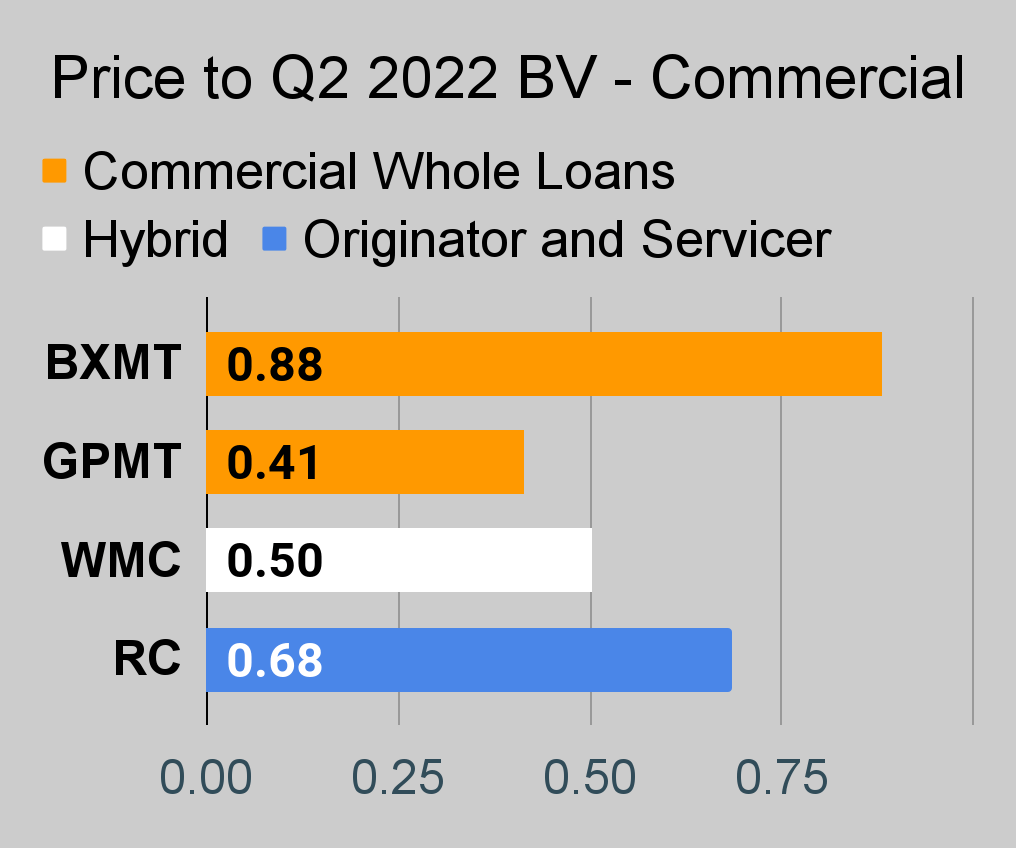
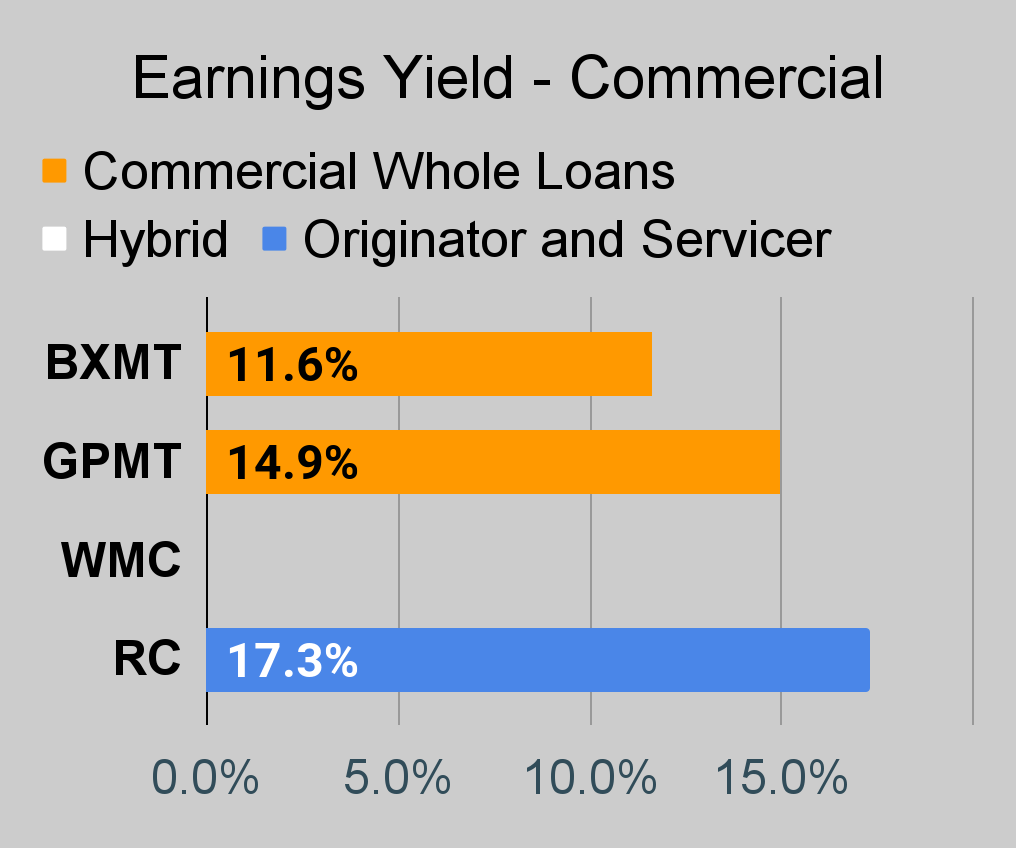
Commercial Mortgage REIT Charts
 The REIT Forum |
 The REIT Forum |
 The REIT Forum |
BDC Charts
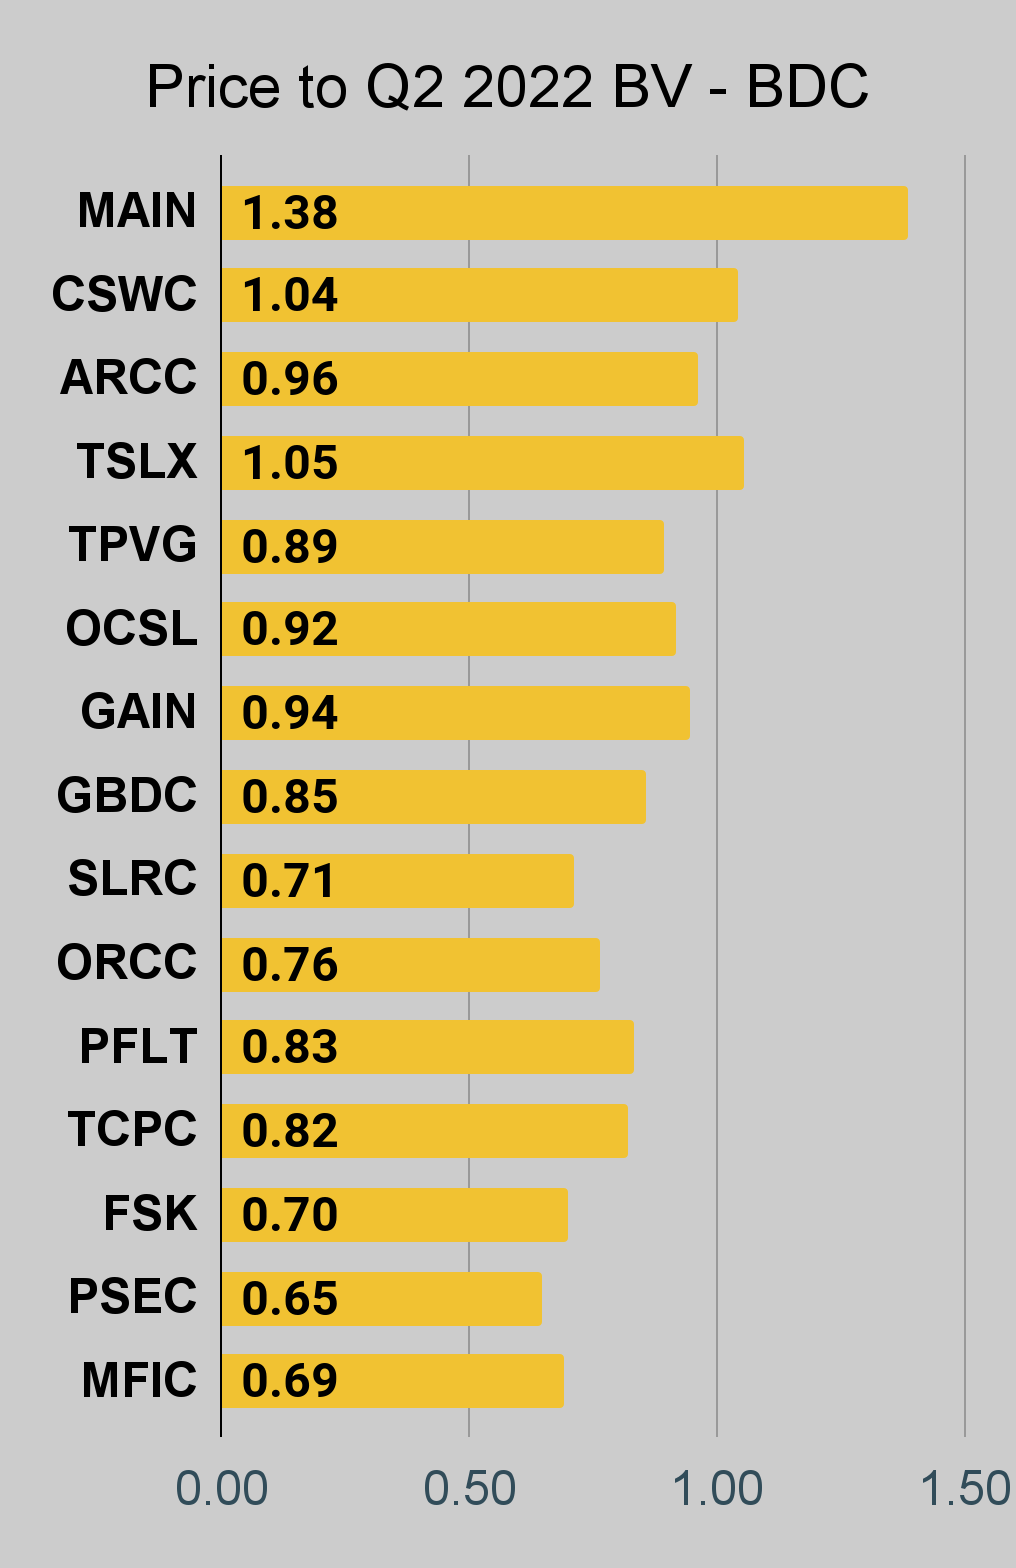 The REIT Forum |
 The REIT Forum |
 The REIT Forum |
Preferred Share Charts
I changed the coloring a bit. We needed to adjust to include that the first fixed-to-floating shares have transitioned over to floating rates.
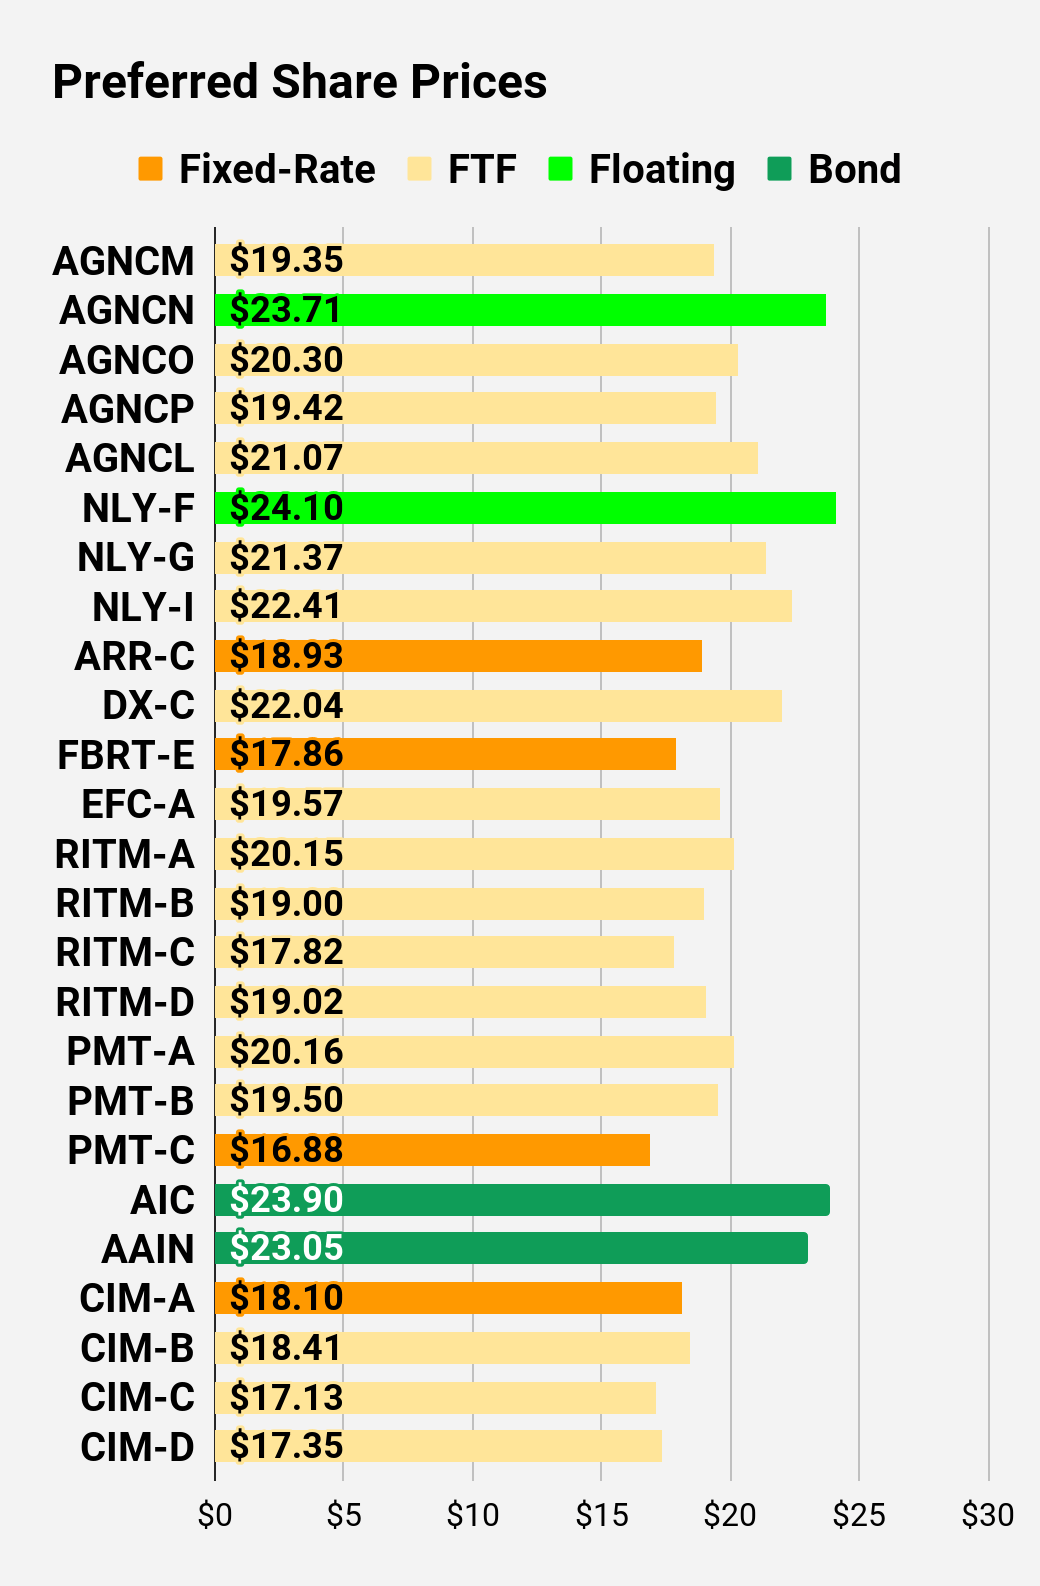 The REIT Forum |
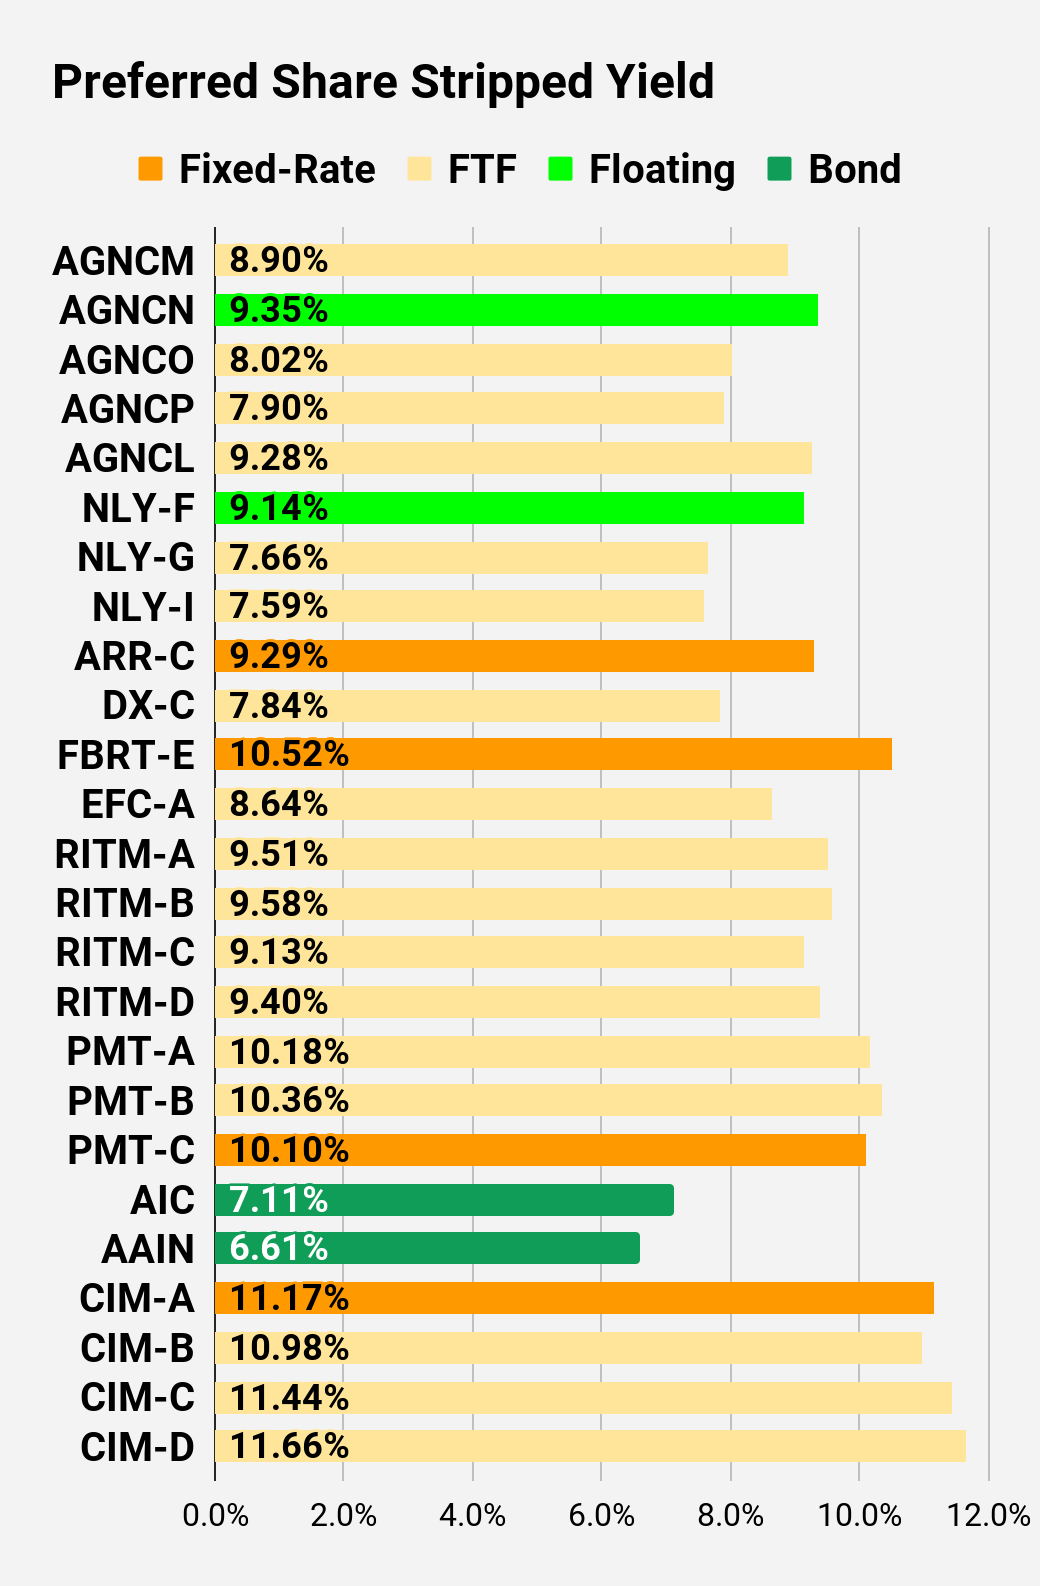 The REIT Forum |
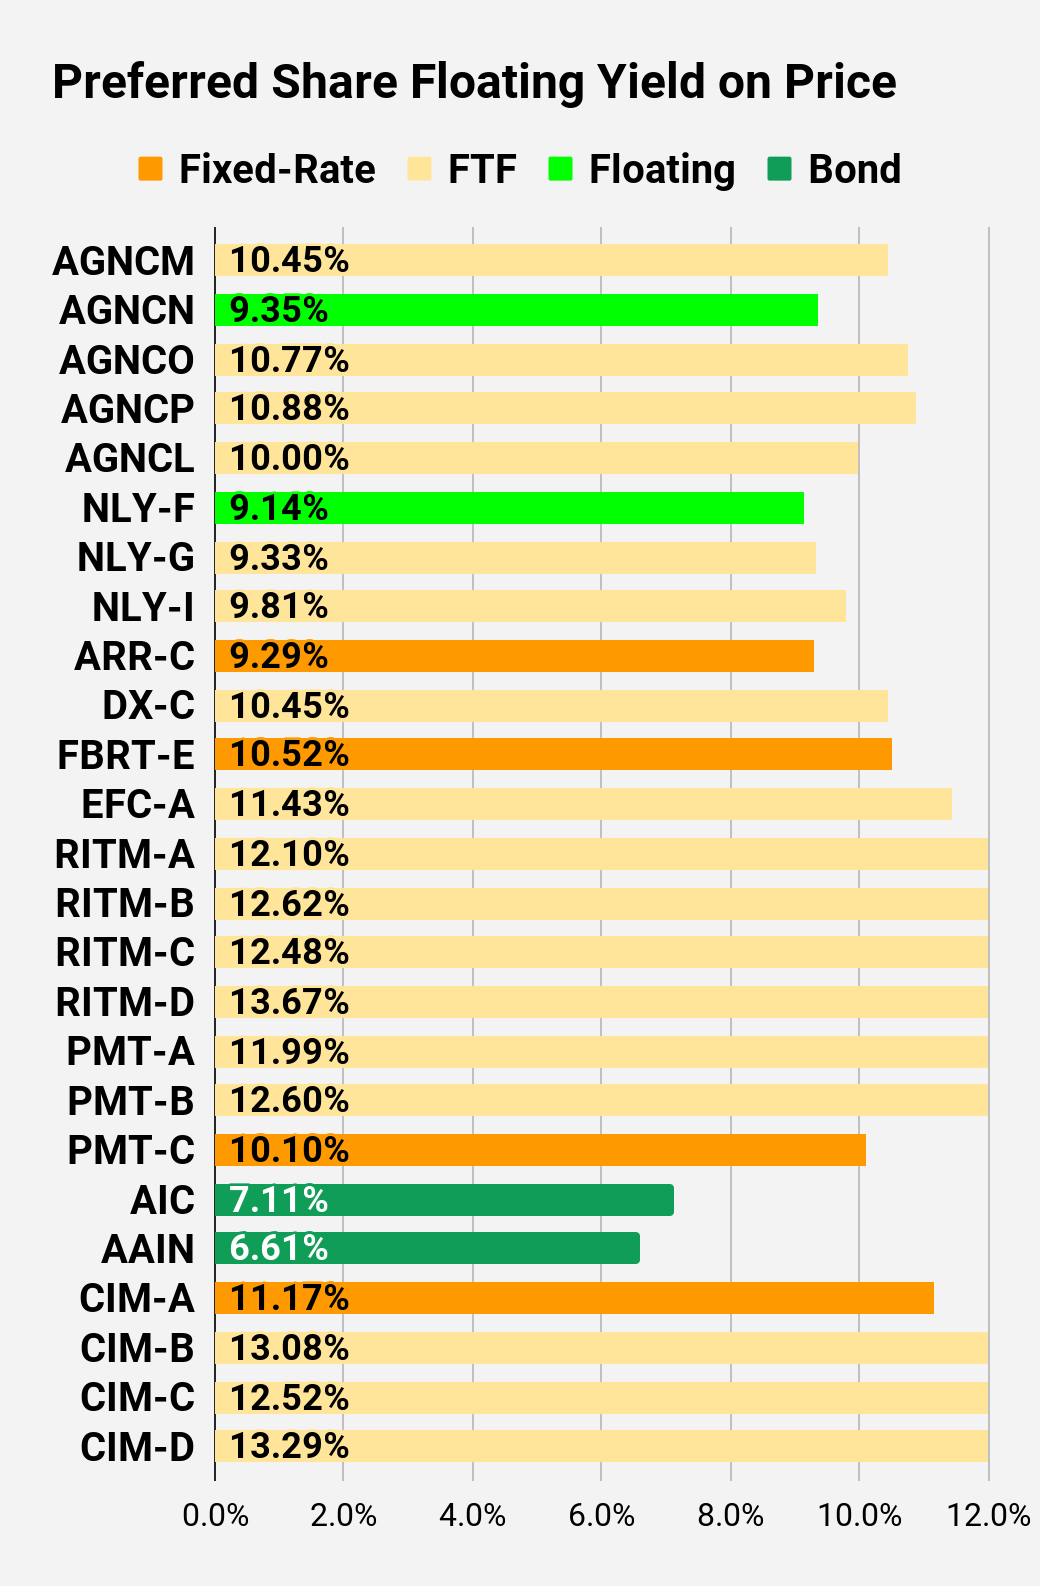 The REIT Forum |
 The REIT Forum |
 The REIT Forum |
 The REIT Forum |
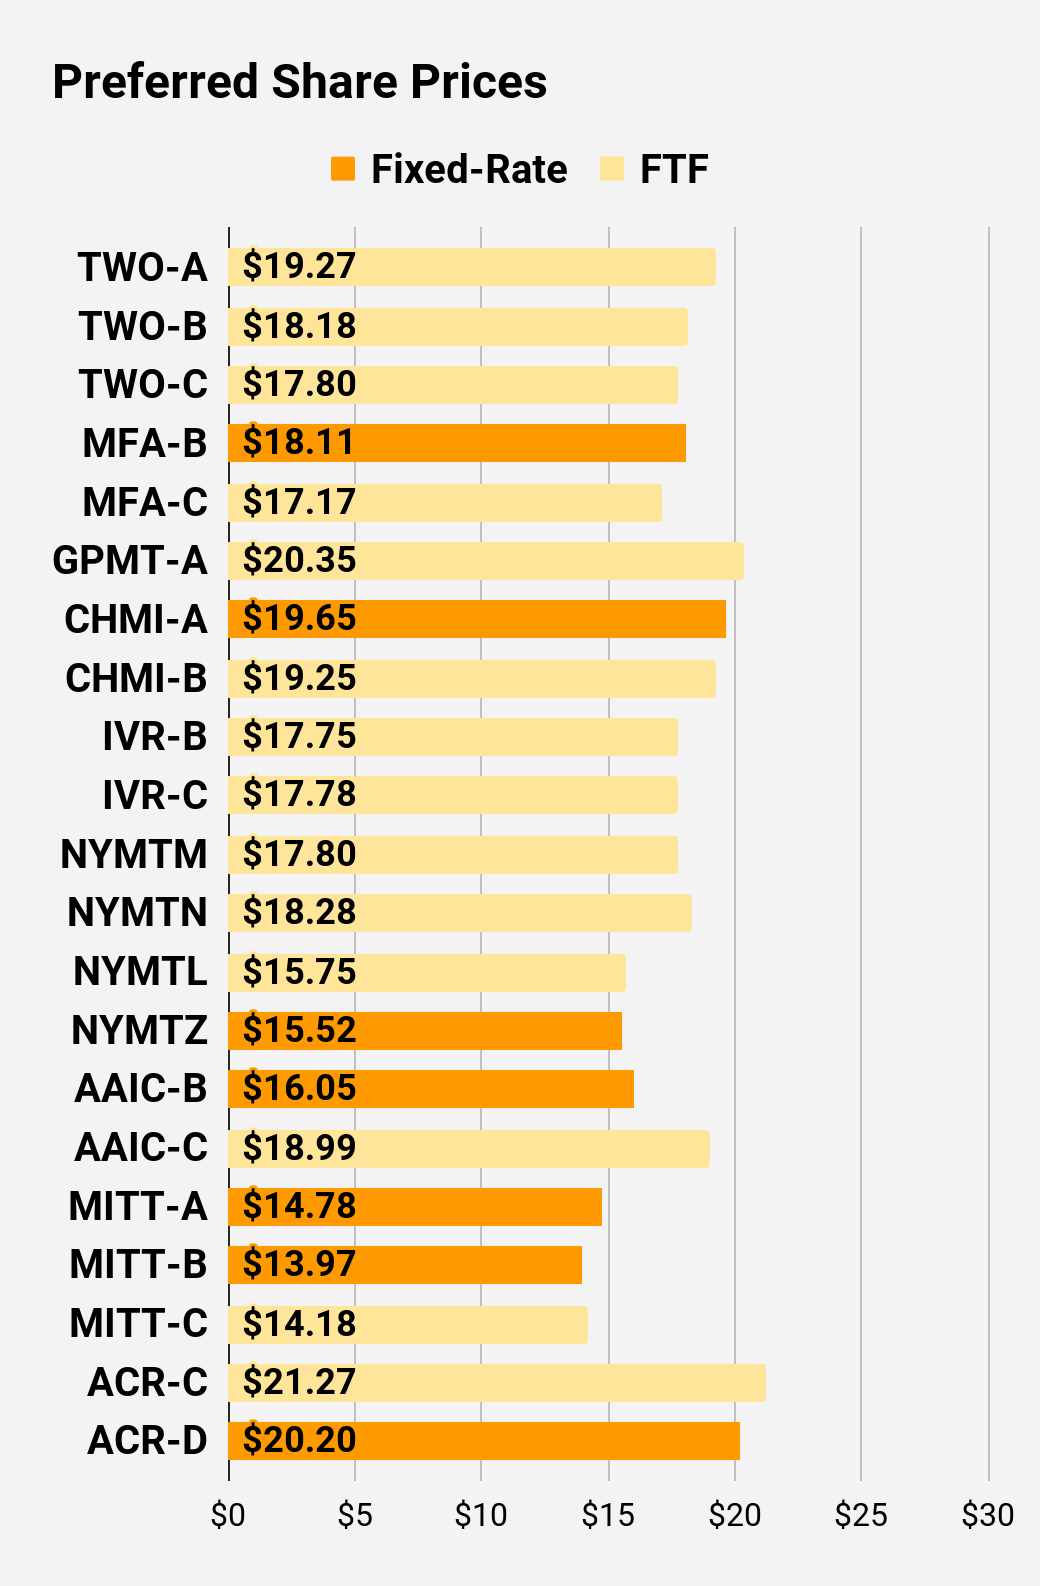
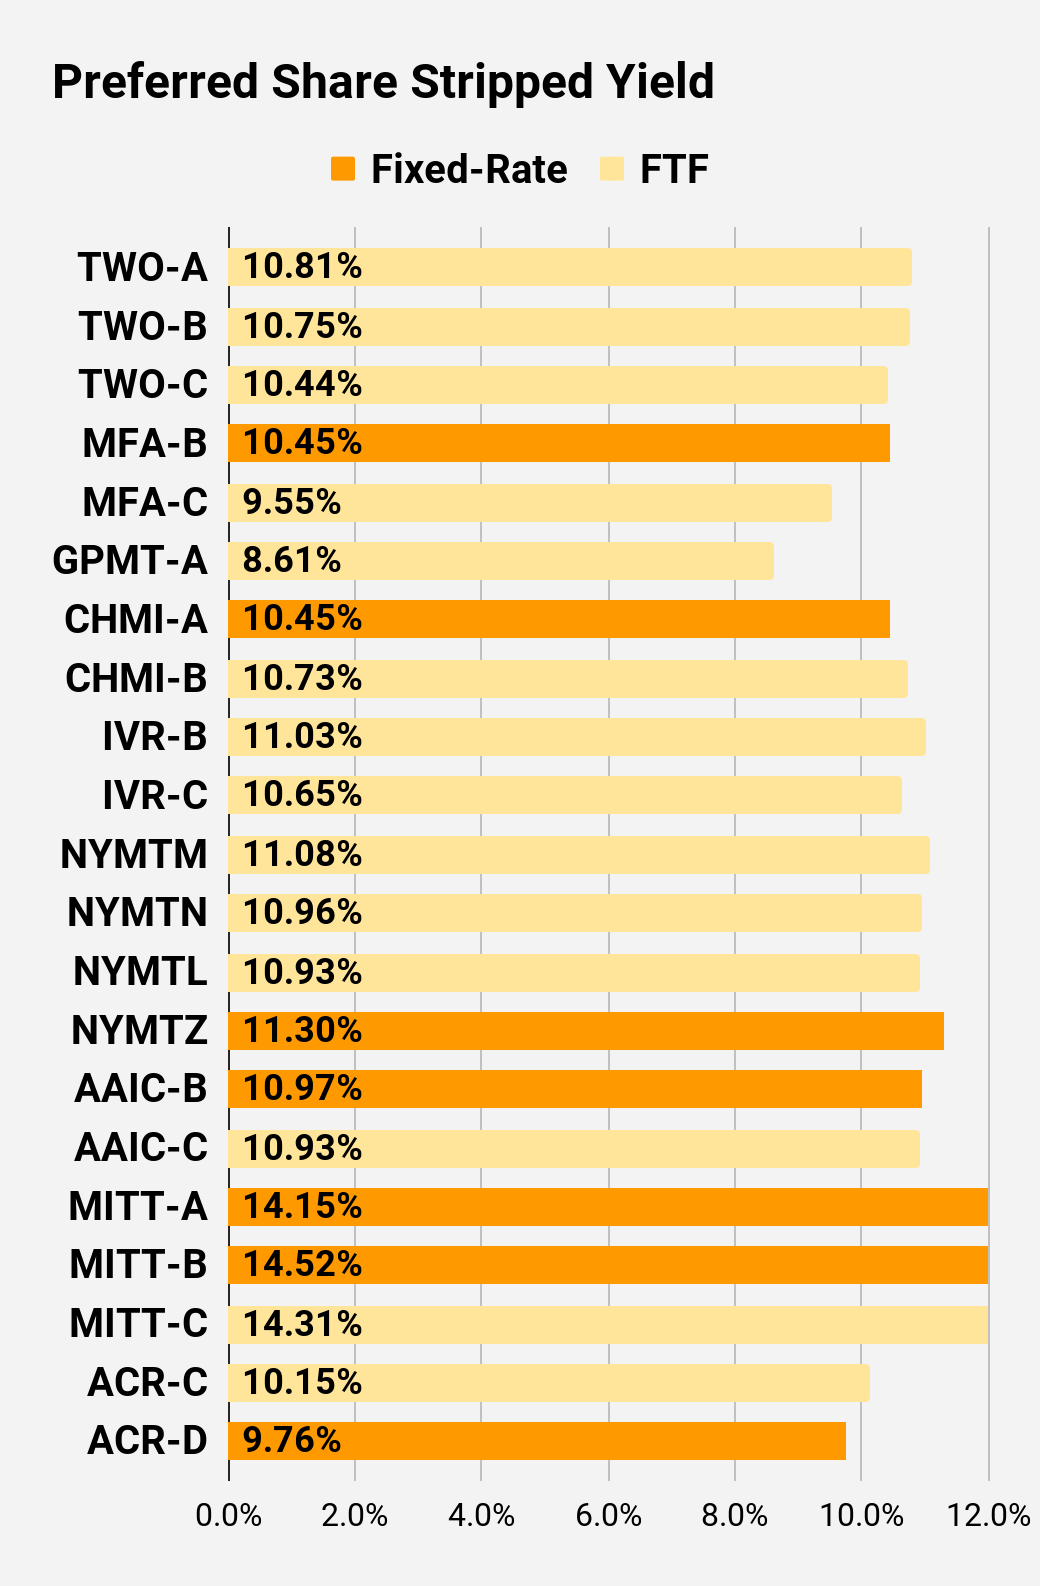
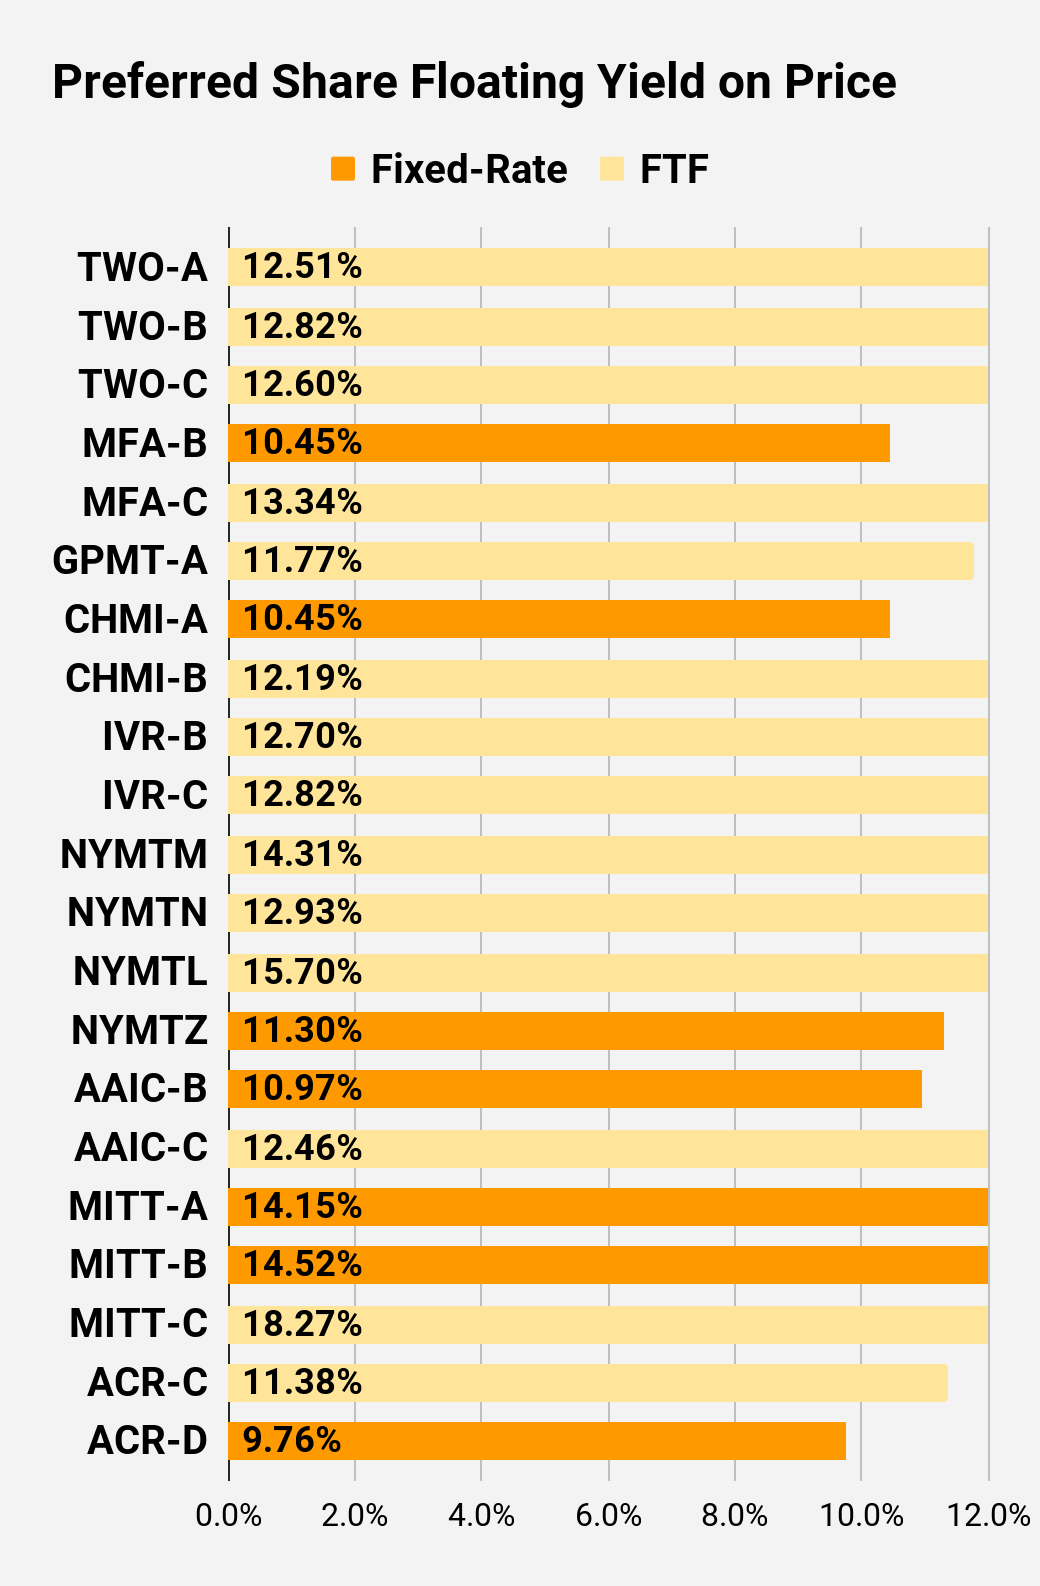
Preferred Share Data
Beyond the charts, we’re also providing our readers with access to several other metrics for the preferred shares.
After testing out a series on preferred shares, we decided to try merging it into the series on common shares. After all, we are still talking about positions in mortgage REITs. We don’t have any desire to cover preferred shares without cumulative dividends, so any preferred shares you see in our column will have cumulative dividends. You can verify that by using Quantum Online. We’ve included the links in the table below.
To better organize the table, we needed to abbreviate column names as follows:
- Price = Recent Share Price – Shown in Charts
- BoF = Bond or FTF (Fixed-to-Floating)
- S-Yield = Stripped Yield – Shown in Charts
- Coupon = Initial Fixed-Rate Coupon
- FYoP = Floating Yield on Price – Shown in Charts
- NCD = Next Call Date (the soonest shares could be called)
- Note: For all FTF issues, the floating rate would start on NCD.
- WCC = Worst Cash to Call (lowest net cash return possible from a call)
- QO Link = Link to Quantum Online Page
Second Batch:
Strategy
Our goal is to maximize total returns. We achieve those most effectively by including “trading” strategies. We regularly trade positions in the mortgage REIT common shares and BDCs because:
- Prices are inefficient.
- Long-term, share prices generally revolve around book value.
- Short-term, price-to-book ratios can deviate materially.
- Book value isn’t the only step in analysis, but it is the cornerstone.
We also allocate to preferred shares and equity REITs. We encourage buy-and-hold investors to consider using more preferred shares and equity REITs.
Performance
We compare our performance against 4 ETFs that investors might use for exposure to our sectors:

The REIT Forum
The 4 ETFs we use for comparison are:
|
Ticker |
Exposure |
|
One of the largest mortgage REIT ETFs |
|
|
One of the largest preferred share ETFs |
|
|
Largest equity REIT ETF |
|
|
The high-yield equity REIT ETF. Yes, it has been dreadful. |
When investors think it isn’t possible to earn solid returns in preferred shares or mortgage REITs, we politely disagree. The sector has plenty of opportunities, but investors still need to be wary of the risks. We can’t simply reach for yield and hope for the best. When it comes to common shares, we need to be even more vigilant to protect our principal by regularly watching prices and updating estimates for book value and price targets.
Ratings:
- Bullish on CIM-B, CIM-C, CIM-D, MFA-C
Be the first to comment