

Just counting up my dividends new look casting/iStock via Getty Images
Get ready for charts, images, and tables because they are better than words. The ratings and outlooks we highlight here come after Scott Kennedy’s weekly updates in the REIT Forum. Your continued feedback is greatly appreciated, so please leave a comment with suggestions.
I’ve been working on educational articles for most of the day. They can be great, but they often take a bit longer. It’s time to toss out some quick ratings instead. We’ll go over a bunch of shares and my thoughts on them.
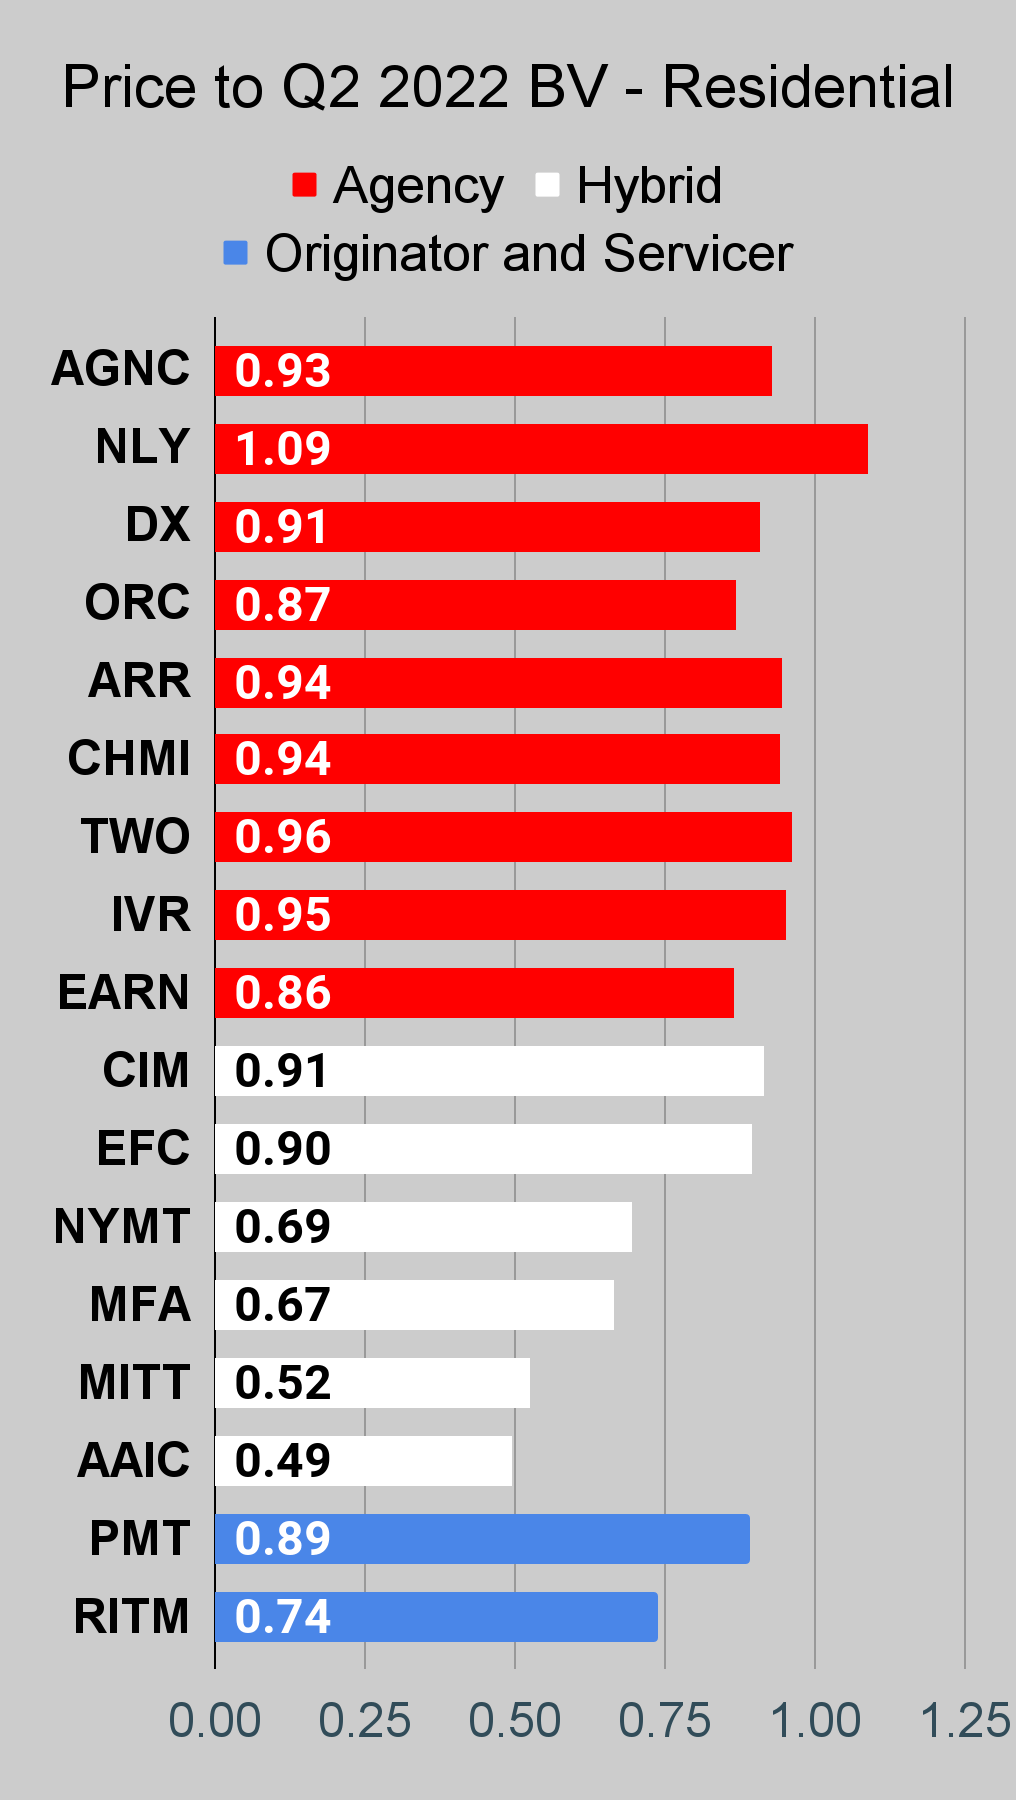
Annaly Capital Management (NLY): Price to book is too high. There are much better alternatives. I’ll go over this in more detail in some future article. The simple premise is that investors get far more for their dollar if they buy some of the other mortgage REITs. There is nothing sacred about NLY that merits this premium to book value.
Dynex Capital (DX): A much smaller peer for NLY that outperformed dramatically over prior periods. With so much volatility in the markets for stocks and bonds, the smaller size gives DX the ability to change allocations much faster. I think that’s a nice advantage in this environment. Combined with a much more attractive price-to-book ratio, DX is a superior pick.
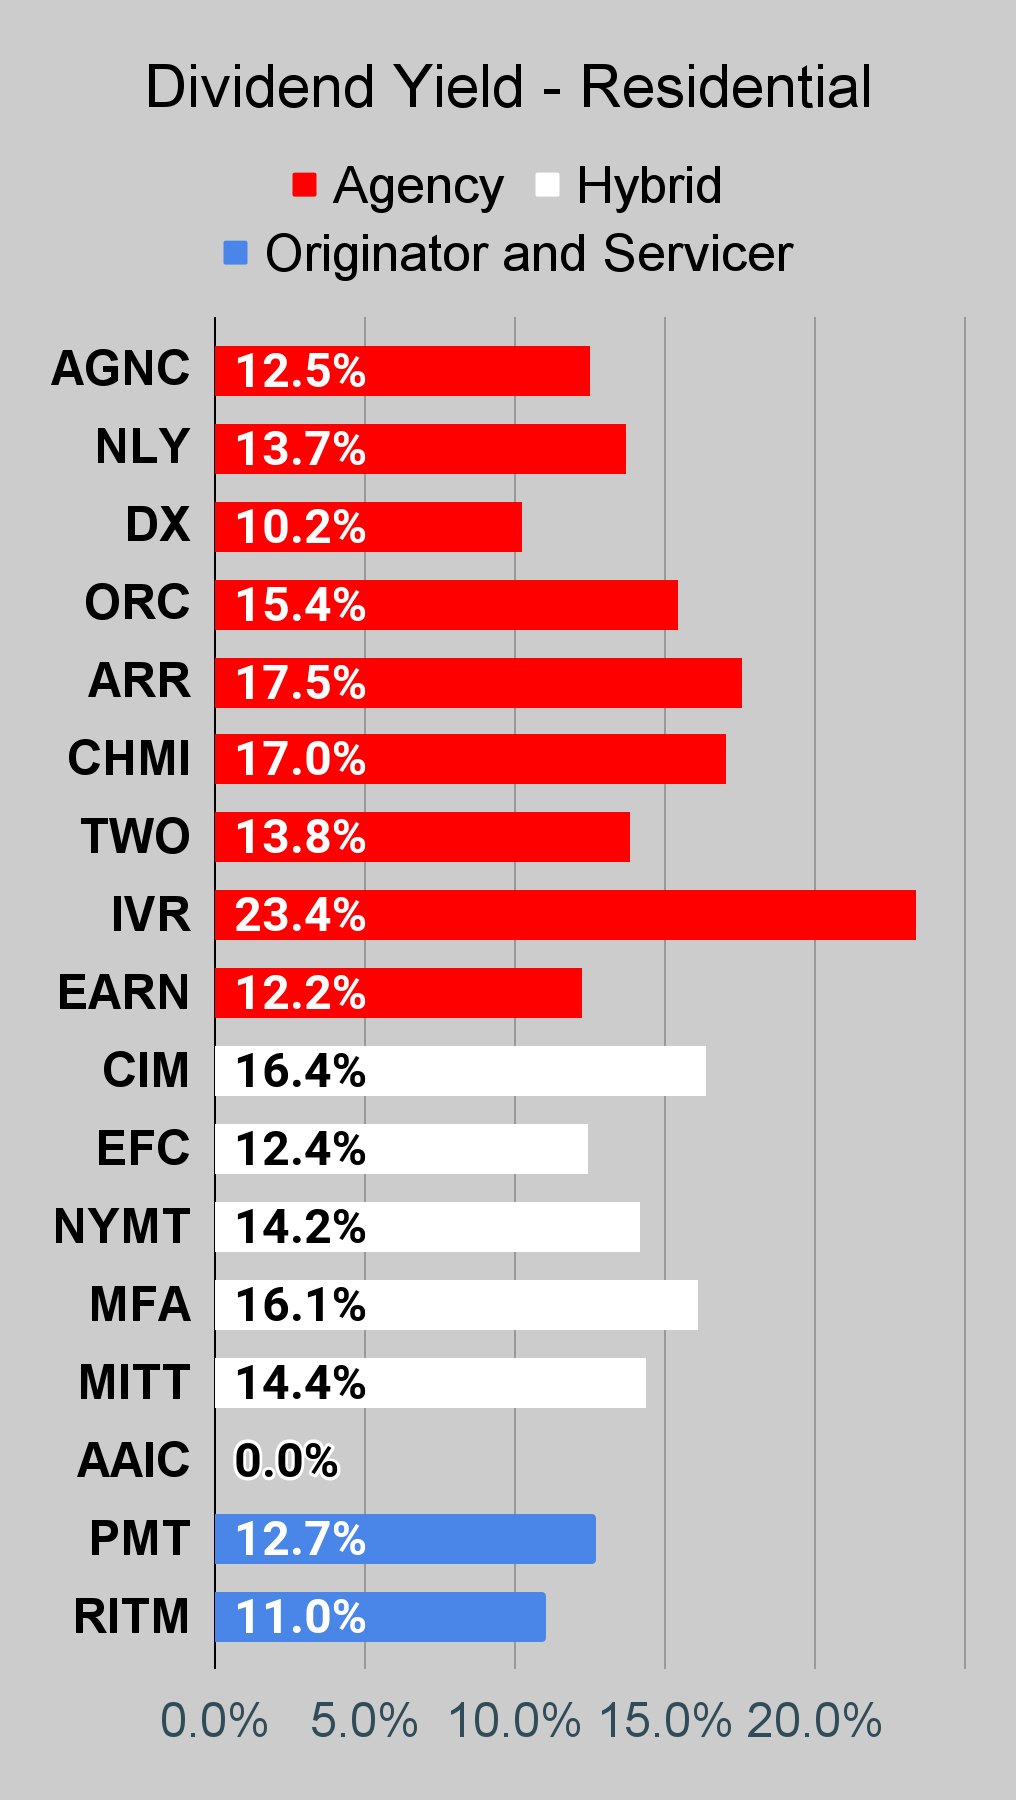
ARMOUR Residential REIT (ARR): Monthly dividend appears to some investors. So does that massive 17.5% dividend yield. Those investors are overpaying for yield and positioning themselves for weaker returns. Price-to-book is lower than NLY, but decisions about how to manage the REIT through the past many years haven’t delivered great value to shareholders. Yield trap. It’s not a matter of if the dividend gets reduced, it’s a matter of when.
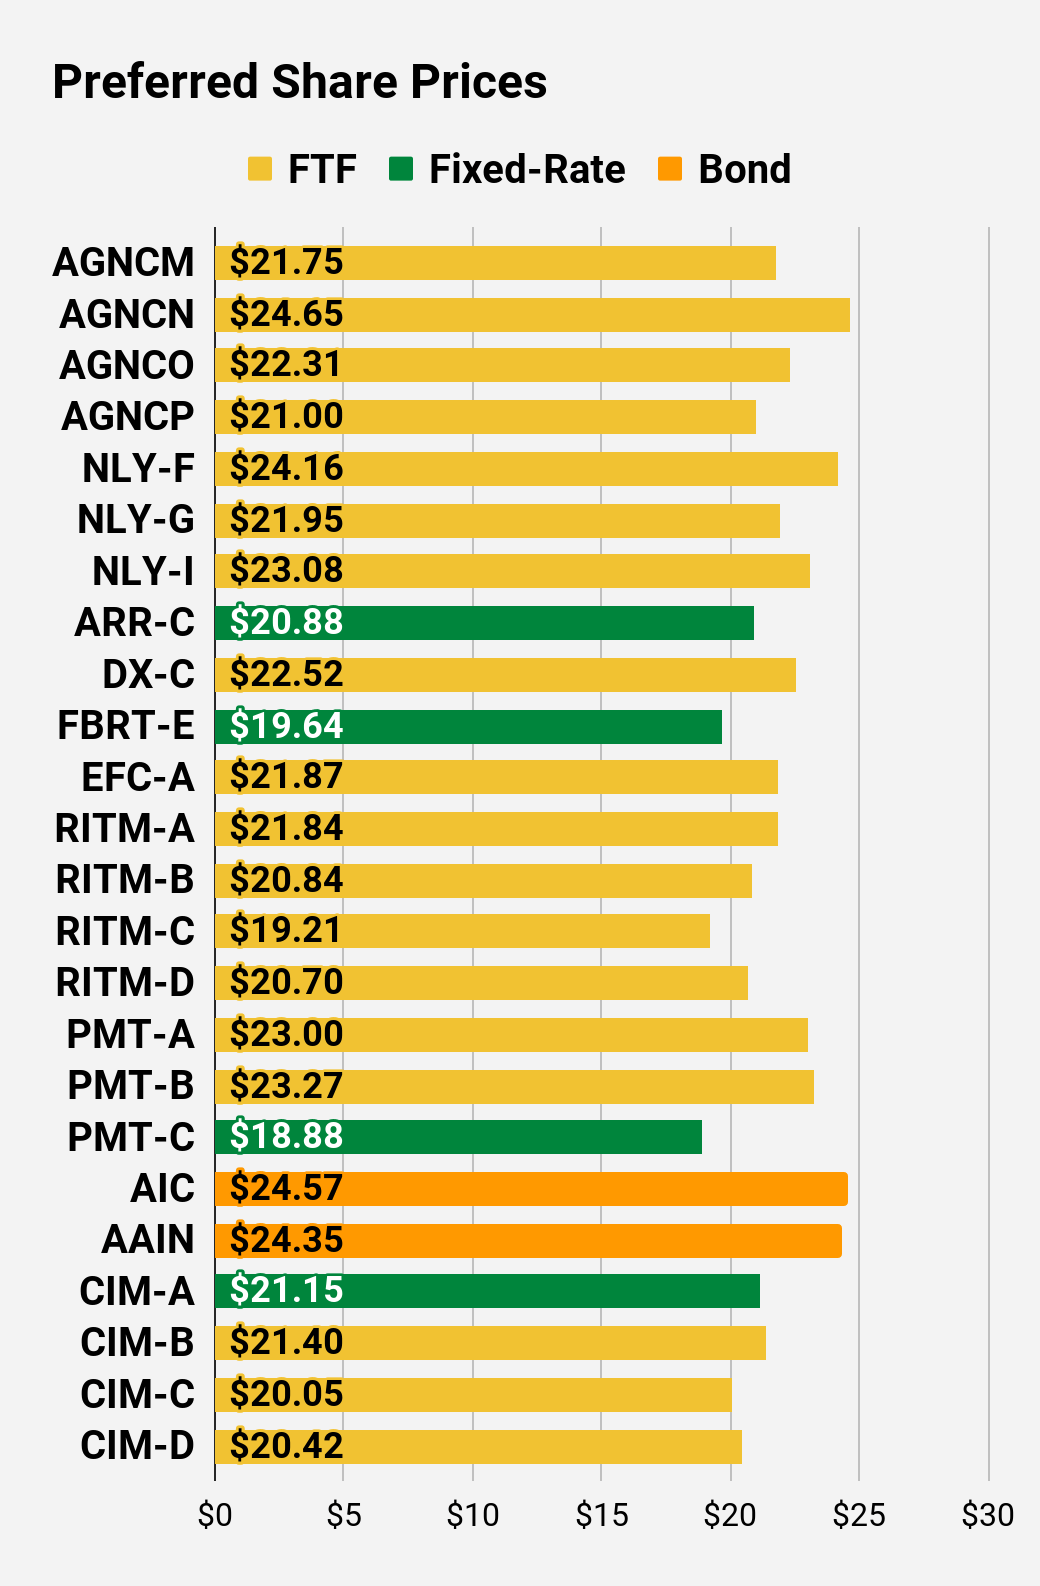
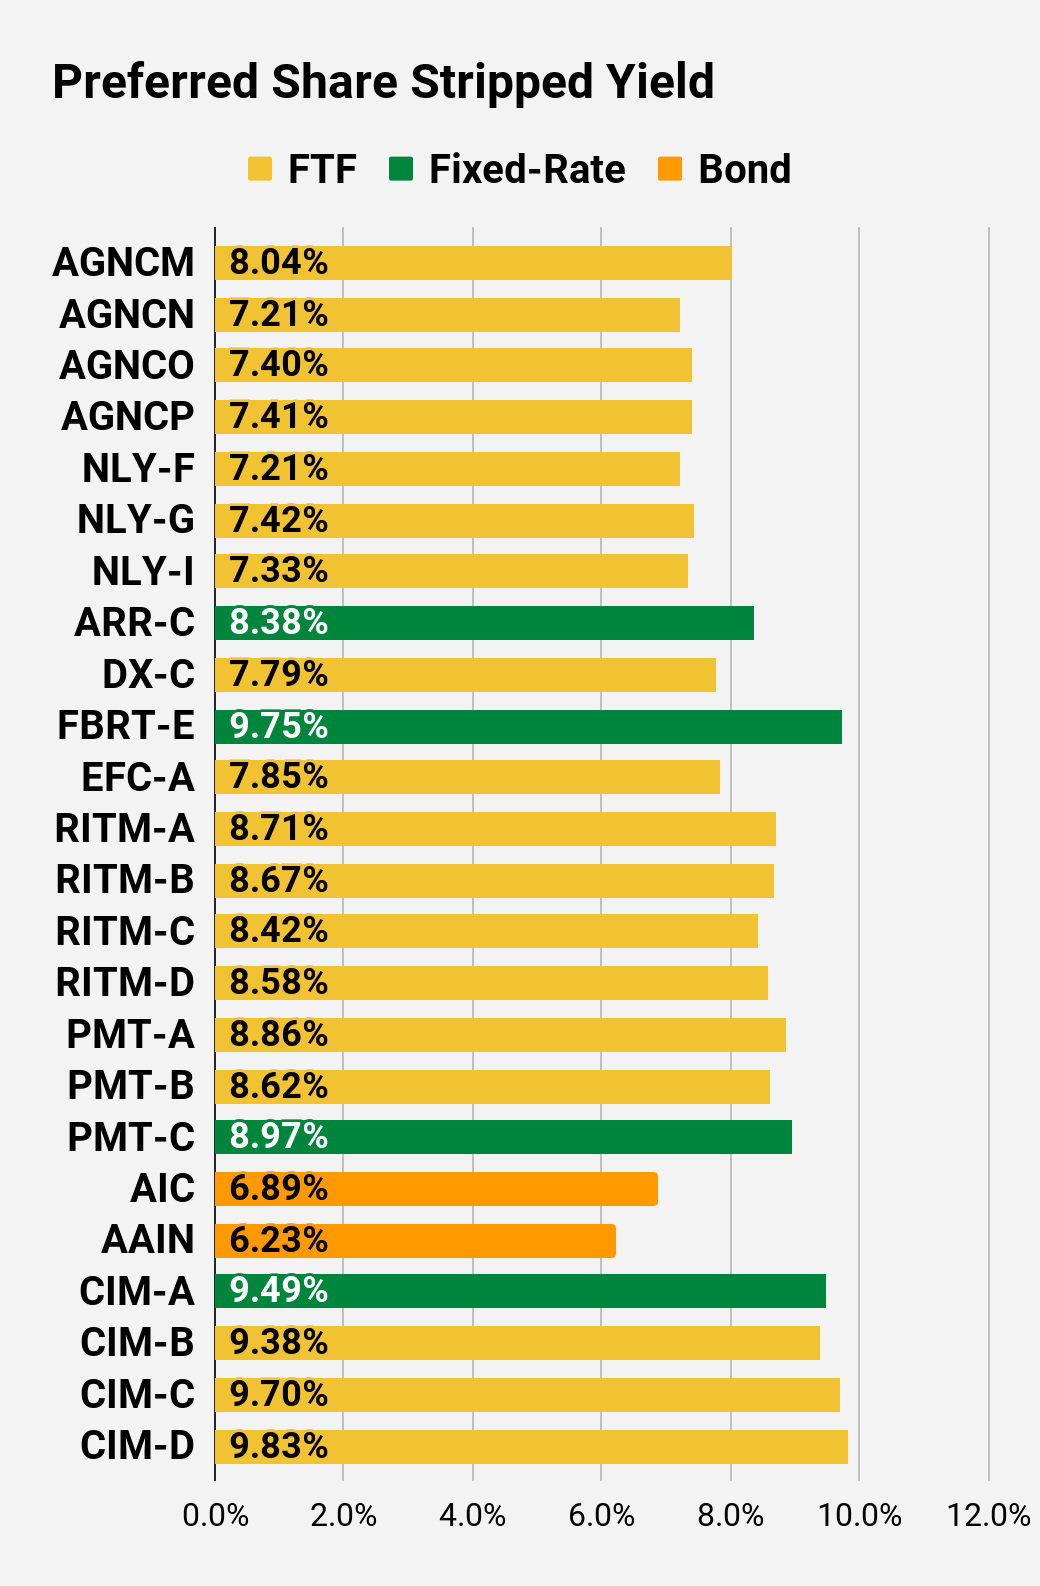
ARR-C (ARR.PC): This is a better way to have exposure to ARR. The dividend yield is much lower at 8.38%, but that 17.5% yield won’t last for all that long anyway. If ARR-C gets called several years in the future (not callable until 1/28/2025, but it wouldn’t make sense to call until rates are lower anyway), investors would get a nice capital gain. It’s not a likely scenario, but it’s possible. The likely scenario is that the investor simply continues to collect the yield.
CIM-A (CIM.PA): Big stripped yield at 9.49% with plenty of upside to call value. It’s a good deal. For investors who want the shares to be fixed-to-floating, check CIM-B, CIM-C, and CIM-D instead. I like those 3 as well. Compared to ARR-C, CIM-A’s bigger coupon rate makes it a more likely candidate for being called when rates dip. I’m not calling for yields to plunge tomorrow, but eventually they will come down. Inflation has most likely peaked. The producer price index most likely peaked. Year-over-year increases in market prices (which are different than inflation, primarily due to housing) most likely peaked quite a while ago. When rates come down at some point in the future, that 8% coupon rate on CIM-A creates an incentive for share to be called.
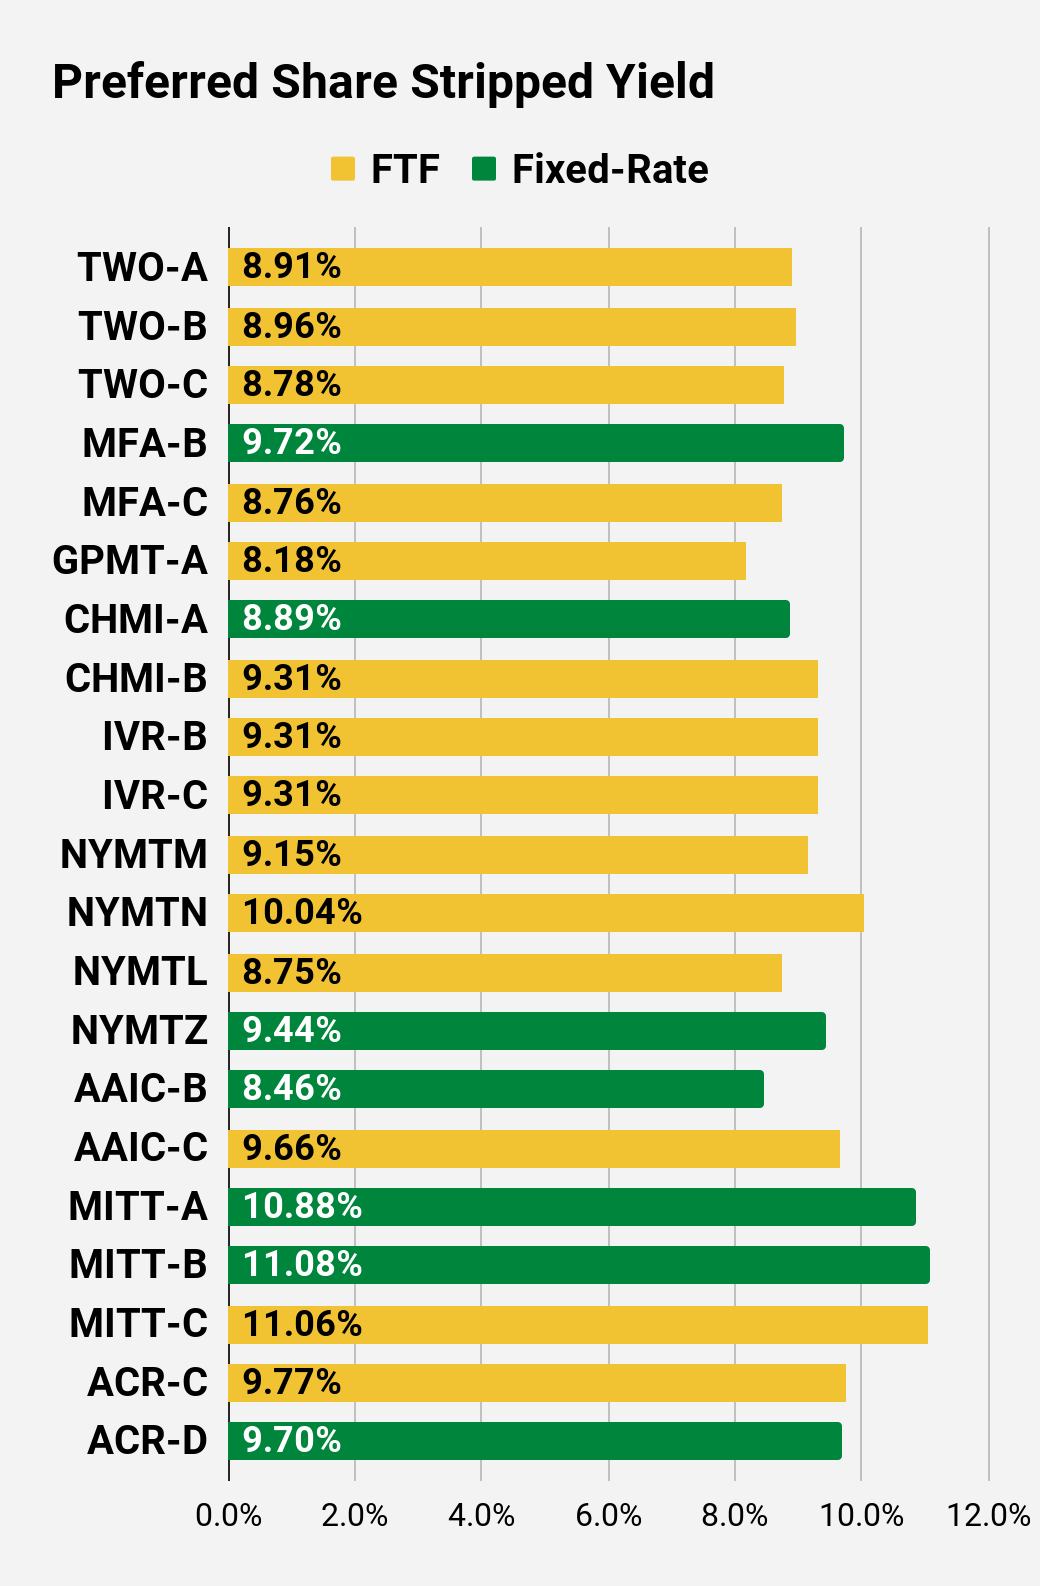
CHMI-A (CHMI.PA): Less impressive. I find CHMI-A to be a riskier pick than CIM-A. However, CHMI-A trades at $23.50 (vs. $21.15 for CIM-A). That means far less upside in the event of a call. CHMI-A also carries an 8.89% stripped yield compared to 9.49% for CIM-A. So, the investor in CHMI-A gets less upside if called and gets less income. Both shares are fixed rate, so we know the future dividend rate. The common shares of each REIT trade around a 6% to 8% discount to our estimate of current book value, so it isn’t like the market is simply in love with CHMI and hating CIM.
RITM-C (RITM.PC): An ideal pick for a scenario where rates remain elevated. If rates remain elevated, the yield on RITM-C will be outstanding. Shares only have a 4.969% spread over short-term rates when the floating rate kicks in (2/15/2025), but they only trade at $19.21. Thanks to that low share price, investors are getting far more shares. If we see short-term rates around 3.5% at that point, that will create a coupon rate of nearly 8.5%. Based on the low share price, the yield would be over 11% based on today’s price. I’m absolutely not campaigning against the other preferred shares from this REIT. I think they are good choices as well. RITM-A is a bit less appealing than RITM-B, RITM-C, and RITM-D. However, it’s still a pretty good pick. It just isn’t the best.
- Good Picks: DX, ARR-C, CIM-A, CIM-B, CIM-C, CIM-D, RITM-A (but about 3% less attractive than related shares), RITM-B, RITM-C, RITM-D.
- Bad Picks: NLY, ARR, CHMI-A
Does that mean we’re bullish on everything? No, it means twice I picked preferred shares from a REIT that had four preferred shares, so I ended up weighing in on all four. If I only mentioned one preferred share from CIM and one from RITM, I would’ve only had 4 picks.
I’d like to congratulate the market on relative pricing for RITM-B, RITM-C, and RITM-D. These shares range between 85.1% and 85.8% of our target values. All 3 shares are discounted, but the market is correctly evaluating the relative value of cash flows for each share.
The rest of the charts in this article may be self-explanatory to some investors. However, if you’d like to know more about them, you’re encouraged to see our notes for the series.
Stock Table
We will close out the rest of the article with the tables and charts we provide for readers to help them track the sector for both common shares and preferred shares.
We’re including a quick table for the common shares that will be shown in our tables:
Let the images begin!
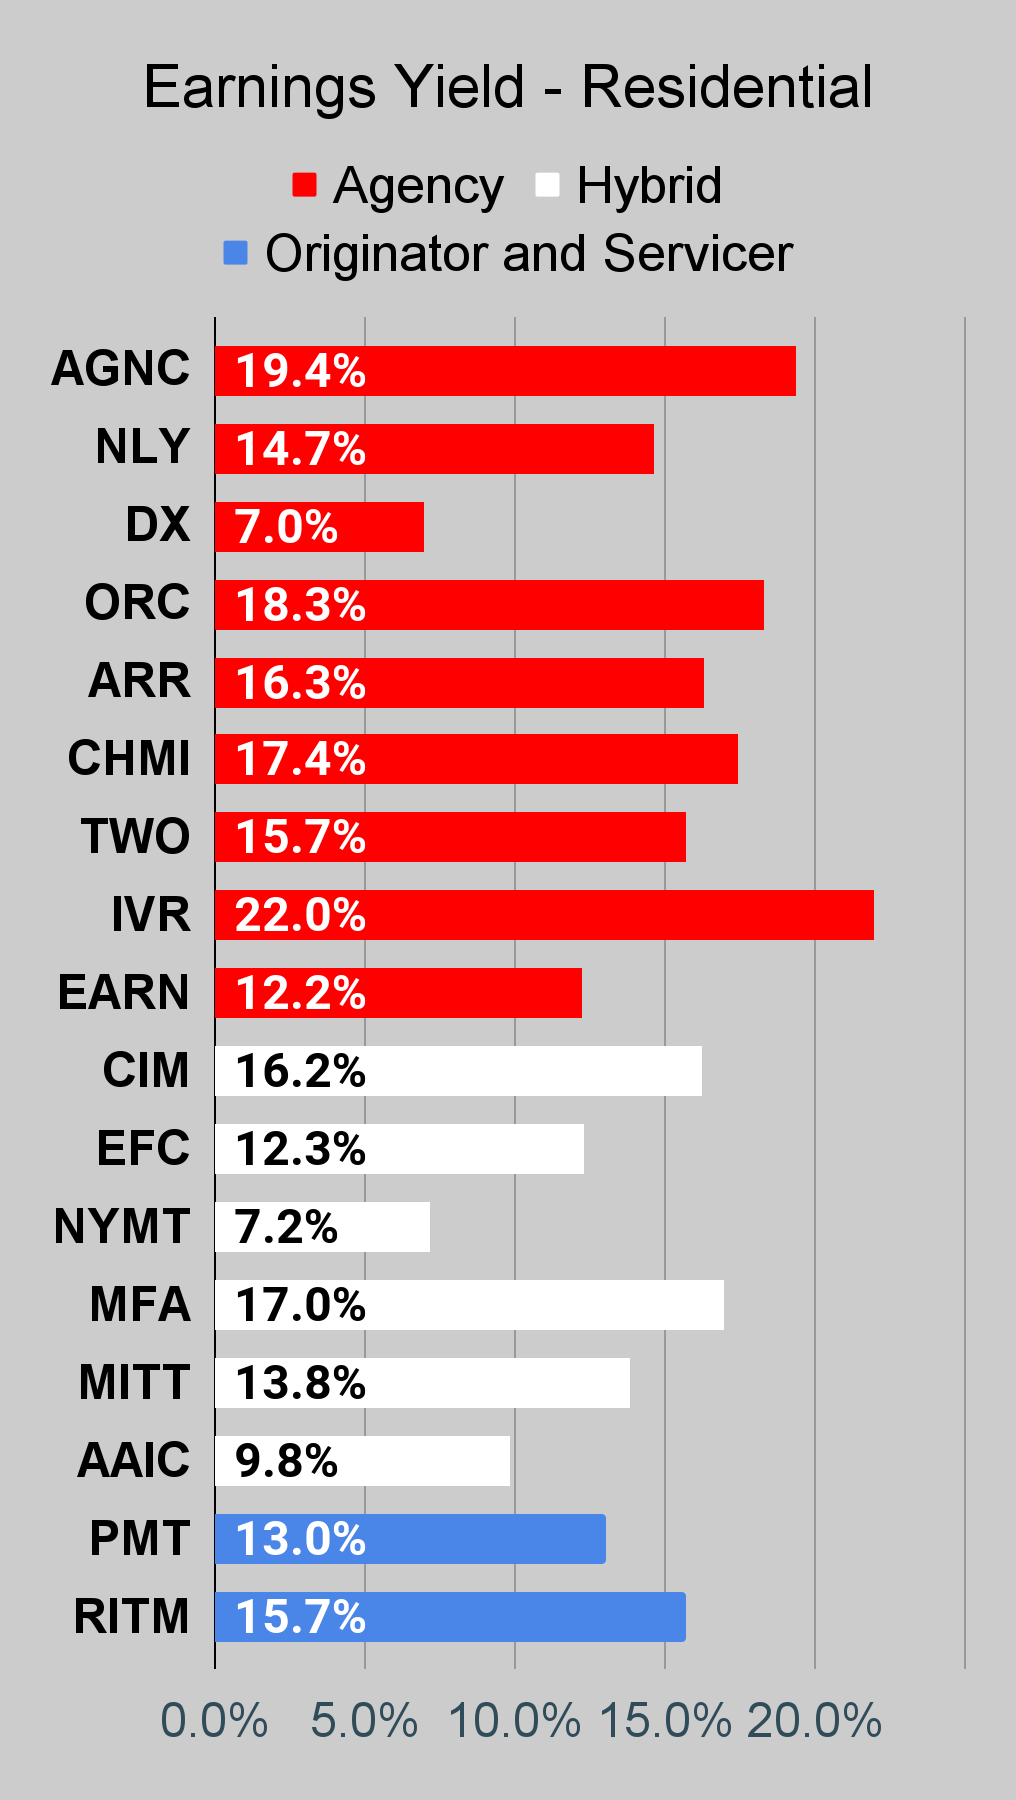
Residential Mortgage REIT Charts
Note: The chart for our public articles uses the book value per share from the latest earnings release. Current estimated book value per share is used in reaching our targets and trading decisions. It is available in our service, but those estimates are not included in the charts below.
 The REIT Forum |
 The REIT Forum |
 The REIT Forum |
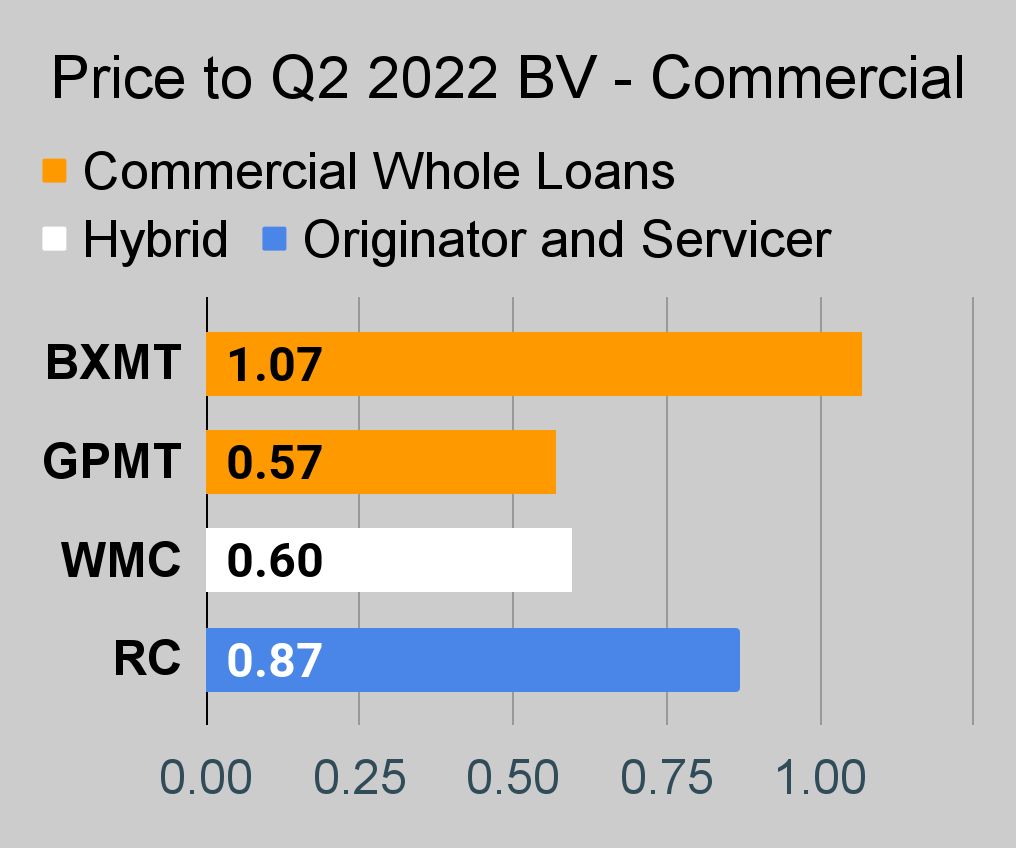
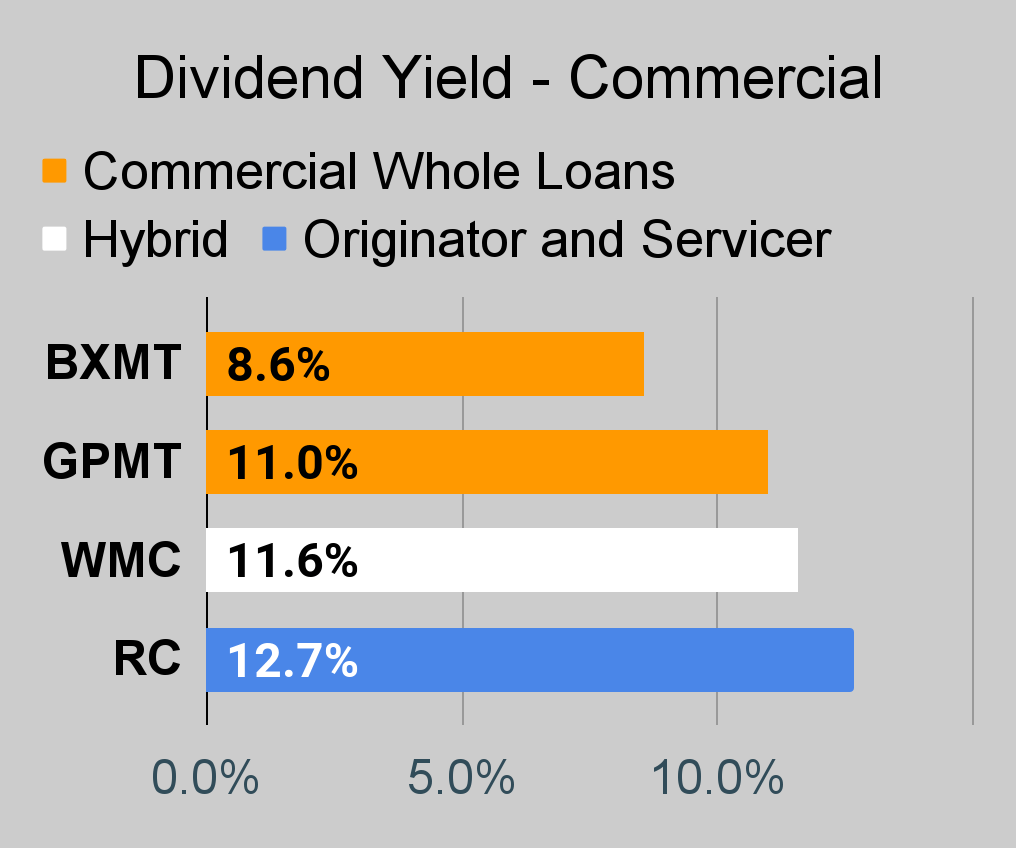
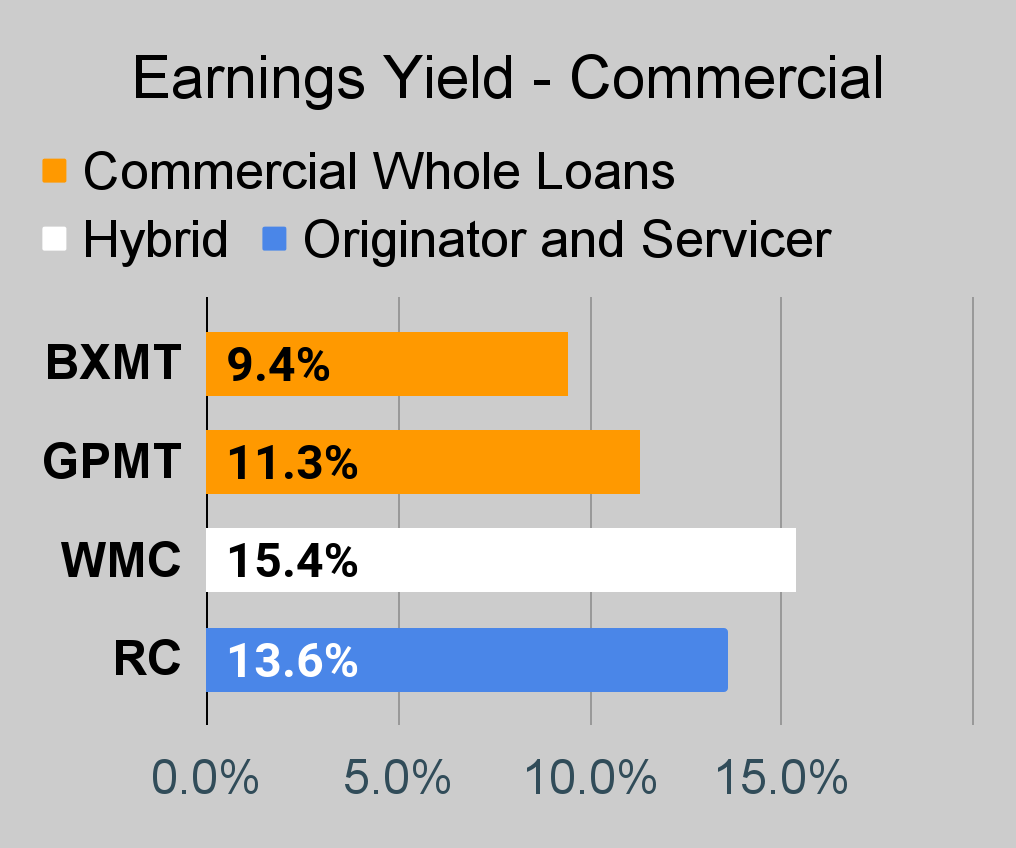
Commercial Mortgage REIT Charts
 The REIT Forum |
 The REIT Forum |
 The REIT Forum |
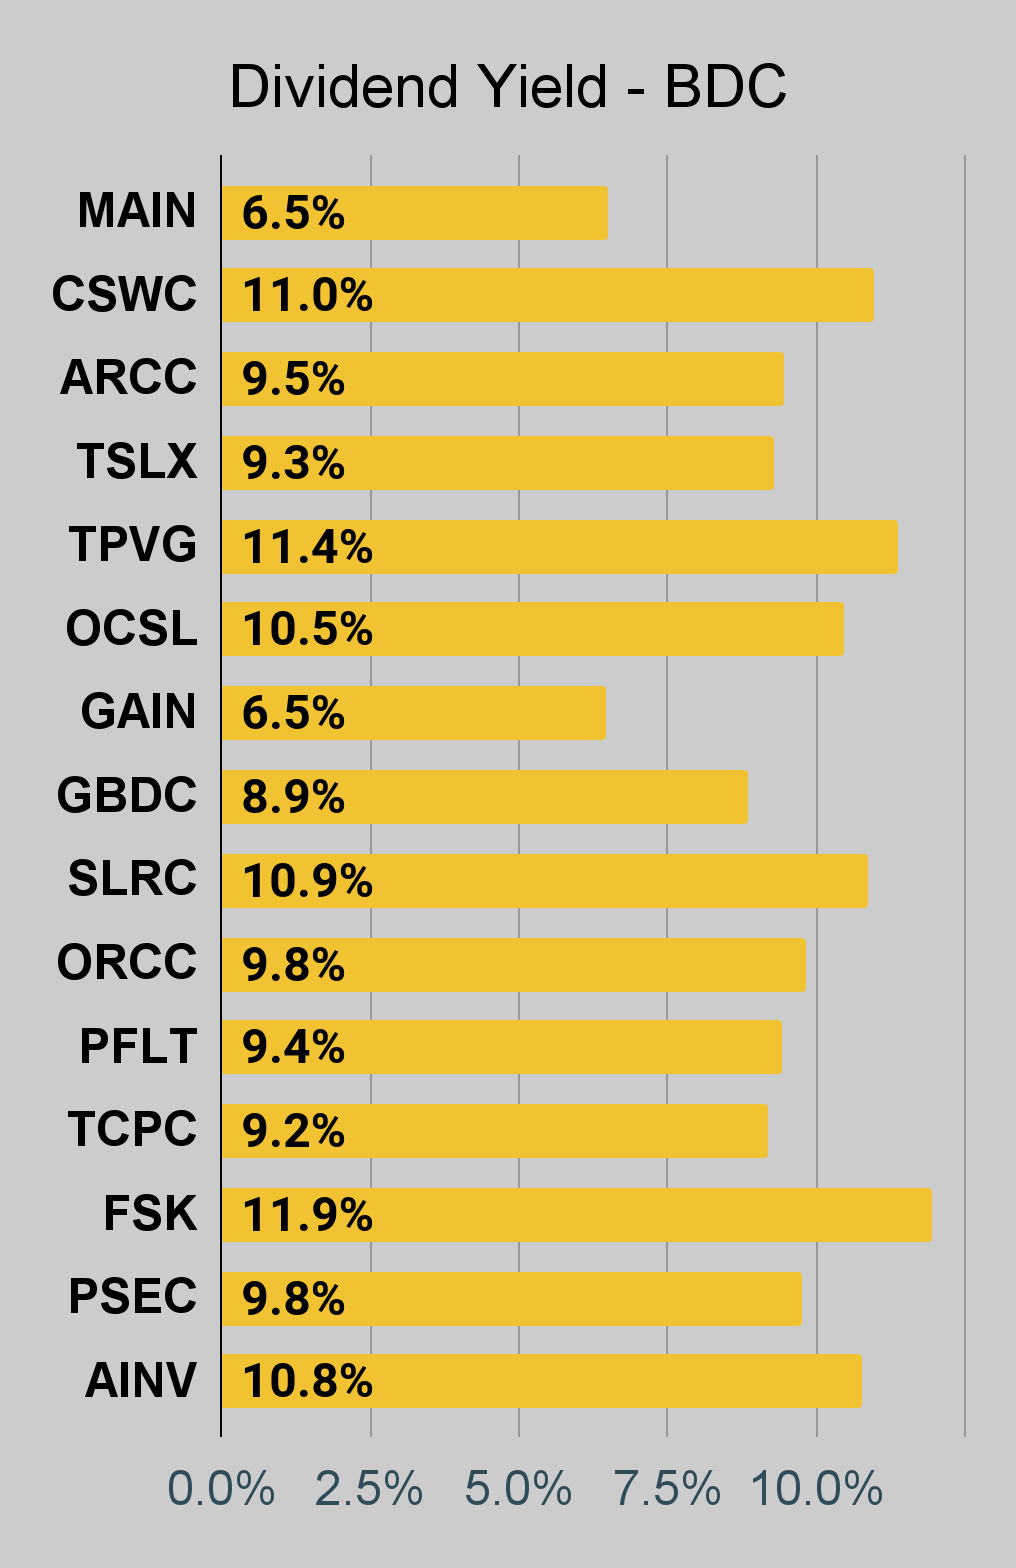
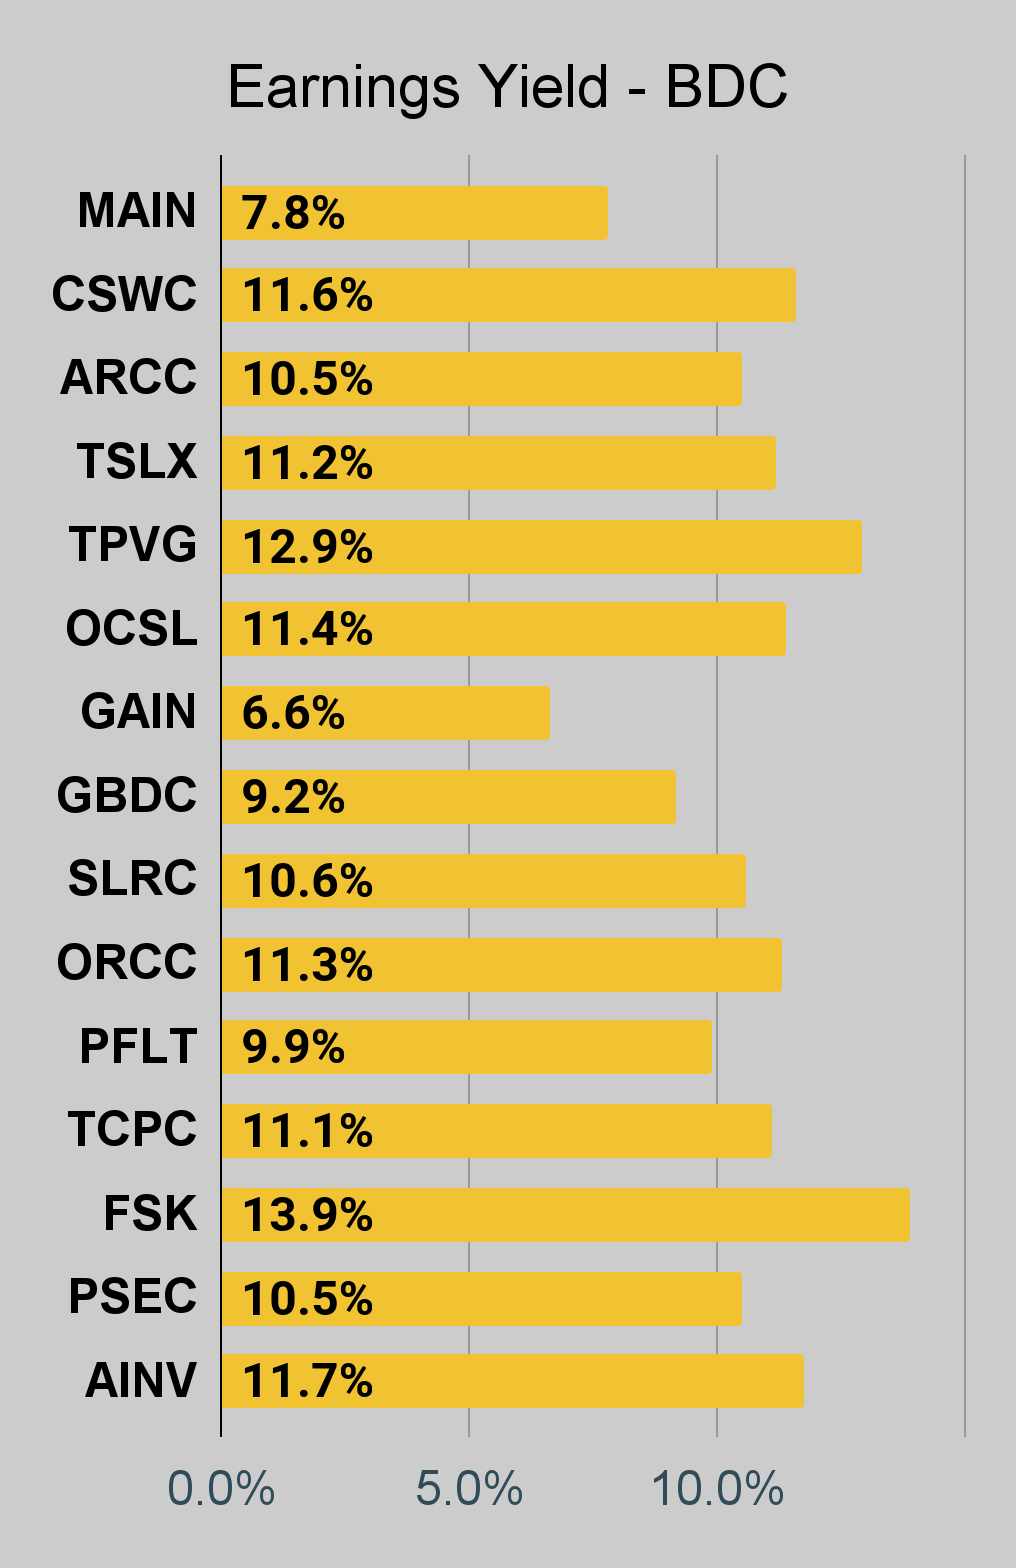
BDC Charts
 The REIT Forum |
 The REIT Forum |
 The REIT Forum |
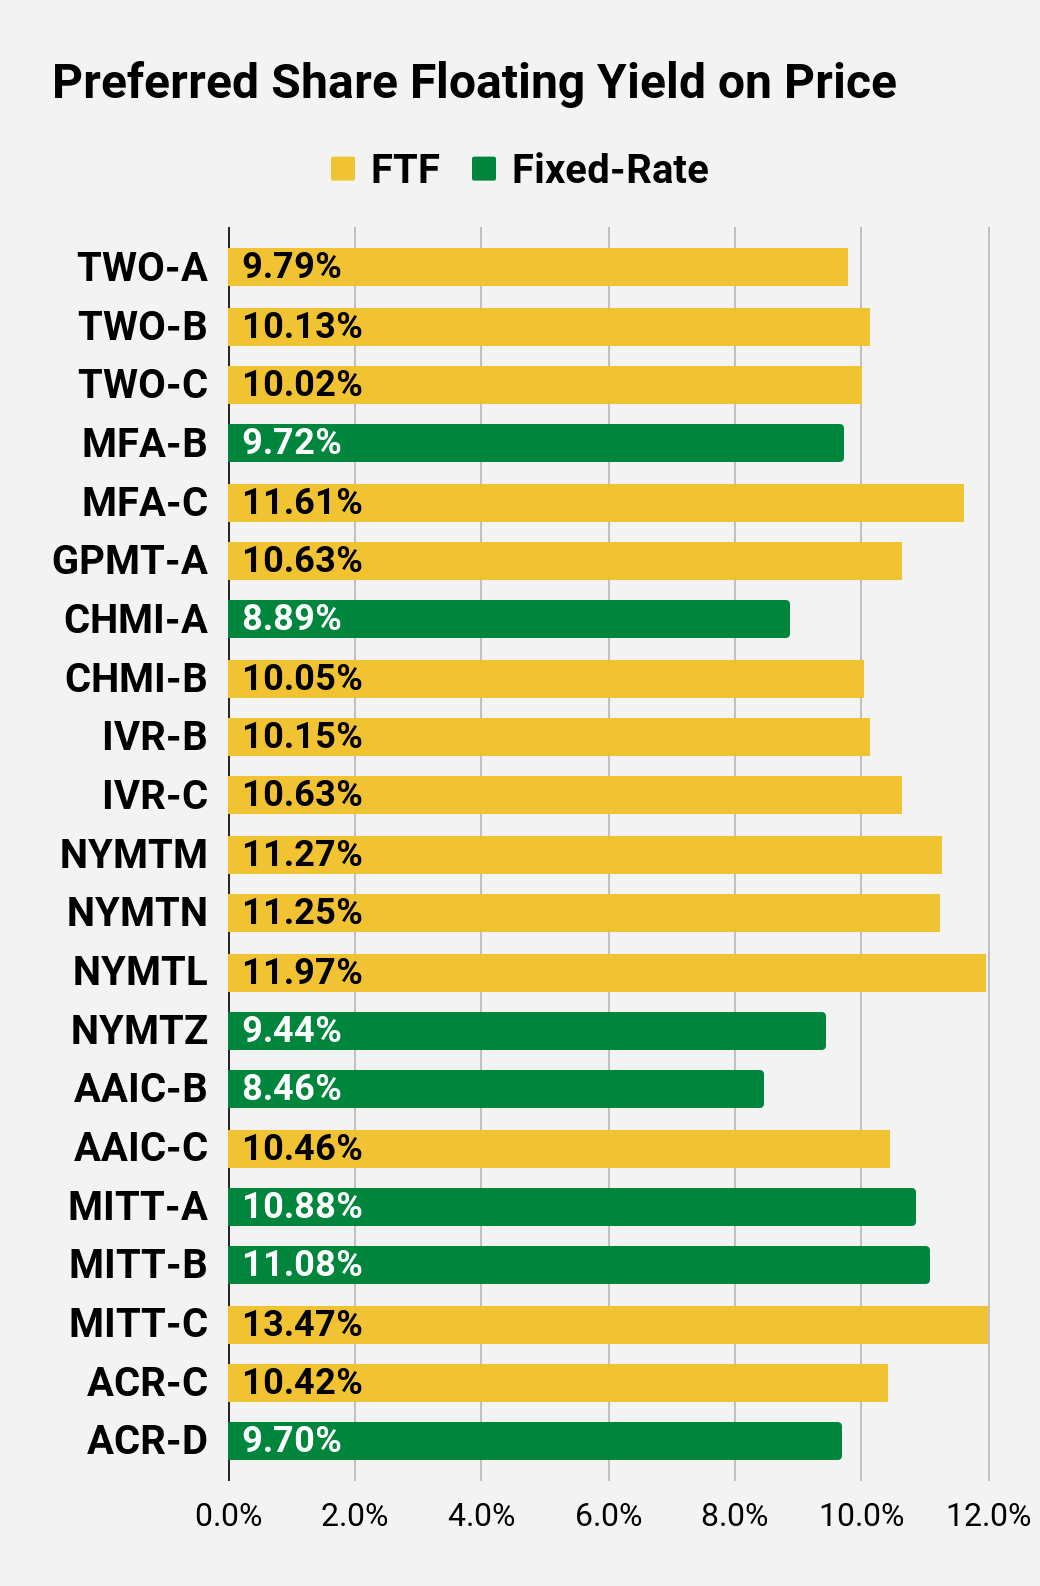
Preferred Share Charts
 The REIT Forum |
 The REIT Forum |
 The REIT Forum |
 The REIT Forum |
 The REIT Forum |
 The REIT Forum |
Preferred Share Data
Beyond the charts, we’re also providing our readers with access to several other metrics for the preferred shares.
After testing out a series on preferred shares, we decided to try merging it into the series on common shares. After all, we are still talking about positions in mortgage REITs. We don’t have any desire to cover preferred shares without cumulative dividends, so any preferred shares you see in our column will have cumulative dividends. You can verify that by using Quantum Online. We’ve included the links in the table below.
To better organize the table, we needed to abbreviate column names as follows:
- Price = Recent Share Price – Shown in Charts
- BoF = Bond or FTF (Fixed-to-Floating)
- S-Yield = Stripped Yield – Shown in Charts
- Coupon = Initial Fixed-Rate Coupon
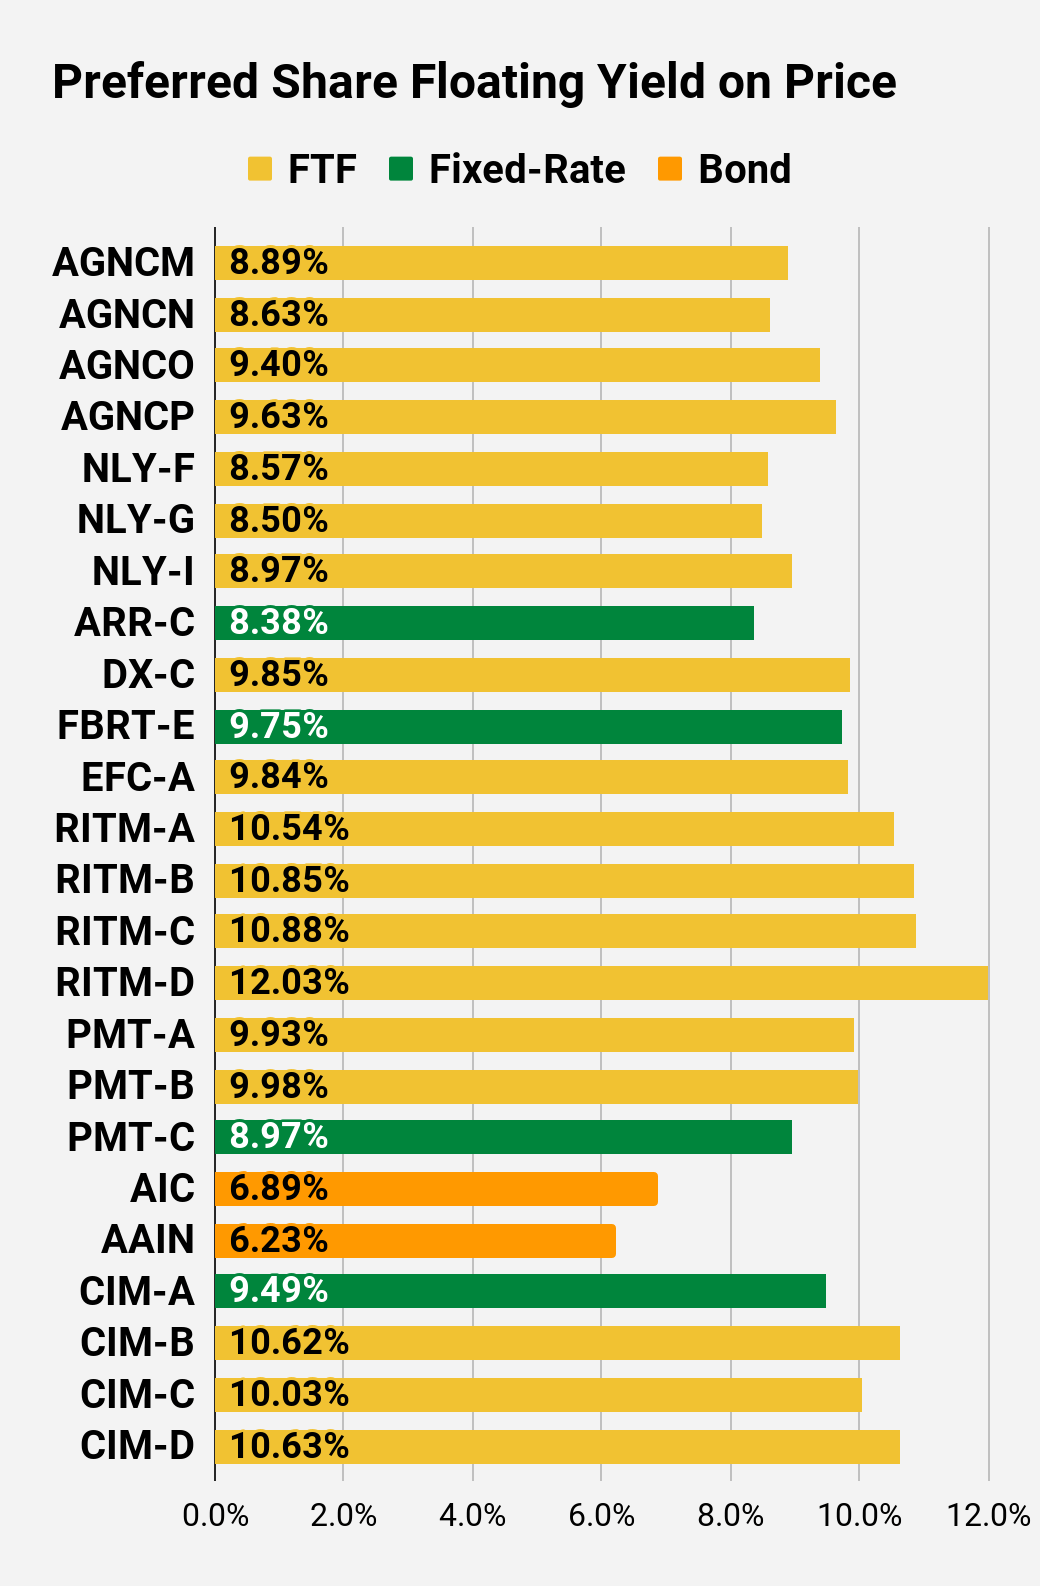
- FYoP = Floating Yield on Price – Shown in Charts
- NCD = Next Call Date (the soonest shares could be called)
- Note: For all FTF issues, the floating rate would start on NCD.
- WCC = Worst Cash to Call (lowest net cash return possible from a call)
- QO Link = Link to Quantum Online Page
Second Batch:
Strategy
Our goal is to maximize total returns. We achieve those most effectively by including “trading” strategies. We regularly trade positions in the mortgage REIT common shares and BDCs because:
- Prices are inefficient.
- Long-term, share prices generally revolve around book value.
- Short-term, price-to-book ratios can deviate materially.
- Book value isn’t the only step in analysis, but it is the cornerstone.
We also allocate to preferred shares and equity REITs. We encourage buy-and-hold investors to consider using more preferred shares and equity REITs.
Performance
We compare our performance against 4 ETFs that investors might use for exposure to our sectors:
The REIT Forum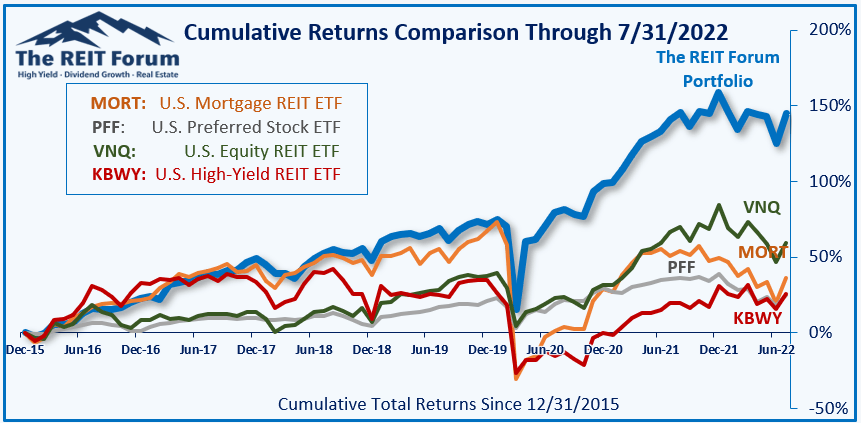
The 4 ETFs we use for comparison are:
|
Ticker |
Exposure |
|
One of the largest mortgage REIT ETFs |
|
|
One of the largest preferred share ETFs |
|
|
Largest equity REIT ETF |
|
|
The high-yield equity REIT ETF. Yes, it has been dreadful. |
When investors think it isn’t possible to earn solid returns in preferred shares or mortgage REITs, we politely disagree. The sector has plenty of opportunities, but investors still need to be wary of the risks. We can’t simply reach for yield and hope for the best. When it comes to common shares, we need to be even more vigilant to protect our principal by regularly watching prices and updating estimates for book value and price targets.
Ratings:
- Bullish on DX, ARR-C, CIM-A, CIM-B, CIM-C, CIM-D, RITM-A (but about 3% less attractive than related shares), RITM-B, RITM-C, RITM-D.
- Neutral on CHMI-A (materially less attractive than peers, but not quite bad enough to get a bearish outlook).
- Bearish on NLY, ARR
Be the first to comment