

sefa ozel
Thesis – should you deploy cash now?
In our marketplace service, the most frequently asked question is when it is a good time to deploy cash and what to buy. Here, let me answer the first question first. And then I will spend the rest of the article answering the second one.
Our answer to the first question is quite simple: now actually is a good time to deploy some cash. More specifically, we suggest you follow a barbell model. Set aside enough money in the conservative end of the barbell, which I call the short-term survival end. This end should consist of safe assets – such as cash, short-term bonds, intermediate bonds, high-quality and cyclical stocks, et al. Our own guideline for this end of the barbell is that the cash, cash equivalent, and dividends combined should be sufficient to cover six months of our living expenses. Growth is NOT the goal here. Survival is.
Once short-term survival is ensured, you will see that now is an attractive window to pursue the growth end of the barbell. You will see there are good high-growth and high-return opportunities on market now after a long bull run in both the equity and bond markets. To us, a clear delineation of survival from growth is step 1 in successful investment. The dynamic use of the barbell strategies has allowed us to suffer substantially lower drawdowns (as shown in the chart below) at bad times and capture higher returns at good times.
Source: Author based on Seeking Alpha data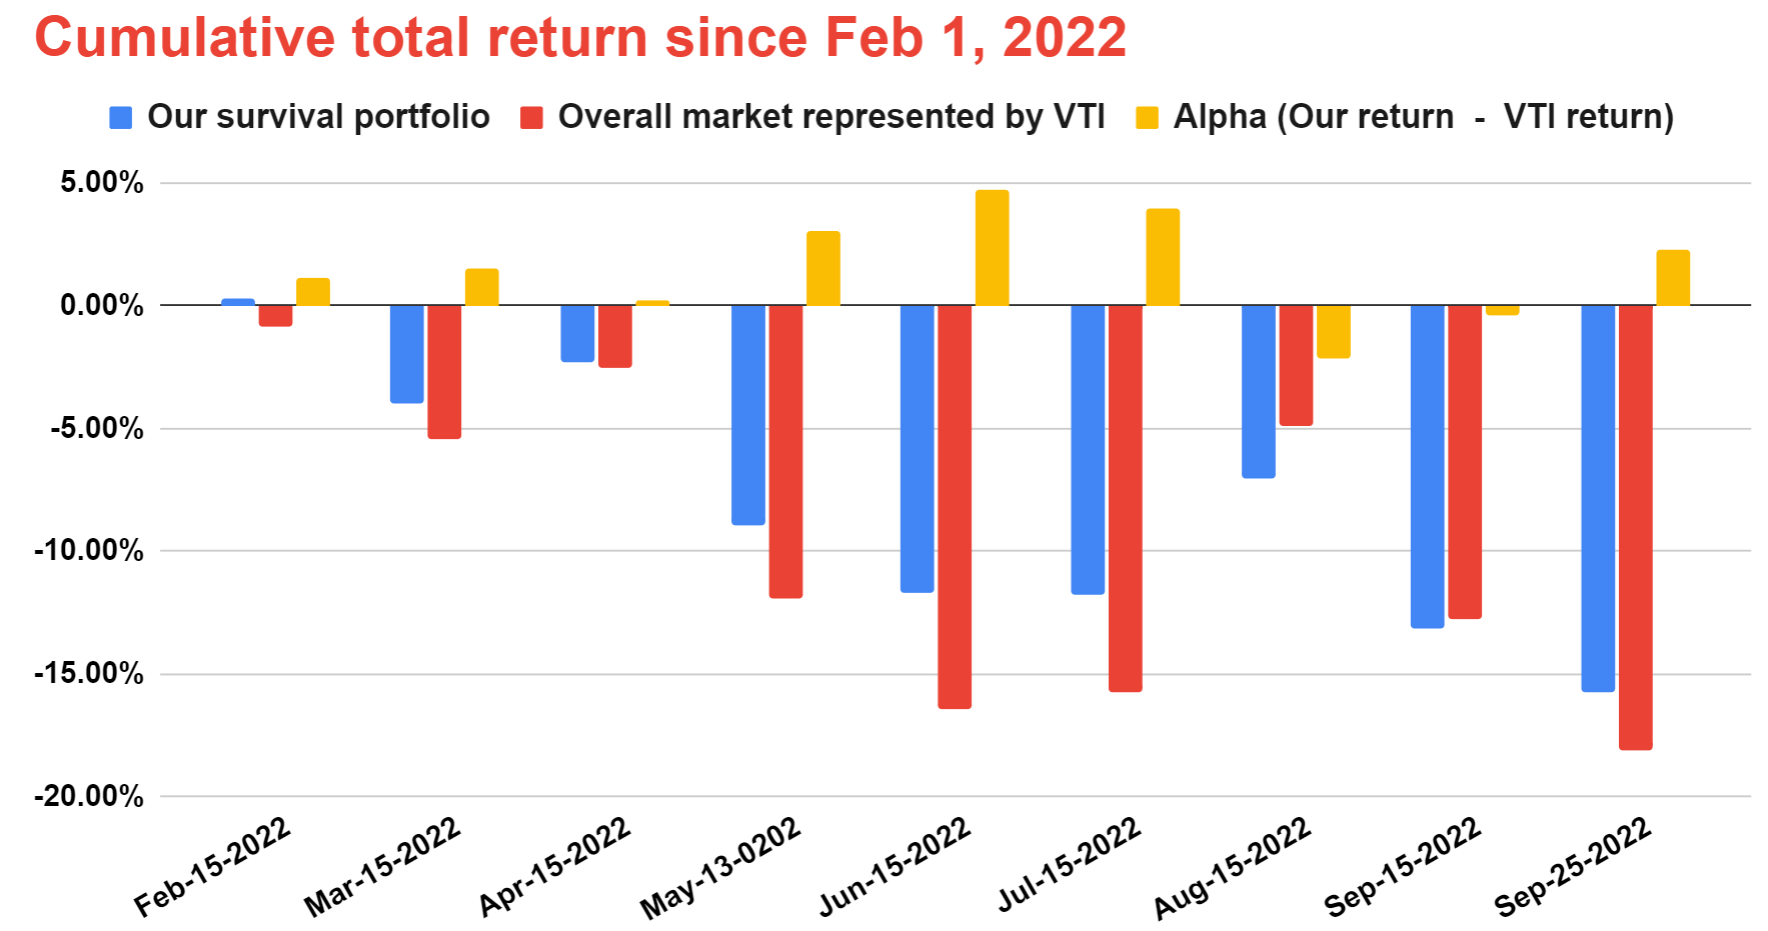
Our survival portfolio suffers lower drawdowns than the overall market during bad times.
The key reason why we think now is a good time to deploy some cash, again assuming you have an adequate cash reserve, is because the current Exposure Index (“EI”) is quite attractive. The EI is a measure of the opportunity cost of holding cash and is calculated based on treasury bond yields and stock market yields. And details are in our earlier article here. We regularly monitor this key monitor and you are welcome to download the Google sheet we use here. As you can see, the EI is currently at 5.39%. And the last time EI reach 5% dates all the way back to 2010~2011 when both equity and bonds were quite attractive then. For ourselves, our next trigger points are:
- The first trigger point is when EI reaches 6.0%, the highest level since 2010. We will consider further reducing our cash reserve and increasing our position either in bonds, equity, or both.
- Then the next trigger point is when EI reaches 7.0%, which is the EI reached during the 2008 Great Recession, we will further reduce cash holding and even consider more leveraging.
Source: Author based on Seeking Alpha data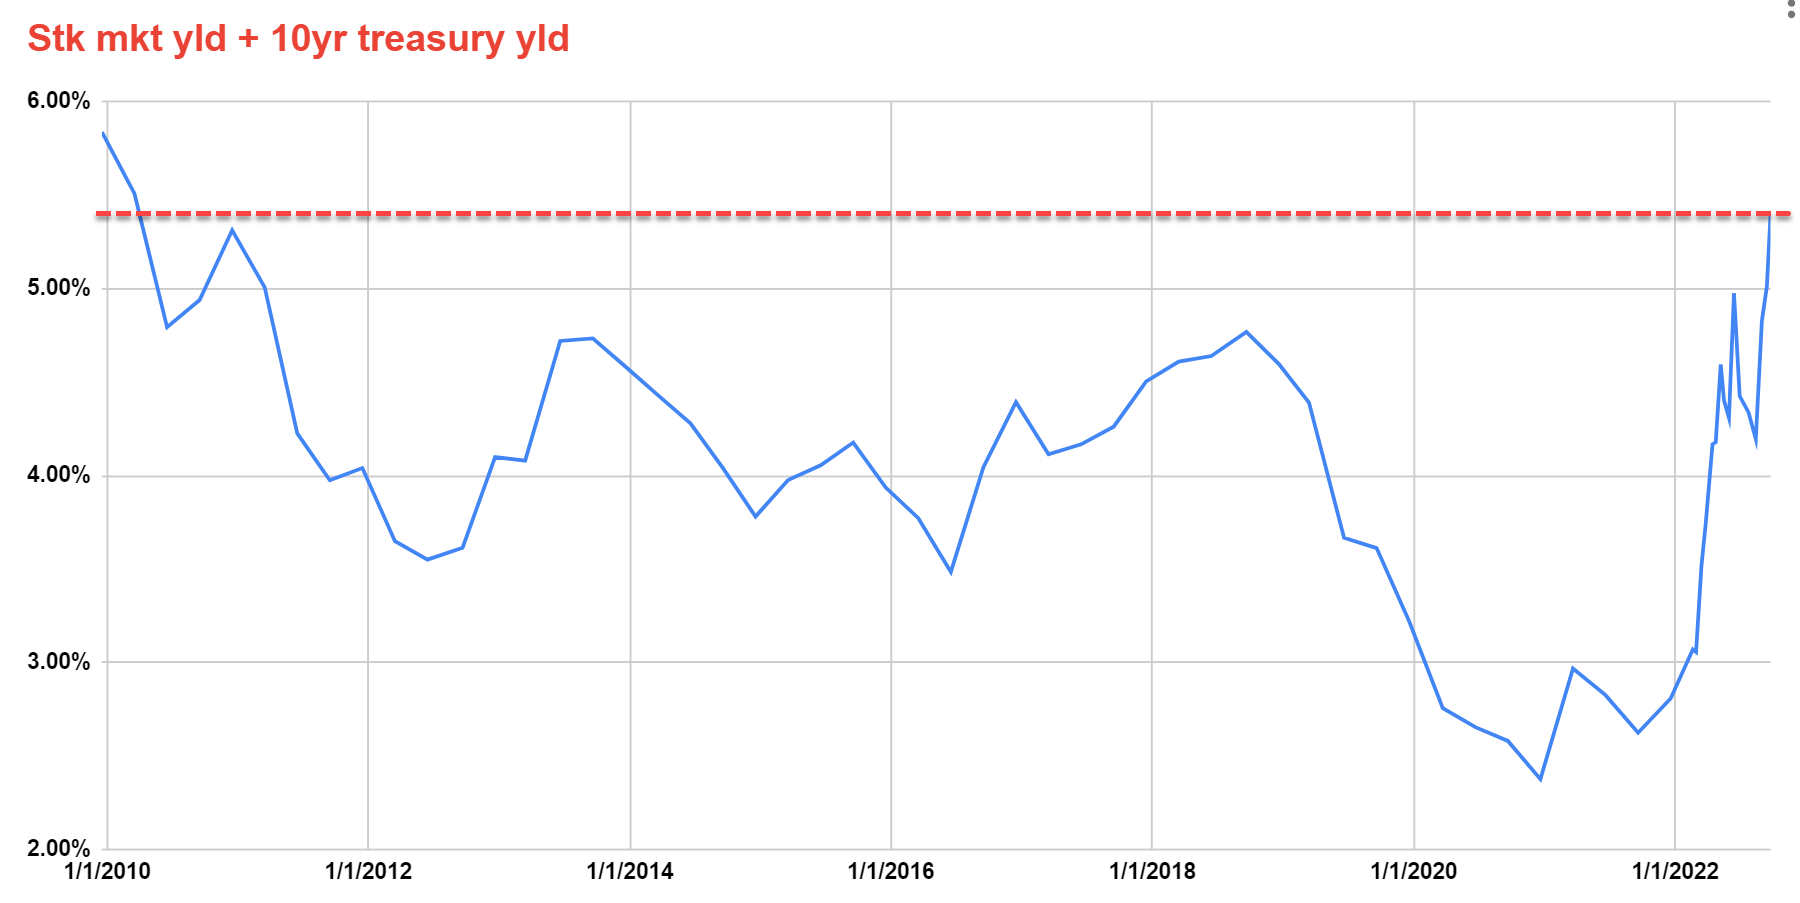
What to buy – the top 10 beaten-down stocks
Now, we will answer the second question: what to buy? Our answers are in the table below. The table is the result of a Graham-type screening (to be detailed in the next section). As you can see in the table below, so many good stocks (some excellent ones such as Berkshire Hathaway and Verizon) are valued in the single-digit P/E range, across a broad range of market caps (mega, large, medium, and small), and across a wide range of sectors. Probably not coincidentally, Graham’s most famous pupil, Warren Buffett, has either bought or still holds some of the picks in this list. For example, he aggressively bought back Berkshire Hathaway Inc. (NYSE:BRK.A, NYSE:BRK.B) shares in the past (and probably would buy more), held a sizeable Version position till the last quarter, and still holds a sizable position in General Motors (GM).
All told, as mentioned above, the market is not quite raining gold yet. But it is definitely time to get a shopping list ready. So that when it does (again for us, the trigger points are EI of 6% and 7% respectively), we know what to buy.
Source: Author based on Seeking Alpha data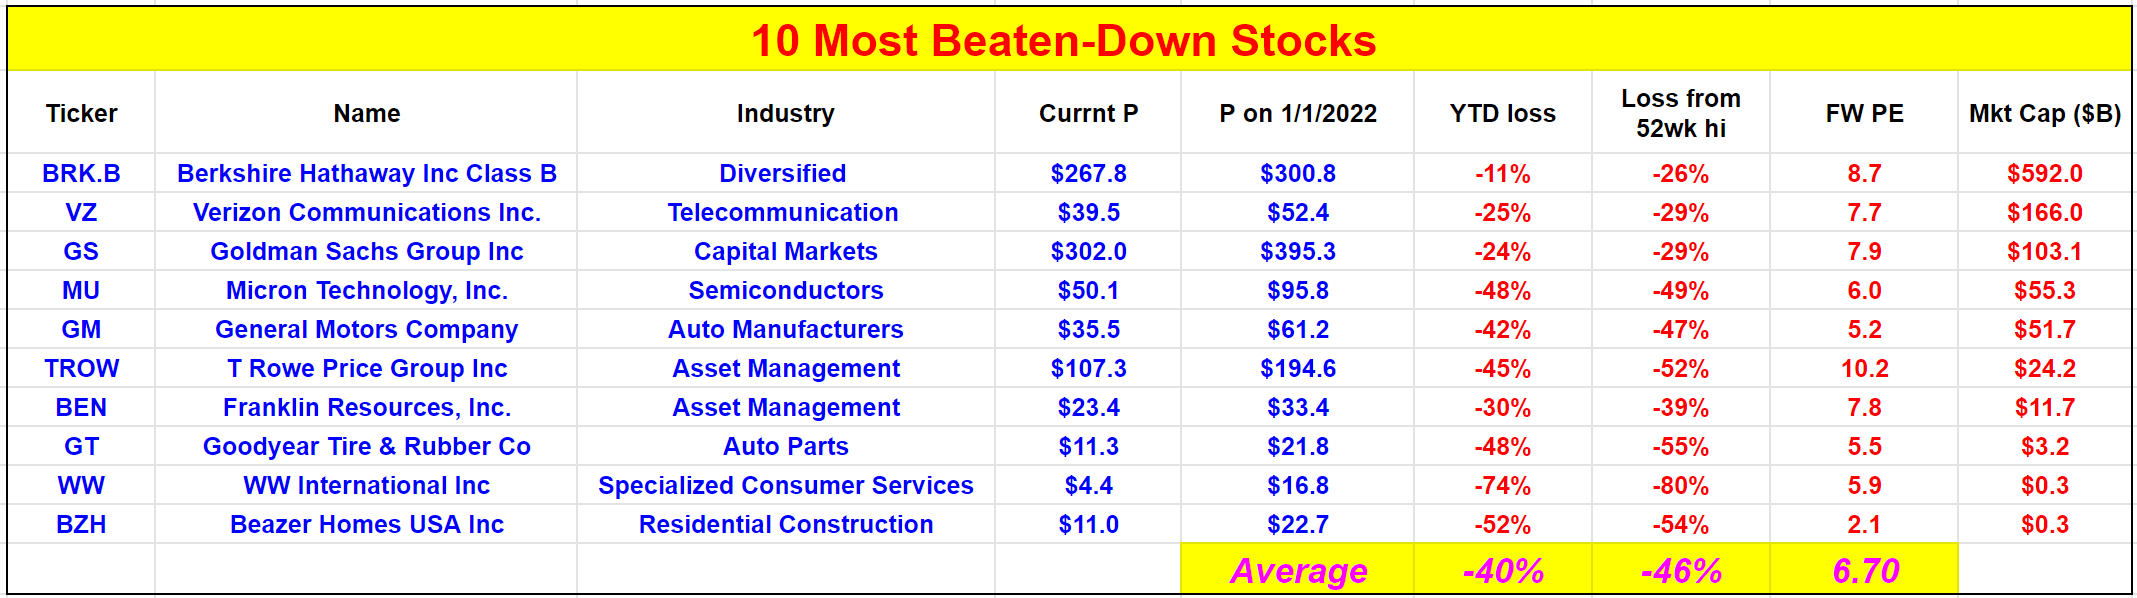
This article is a bit longer (actually A LOT longer) than our usual single-ticker articles. Thus, here, let me provide an outline here to help you navigate this article in case you want to skip certain parts.
- The next section describes the screener method and its risks/limitations.
- The section after that provides some overall observations of the picks.
- After that, I will dive into the top two picks, Berkshire Hathaway and Verizon Communications Inc. (NYSE:VZ), and provide an in-depth discussion on them.
- Then I will discuss the rest of the picks in groups, mostly with some brief commentaries. The first group consists of 3 financial stocks: Goldman Sachs Group (GS), T. Rowe Price Group (TROW), and Franklin Resources (BEN). The second group is the semiconductor stocks, with Micron (MU) as an example. The third group includes 2 auto stocks – General Motors Company and Goodyear Tire & Rubber (GT). The fourth group includes 2 small/micro caps – WW International Inc (WW) and Beazer Homes USA Inc (BZH).
Screening method and risks
This section describes the screening method we used to generate the above picks. The method has been detailed in an earlier article published in Feb 2022. We are repeating it here for ease of reference. After all, it has been more than 6 months since we wrote about the method for the last time). Readers still familiar with the method should skip this entire section.
In the stock market bible, The Intelligent Investor, Benjamin Graham suggested a set of criteria for stock selection. These timeless criteria have helped and inspired millions of investors worldwide. These criteria turned buying stocks from a speculation into an investment. However, the dream deals that fit all his original criteria have become almost extinct now (e.g., stock price below 2/3 of tangible book value per share, stock price below 2/3 of Net Current Asset Value, et al).
However, from time to time, extreme market panics offer a rare entry window to pick stocks close to these dream criteria. And we’ve designed our screener based on the following criteria.
- Low PE
- Earning growth in the past five years
- YTD loss.
Criteria 1 and 2 are completely consistent with Graham’s original thinking for picking value stocks which have demonstrated reasonable earnings growth. And criterion 3 is designed to capture the recent panic sell-off.
To be also consistent with his original thinking and to reduce the speculative nature of our selections, we’ve applied this screener to the stocks with positive earnings and with a market capitalization of more than $500M. Our final list is the stocks with the highest combined scores on all three criteria. The score is an equal-weighted average of each stock’s ranking on these criteria.
Before moving on, we’d like to first point out the risks and limitations of our screener (or screening approach in general) and also the risks of the stocks in the list:
- This screener won’t be too useful to pick growth stocks, especially early-stage growth stocks. The approach prioritizes A) positive profitability and B) profitability growth in the past five years. Growth stocks, especially those in their earlier stage, typically have no earnings (or very erratic earnings) and hence provide no basis for either A or B.
- Second, like the results from any screener, not all the stocks that made the list will be winners and it is likely that some of them can suffer large losses. You need to consider them as a group and also consider them under the context of your existing holdings. As to be detailed below, A) as a group, they offer an excellent balance of diversification, quality, valuation, and attractive return potentials, but B) as individual stock, they each have their own risks.
The list and the timeless power of value investing
Before moving on to comment on the details of each stock one by one, let me first take a look at the overall picture and make some overall observations. The next table shows the basic statistics of these 10 stocks, their current P/E, forward P/E, growth expected in the next three to five years, and also the expected returns. A few key observations:
- First, the top candidate, Berkshire Hathaway, is a tricky one that would elude simple value screeners because of its unique capital structure. Most database reports its nominal P/E, which is quite high and wouldn’t make it into the list. For example, Yahoo reports a TTM P/E of almost 55x and Seeking Alpha reports an FY1 PE of 18.7x. However, as you will see in the next section, once you correctly interpret its financial data, its P/E is only about 8.7x.
- Second, as you can also see, this set of stocks currently is very undervalued. They are all valued at single-digit FW P/E with the exception of T. Rowe Price Group, which is currently priced at 10.2x FW PE. The average P/E for this group is only 6.1x. Note that the FW P/E data (and all other financial data in this article) are either taken from Seeking Alpha or Value Line unless otherwise specified.
- As a result, combining the growth and the valuation reversion expected, the total projected return in three to five years could be close to 73% (translating to an annualized return of 14.4%).
- Third, as you can see, the beauty of value investing is that – the projected return does not require extraordinary growth (about 6.8% of average growth is projected here) or extraordinary valuation (the average projected valuation is only 9.4x P/E).
- Finally, the list is ranked by market capitalization, which is directly correlated with the safety of the investments for this group since the screener only included stocks with positive earnings.
Source: Author based on Seeking Alpha data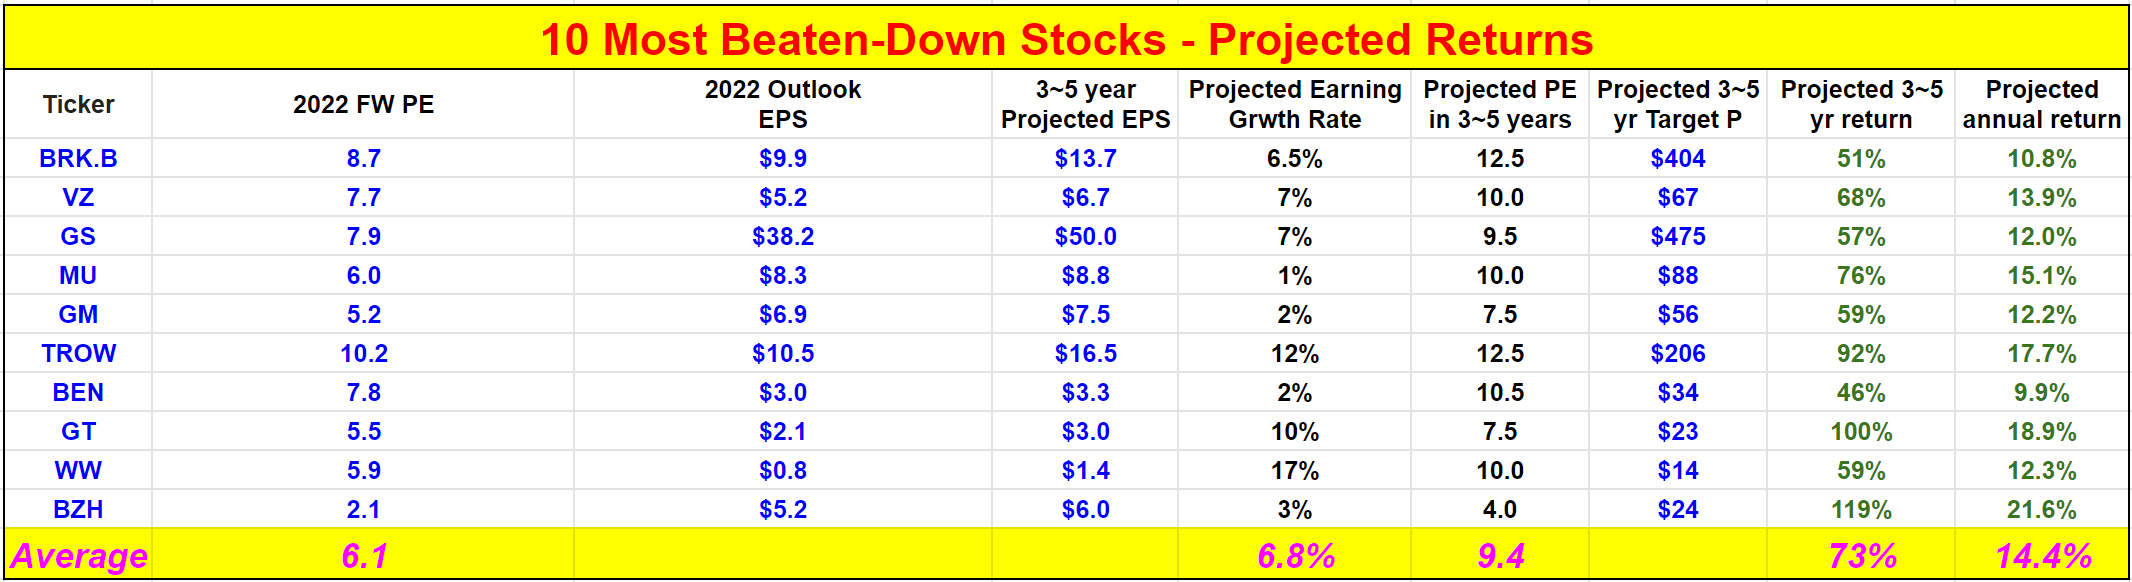
I wouldn’t be surprised by such outsized returns. If it happens, it will be just another demonstration of the timeless power of valuing investing, which has been well documented in so many past studies and also in our own investing journey. As an example,
The following chart shows the excess return of stocks divided into 5 quintiles relative to the S&P 500 index. The first quintile contains stocks with the highest P/E ratio, and so on. You can clearly see the positive correlation. Stocks in the first quintile, i.e., with the highest P/E ratio in the first 20th percentile, underperformed the S&P 500 equal weight index by 2.08%. The performance almost linearly improves as the P/E ratio goes down. And stocks in the fifth quintile, those least expensively valued produced an average annual excess return of 1.41%.
In the remainder of this article, we will detail our top two choices – BRK and VZ. We then will make some brief comments regarding the rest 8 of them.
Source: Fat Pitch Financials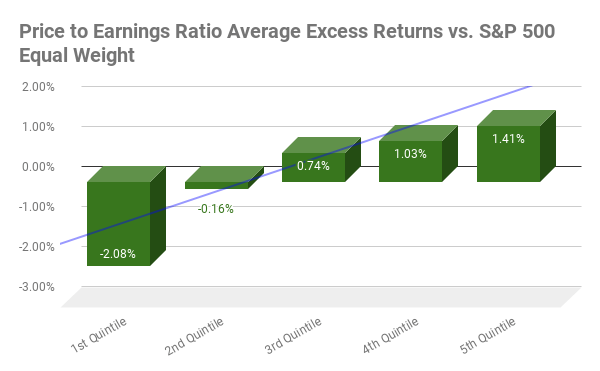
Top 1 Candidate: Berkshire Hathaway
As aforementioned, BRK is a tricky one that would elude simple value screeners because its nominal P/E is by no means cheap (ranging from 55x TTM P/E based on Yahoo to FY1 P/E of 18.7x based on Seeking Alpha). However, its true P/E is only about 8.7x when its financial data are properly interpreted.
The following table shows a snapshot of the current financials of BRK as of June 30, 2022. Let’s only consider the following three items on the balance sheet as shown below:
- Cash and cash equivalents of $26.53B
- Short-term investments in U.S. Treasury Bills of $74.8B
- Investments in equity securities of $327.66B
These three items add up to about $429B, about $40B less than its total equity of $469B. So by considering these three items only, we are on the conservative side in our subsequent analysis.
Source: BRK 2022 Q2 10Q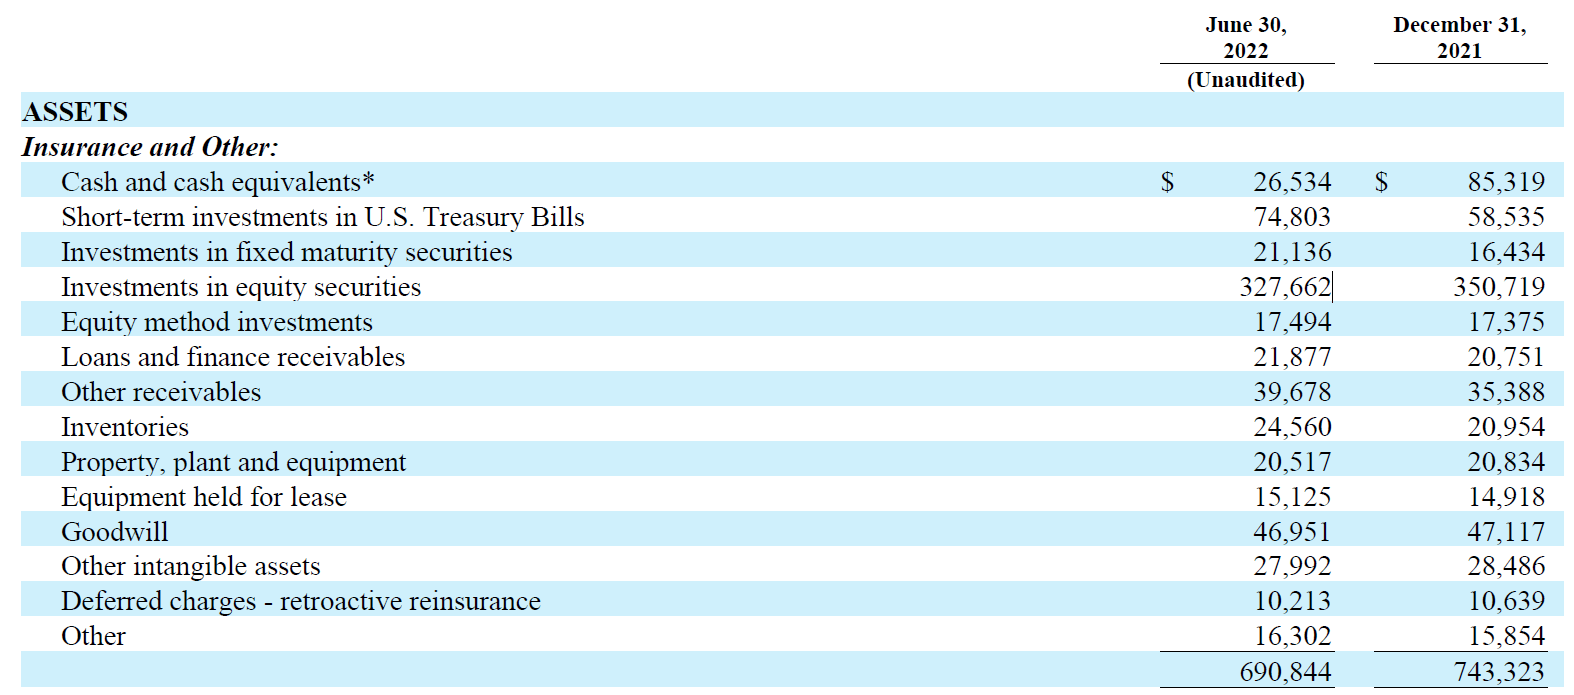
Now imagine we buy the whole business (for a total of $592B or $268 per B equivalent share at the price at this writing). Then we sell the equity investments and liquidate the cash positions immediately, and the results of this thought experiment are summarized in the table below (Risks involved in this hypothetical thought experiment will be elaborated on in the risk section).
As seen, the equity investment is worth $136 per share. So, the adjusted share price would be only $132 per share after the equity investments are sold. The cash and short-term bonds are worth $101.3B in total, or $46 per share. So, the adjusted share price would be only $86 per share after the cash and short-term bonds are liquidated.
Now let’s see how much operation earnings we are buying for $86 per share. I am assuming Berkshire to about $22 billion of operating earnings (the level in recent years), or about $9.9 per share. So the end result here is that, if we pay today’s market price of $268 to buy 1 BRK share and immediately liquidate all the equity investments,
- we are essentially paying $86 for each B share
- and we get all the BRK operating business segments, which generates $9.9 of operation earnings per share
- hence, the true P/E is only 8.7x
Source: Author based on Seeking Alpha data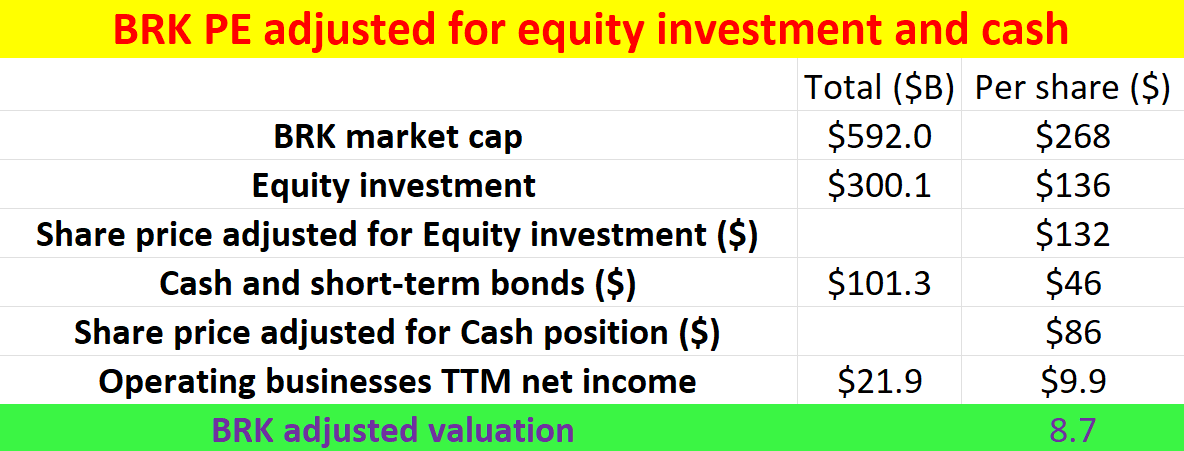
As another way to illustrate the attractiveness of its current valuation, let’s look at the “Buffett price” of 1.2x book value. Buffett mentioned multiple times that he would be an enthusiastic buyer of BRK shares at a price near 1.2x book value. And the following chart shows why 1.2x book value is indeed extremely attractive. To put things under historical perspective, the P/BV multiple BRK has fluctuated in the past 10 years between 1.25x BV (the red dotted line) and about 1.6x most of the time. The average valuation is about 1.36x. Therefore, its current multiple of 1.278x is not only below the historical average by 7% but also quite close to a bottom level in nearly a decade (1.278x is only 2% above 1.2x).
Of course, investors have to be aware of the fact that the value of its equity investments has already changed from its June 30 filing given the market fluctuations since then. Specifically, we have a limit order set at $255 to buy BRK shares based on our estimates of the change. Readers interested in the details can take a look at my recent article, entitled “Why I Set A $255 Berkshire Hathaway Limit Order To Buy Apple”. But the gist is that:
- We see a $255 target price to be the “Buffett price” of 1.2x BV when the change in equity investment is adjusted for.
- And we also see a $255 entry price as a backdoor to increase our exposure to Apple (AAPL) at heavy discounts, ranging from a single-digit P/E to free depending on how your value BRK’s operating incomes.
Source: Author based on Seeking Alpha data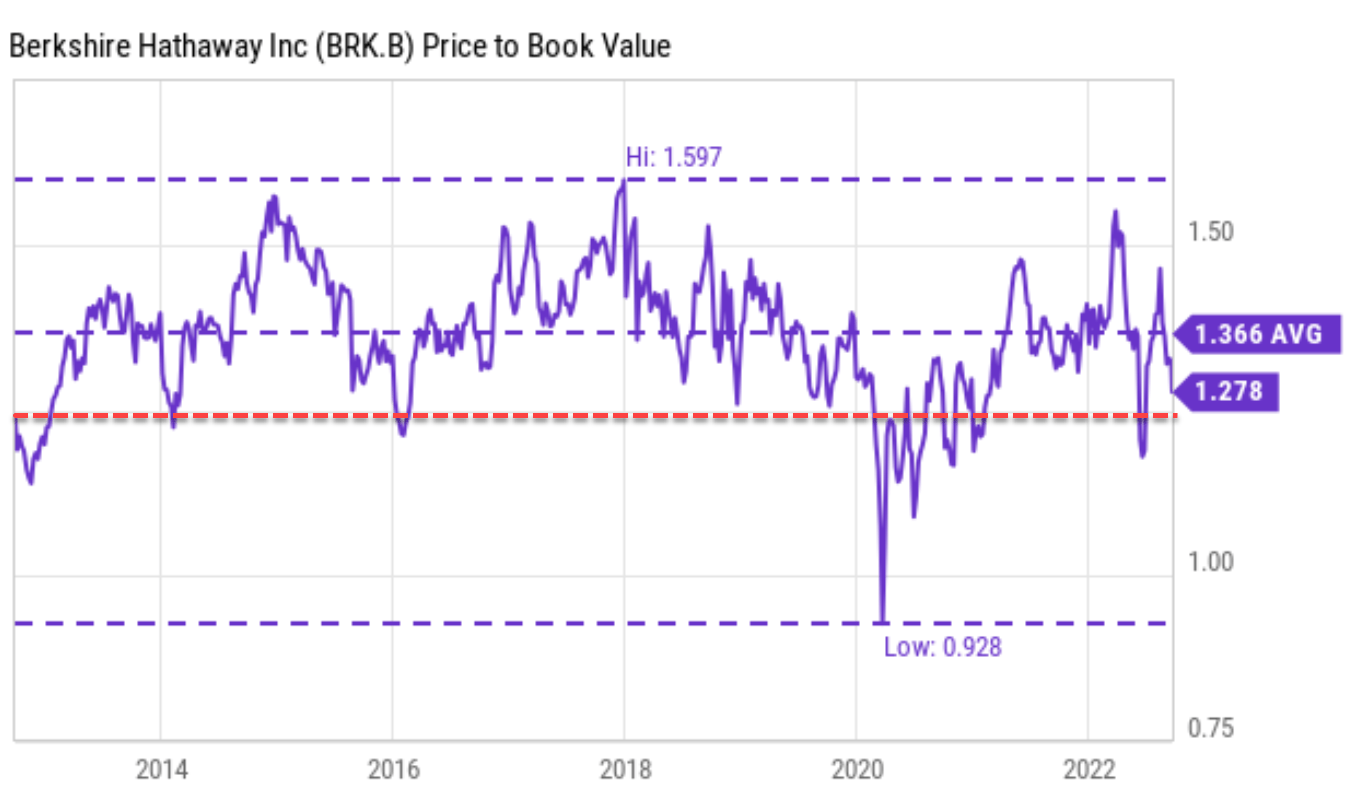
Top 2 Candidate: Verizon
VZ is a stock that Buffet has held and exited recently, as you can see from the following chart. He initiated a position in Verizon in the Q4 of 2020 and gradually added to the position. The last time that he added to the position was in Q1 2021. He added 12.1 million shares, a sizable addition representing about an 8.25% expansion of his then-existing position. He then sold the bulk of his VZ position in 2022 Q1 and completely exited the position in 2022 Q2. The selling was obviously very timely from hindsight even though I am quite sure Buffett did not buy or sell with the intention to time the market.
Source: Data Roma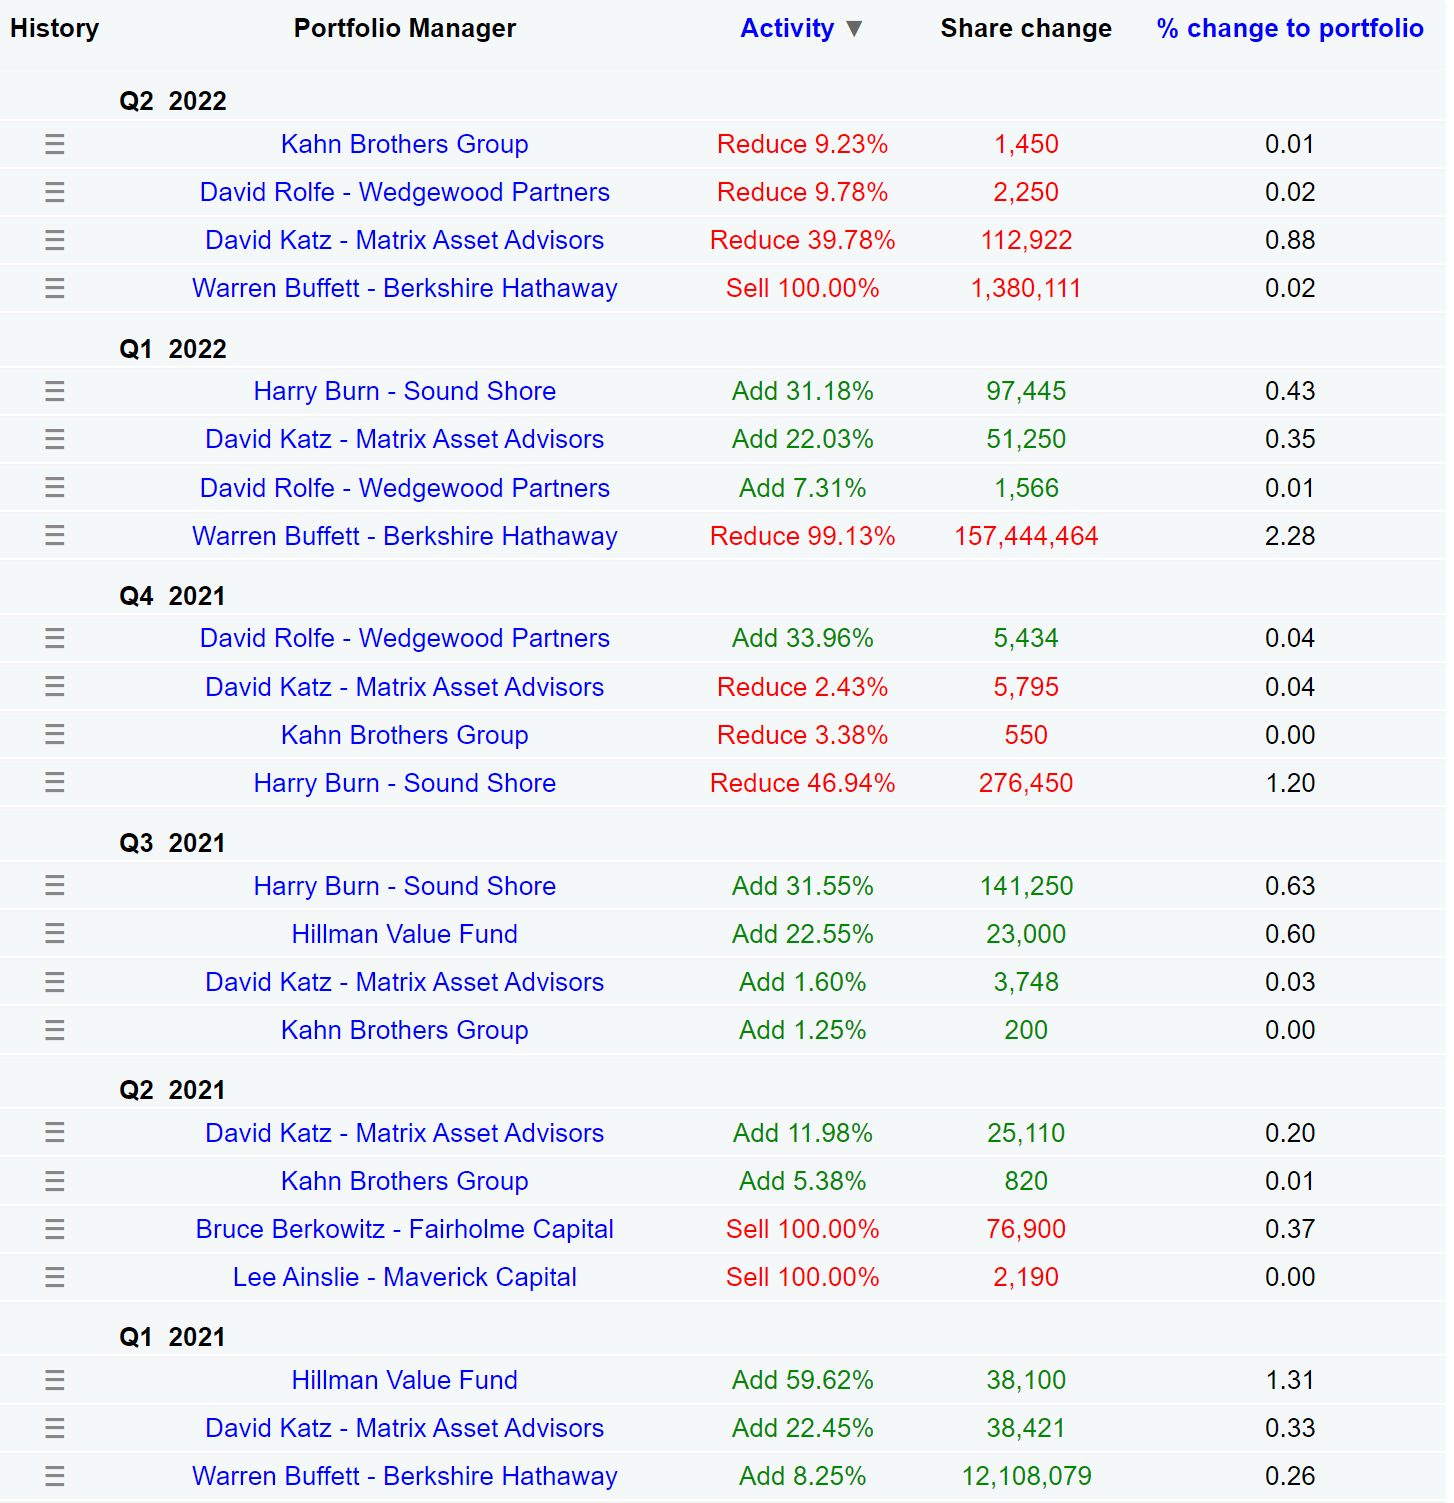
And my view is that after the large correction since Q1 and Q2 of 2022, it has become too compressed to ignore. Buffett should take a look again and consider buying it back. As you can see from the chart below, it is only priced at 5.77x of FW EBT (earnings before taxes), almost discounted by half from the so-called Buffet 10x EBT rule. For readers new to this rule, we have a blog article to describe it in detail with answers to the most frequently received questions. And as you can see from the chart below, Buffett has accumulated his VZ shares almost exclusively near or below 10x EBT. As detailed in our blog article,
Paying 10x EBT for a business that will stagnate forever is like owning a bond with a 10% yield. In VZ’s case here, the current valuation is significantly lower than 10x EBT. It is at 5.77x FW EBT as of this writing, equivalent to purchasing a bond yielding almost 20% (17.3% to be exact) even if its earnings stagnate forever. At the same time, there is a good prospect that VZ will feature some long-term growth with its leading position and secular trend as to be detailed later.
Source: Author based on Seeking Alpha data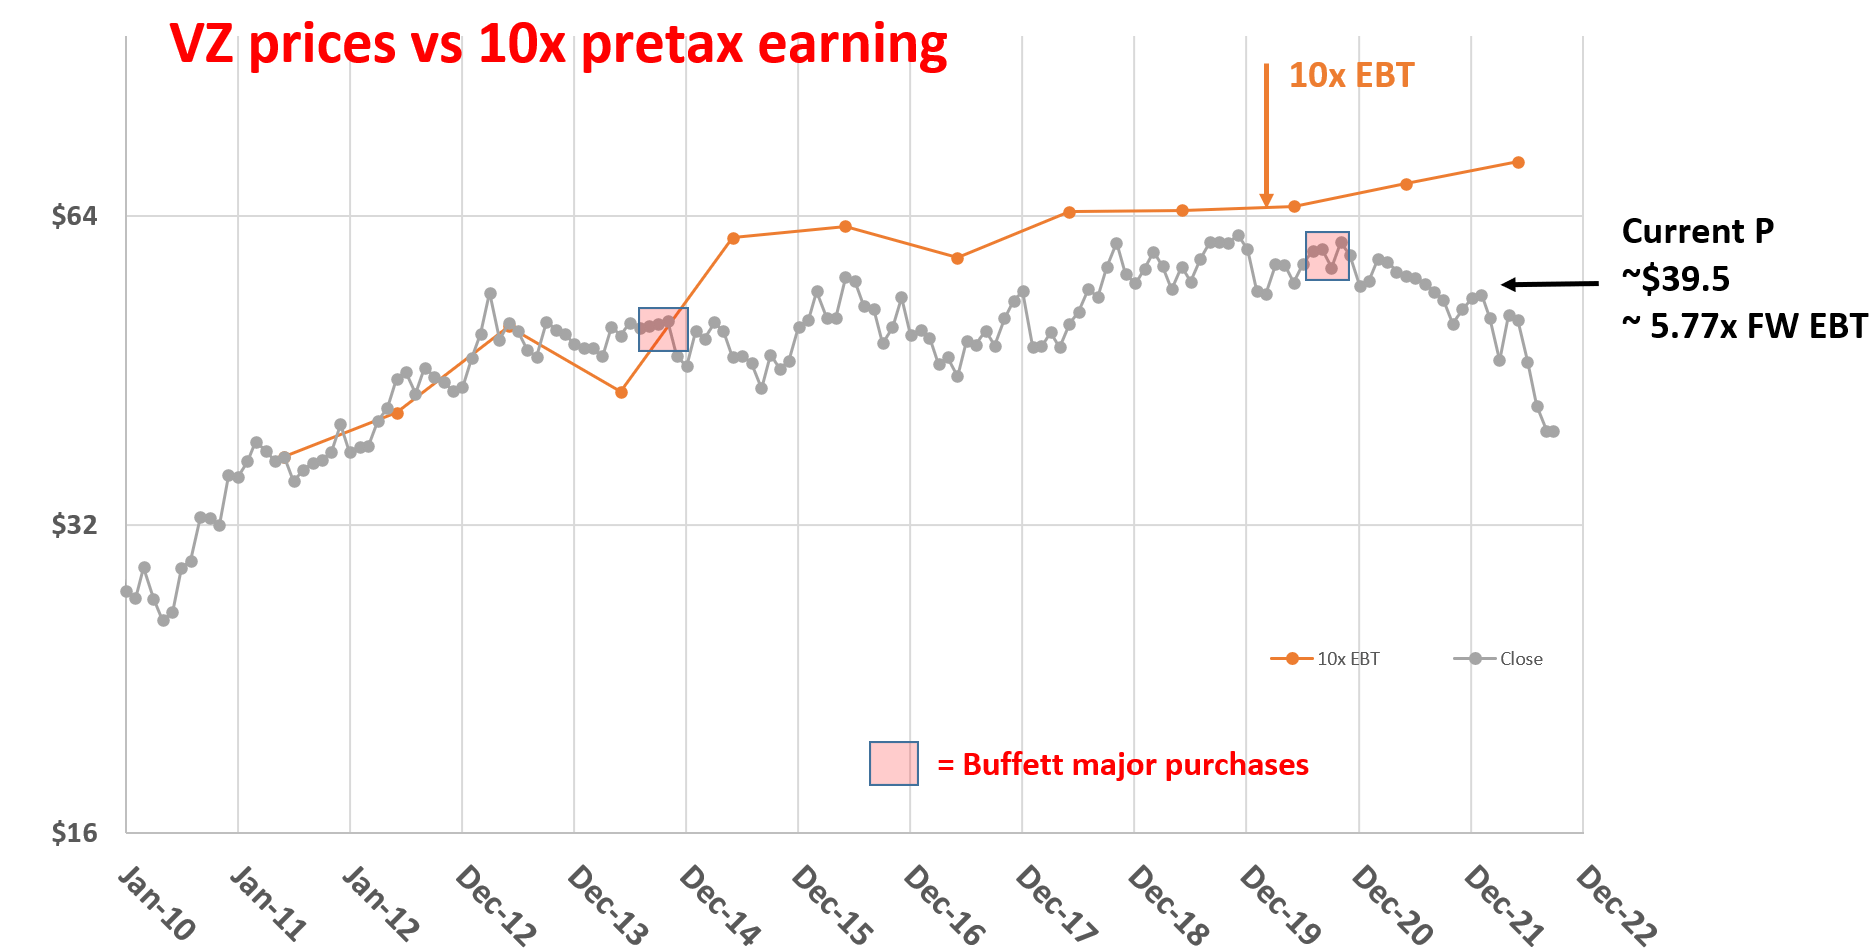
In terms of near-term return potential, a simple discounted dividend model (“DDM”) analysis shows highly asymmetric a risk/reward profile. The next chart also compares its WACC (weighted cost of capital) against the return on capital employed (“ROCE”) for VZ. The ROCE results are directly pulled from my earlier article here and as seen, the ROCE has been on average 30.8%, systematically higher than WACC about 5.7% with a healthy margin.
Source: Author based on Seeking Alpha data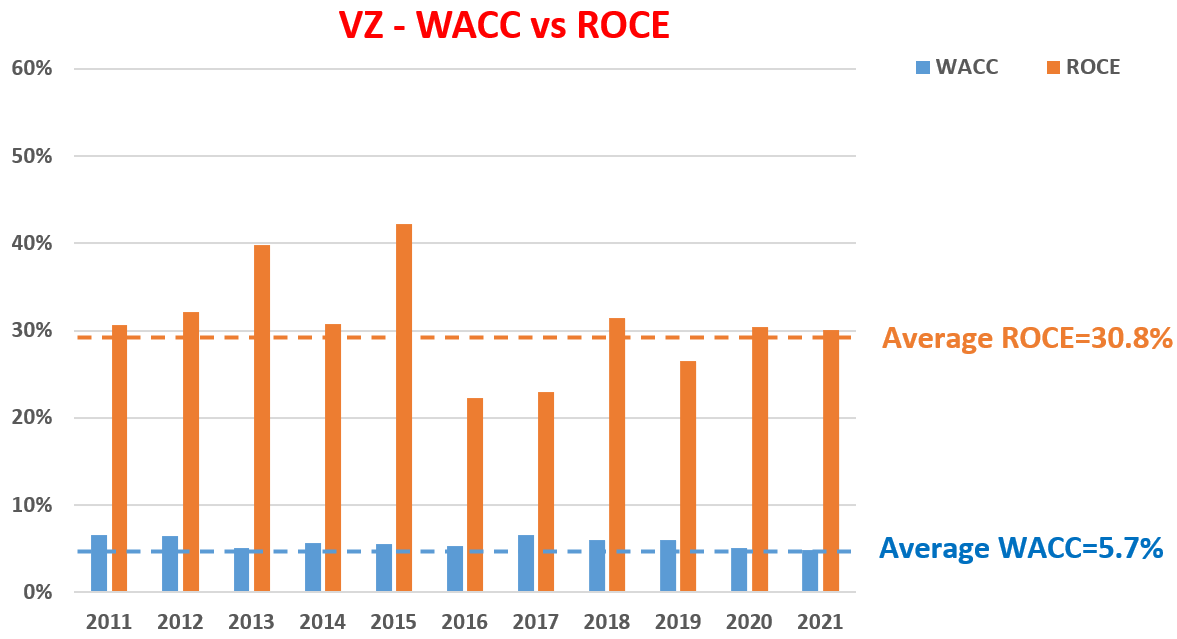
Based on the above WACC and ROCE data, next, I will use the DDM to project returns given VZ’s stable dividends. In the DDM model, the fair value of a business is the summation of all its future dividend payments discounted to their present value. And this analysis uses the WACC as the discount rate because WACC is the minimum required return that a business needs to make to overcome the cost of capital. Therefore, it is the minimum rate that future earnings should be discounted.
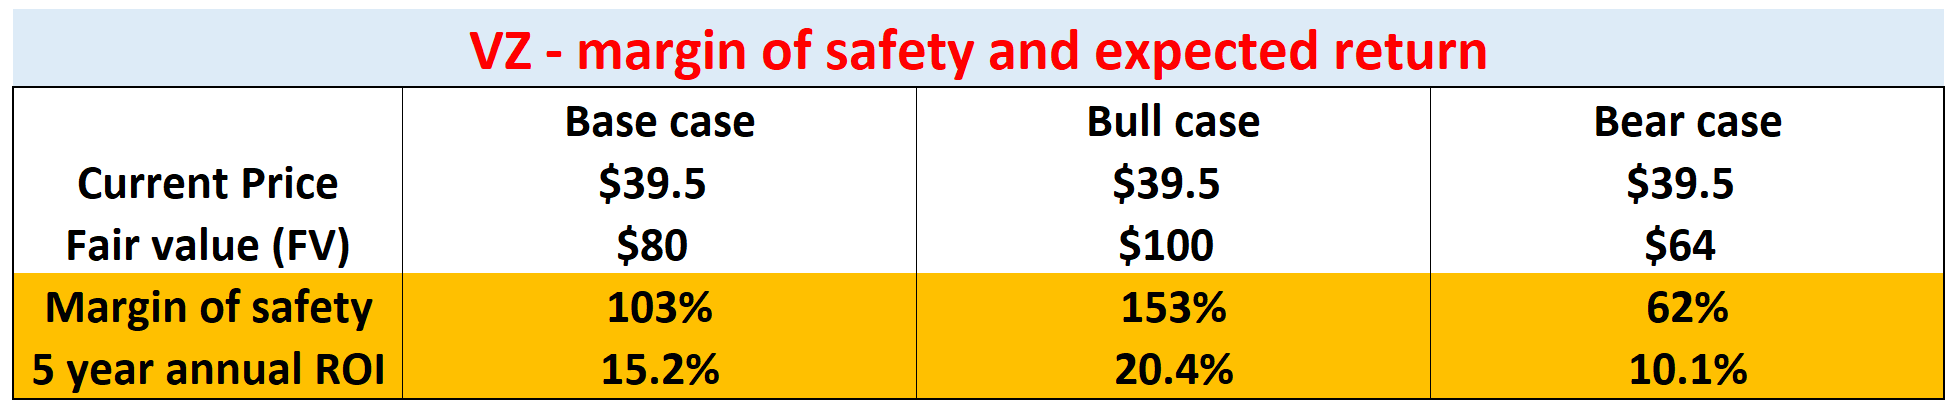
With the above understanding, the DDM calculations for VZ are shown below. It explores a range of possibilities of WACC as it can vary based on borrowing rates and risk-free interest rates. These calculations also considered a range of terminal dividend growth rates (“DGR”), ranging from 1.5 to 4.0%. These are the growth rate that a business can perpetually maintain and usually are in the mid to lower-single digit range. The most probable scenarios in my mind are those in the middle highlighted with red. To wit,
- As a base case, I expect the fair value to be about $80. The base case considers an average WACC and an average growth rate. Even in this case, the current price represents a margin of safety of about 103% and an annual return of 15.2% in the next 3 to 5 years.
- The bull case considers a lucky combination of a higher growth rate and a lower cost of capital. The fair value in this case will be about $100. In this case, investment at the current price features a considerable margin of safety of 153%, and the five-year annual return is estimated to be a whopping almost 20.4%.
- The bear case represents an unlucky combination of higher cost of capital and a lower growth rate. And even in this case, investment at the current price has a sizable margin of safety, about 62%. And the 5 years projected return is projected to be a double-digit 10.1%
Source: Author based on Seeking Alpha data Source: Author based on Seeking Alpha data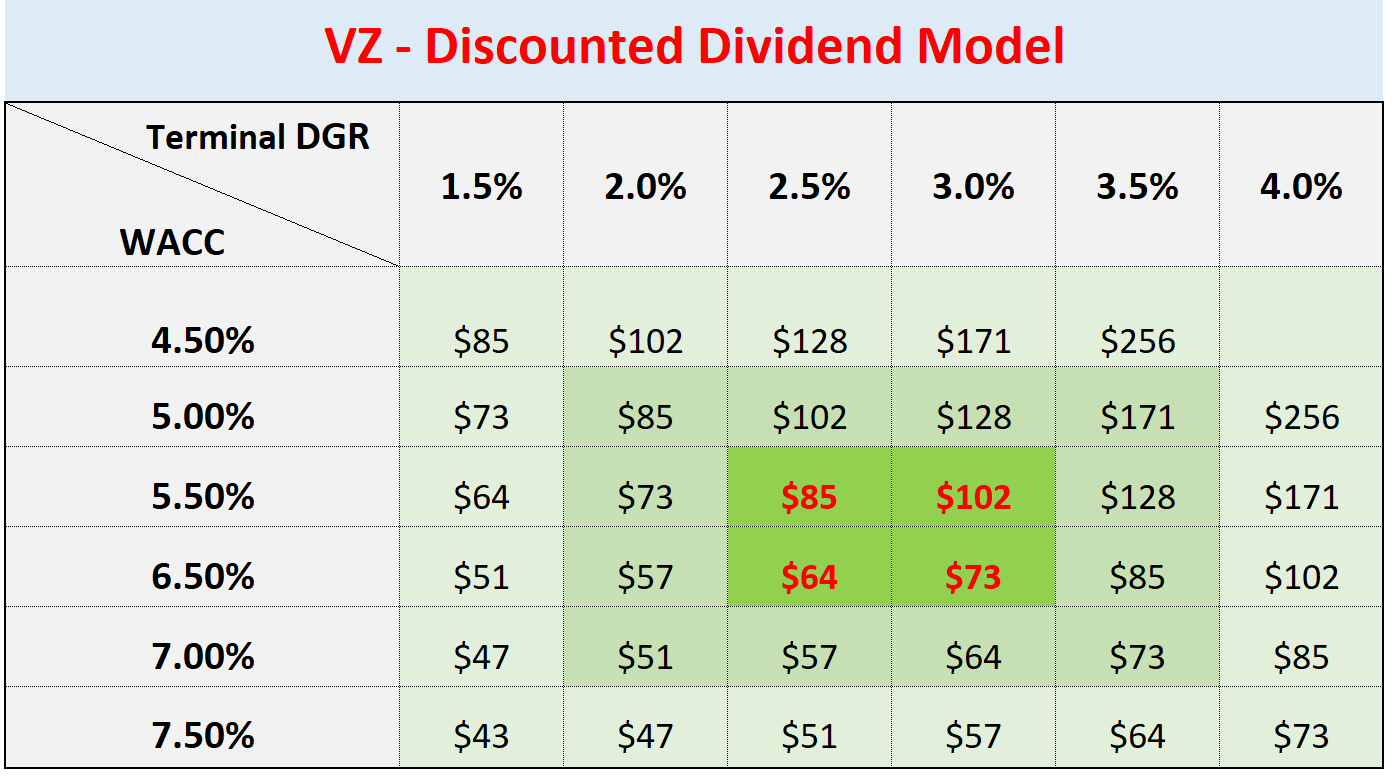
The financial stocks – GS, TROW, and BEN
The financial sector is usually more sensitive to interest rate changes and macroeconomic conditions. And this is the reason why we see a total of 3 of them on the list: GS, TROW, and BEN. My view is that the whole sector has become quite attractive at this time. And these premier banking stocks are even more attractive than the overall sector. GS needs no introduction. TROW and BEN are dividend champions with more than 25 years of consecutive dividend raises.
For GS, we think an entry price between $270 and $290 is attractive based on its book value as reported below. As you can see from the following chart, its Q2 book value is about $301 and its tangible book value is about $278 per share. Buying good banks at or near book value has been proven to be a very successful investment – for obvious reasons. We are only paying for the book and getting everything else (such as future earning power) for free. And this recent GS purchase is just another example. The current price of $302 is getting really close to the target price range. And the same argument and analysis can be extended to TROW and BEN.
Source: GS 2022 Q2 ER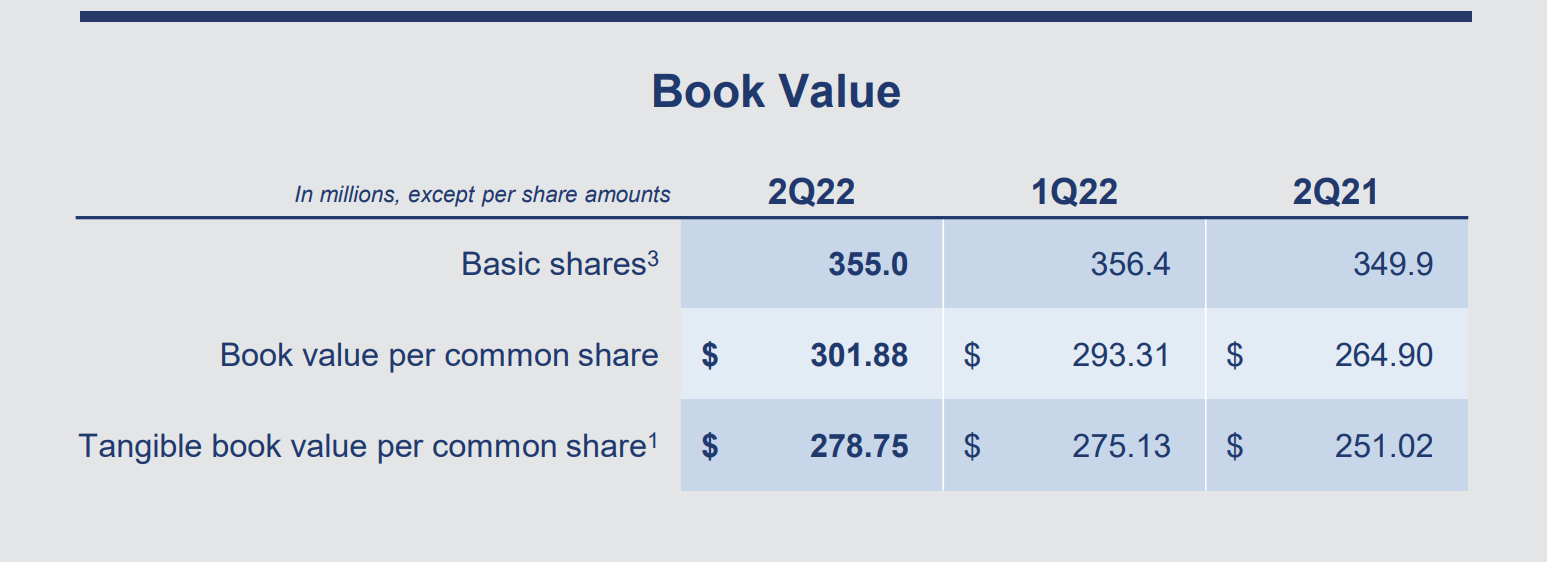
The semis stock – Micron
Our thoughts on MU have been detailed in a recent article focusing on its cyclical nature. There is no doubt in my mind that MU (and the semiconductor sector too) is going through the contraction phase of the cycle. However, as analyzed in my recent article:
As you can see from the chart below, MU’s P/E has led business fundamentals by about 5 to 10 months during the past cycle. And currently, MU is valued at a P/E multiple that is close to its secular bottom already. To wit, MU is currently priced at a P/E of only 5.9x, only a fraction of its historical average and also close to the lowest level in the past ten years.
In my mind, being cyclical does not make MU a bad investment. What makes a bad investment is buying cyclical stocks at cyclically high valuations.
Source: Author based on Seeking Alpha data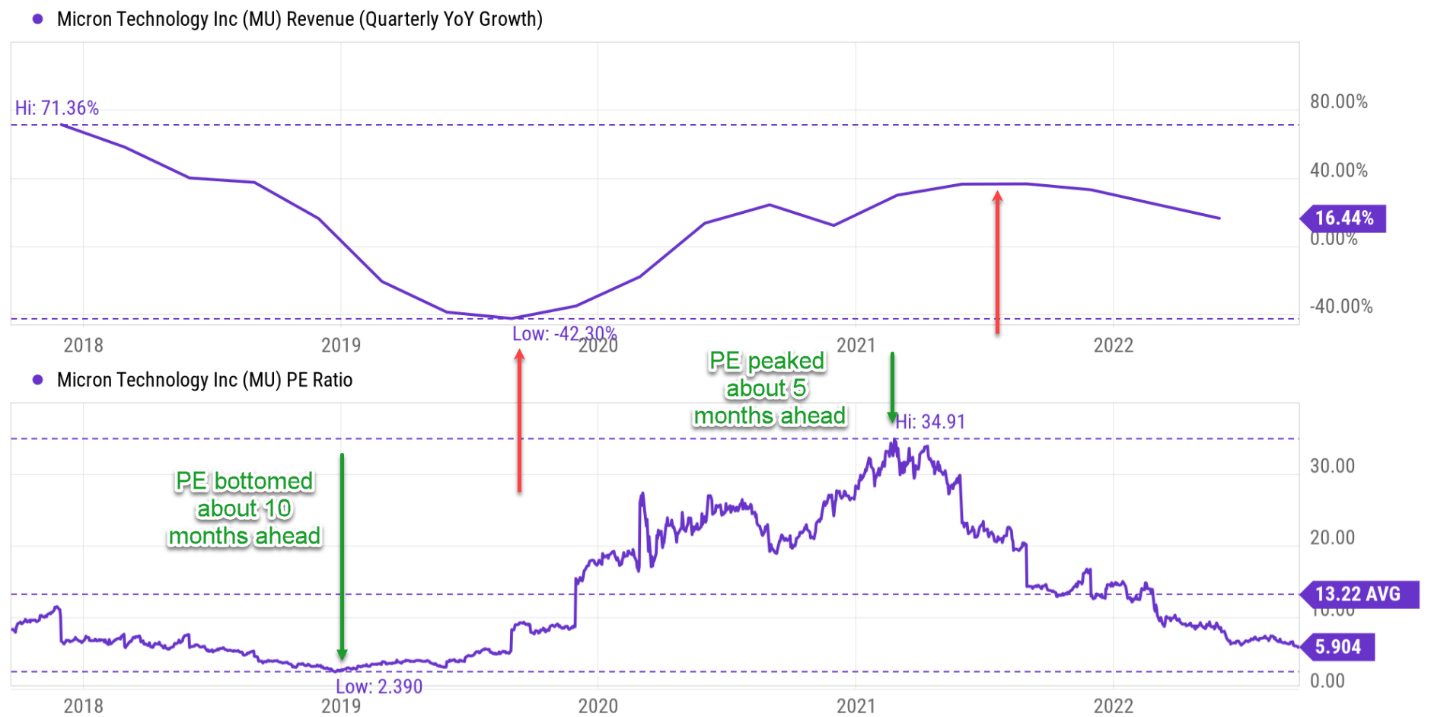
The auto stocks – GM and GT
GM is a stock that Buffett still holds (and has been holding for many years). Berkshire’s equity has been holding GM shares since 2012 and has been gradually adding to the position until the most recent quarter. In the most recent quarter, it trimmed its position by 14.7%. But the position is still sizable with more than 52 million shares and a market value of more than $1.67B.
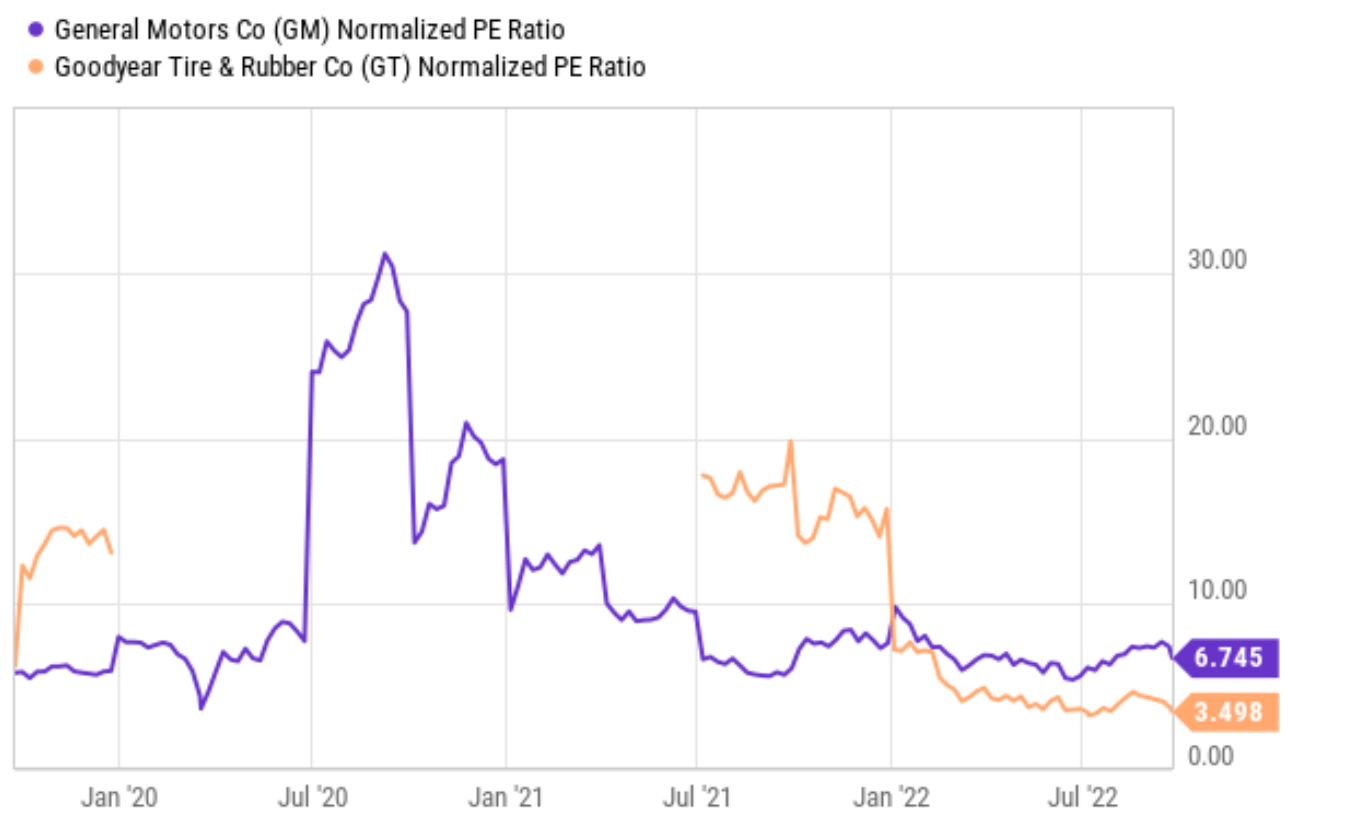
Like the semiconductors, the auto sector is also highly cyclical (probably even more so). And neither GM nor GT is an exception. And also similar to the semiconductors, their valuation has also raced to the bottom already as you can see from the chart below. To wit, GM is currently priced at a P/E of only 6.74 and GT at 3.5x, both near the bottom level in a decade.
Source: Data Roma Source: Author based on Seeking Alpha data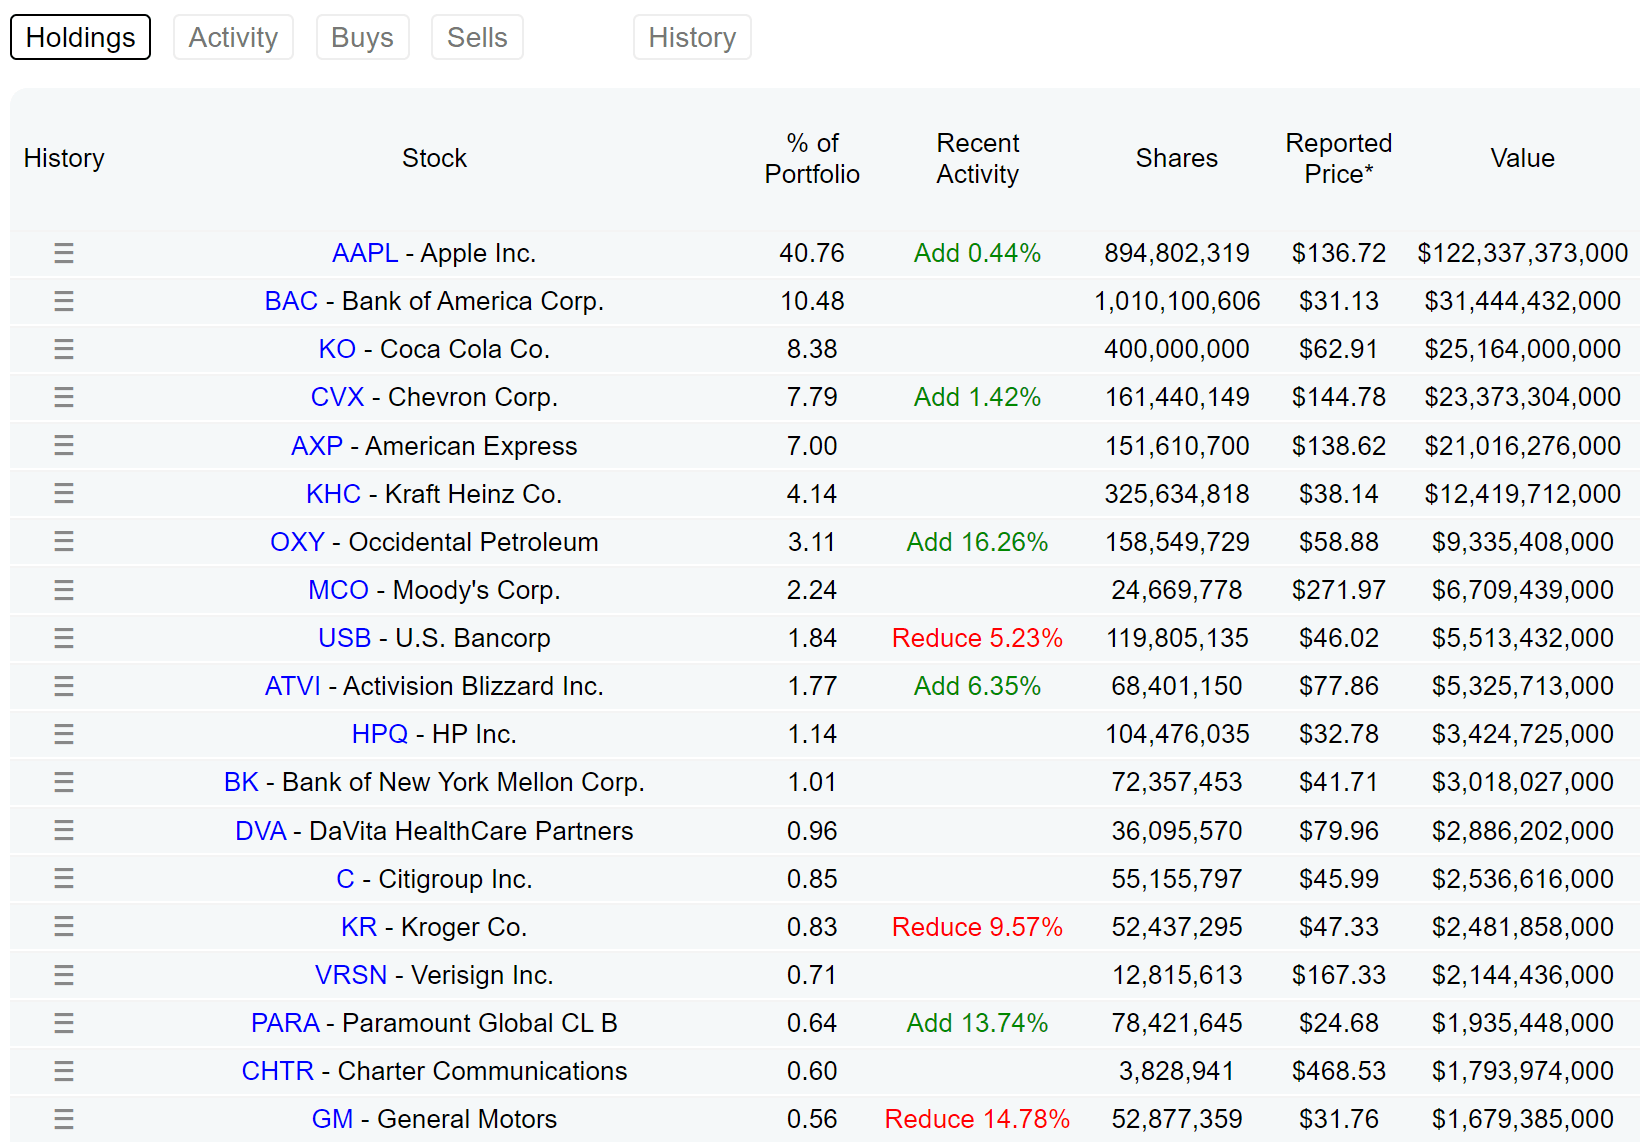
The small/micro caps – WW and BZH
Now we finally have two small/micro caps on the list: WW and BZH. WW is a provider of weight loss services, with operations across the world. It is serving North America (roughly 67% of 2021 revenue); Continental Europe (25%); the United Kingdom (5%); and also others (3%). The company uses weekly classroom meetings and online subscriptions to promote lifestyle changes. BZH is a Residential Construction firm. It builds and sells single-family homes in 13 states.
As you can tell from their nature of business and their market cap, both stocks are extremely sensitive to macroeconomic conditions and feature the highest risk/return profile in this list. Take WW as an example. Its business is under quite a bit of pressure. At the end of the first quarter of 2022, it had 4.5 million program subscribers, down from 5.0 million a year ago. For the full-year 2022, my estimate is that the company’s top line will suffer a decline of nearly 10%. However, I anticipate some improvement in the next few years as the business turns around and also the overall economy improves. Notably, its new CEO Sima Sistani has considerable experience in the digital media marketplace. Many initiatives are afoot under the new leadership through both digital platforms and in-person workshops.
Other risks and final thoughts
Finally, risks. Besides the risks mentioned throughout the article, let me elaborate a bit more on the risks associated with the thought experiment of liquidating all BRK’s equity investments and cash position. These risks have been mentioned in my other articles and a summary is provided below. These same risks can be extended to the estimate of the BV of the financial stocks too.
- My thought experiment assumed BRK’s cash position and equity investment are worth exactly the market price. This is a reasonable assumption given the liquidity of the holdings – they are mostly large mega-cap and large-cap businesses with large trading volumes. However, no one really knows what would actually happen when you try to liquidate $300+ billion worth of stocks. So there are definitely some uncertainties in the math above.
- BRK’s cash position and its insurance float. This analysis also assumed that all the cash positions are truly cash can. However, in reality, this is not entirely true because part of the cash is insurance float and cannot be entirely liquidated as assumed in my thought experiment above. But there are also good reasons to take the cash position out of the stock price (or some part of it). Cash is cash nonetheless – that is, if someone buys BRK completely, every $1 in the float counts as $1. And there is a very low chance – though probably no one, including Buffett himself knows how low the chance is – that all the float will be needed. Buffett mentioned that he will at least maintain a cash position of about $30B. So I am guessing we could use $30B as a minimum for estimating the float. Taking $30B out of the cash will make the valuations a bit higher than what’s presented above, but not by too much.
To conclude, the recent sell-off created an attractive entry window for value investors. The market is not quite raining gold yet. For us, the next trigger point is an EI of 6% (i.e., about 11% of combined correction in the equity and bond market) and the next one is an EI of 7%. So now is definitely a good time to get a shopping list handy. If you have been following our articles, you know that we believe in the timeless power of holding a diversified group of quality stocks at attractive valuations. We also promote concentrated bets. And above all, we promote a barbell strategy so you can completely delineate survival from growth. Nothing hurts long-term return (or even survival) more than needing capital when the market is in a fire sale. The 10 stocks chosen here offer a good balance of diversification, market caps, quality, and outsized return potentials.
Specifically, we think BRK and VZ are attractive candidates for more conservative accounts. The financial sector is overall attractive, and the candidates in this list (GS, TROW, and BEN) are even more so than the overall sector. Lastly, if you are more risk-prone, the highly cyclical stocks (such as semiconductor and auto) and small/micro caps are worth considering too.
Be the first to comment