

AscentXmedia/E+ via Getty Images
Today, retirees are faced with a very tough situation.
This Wednesday, the March CPI report is expected to show 8.4% inflation, the highest in 41 years.
Daily Shot 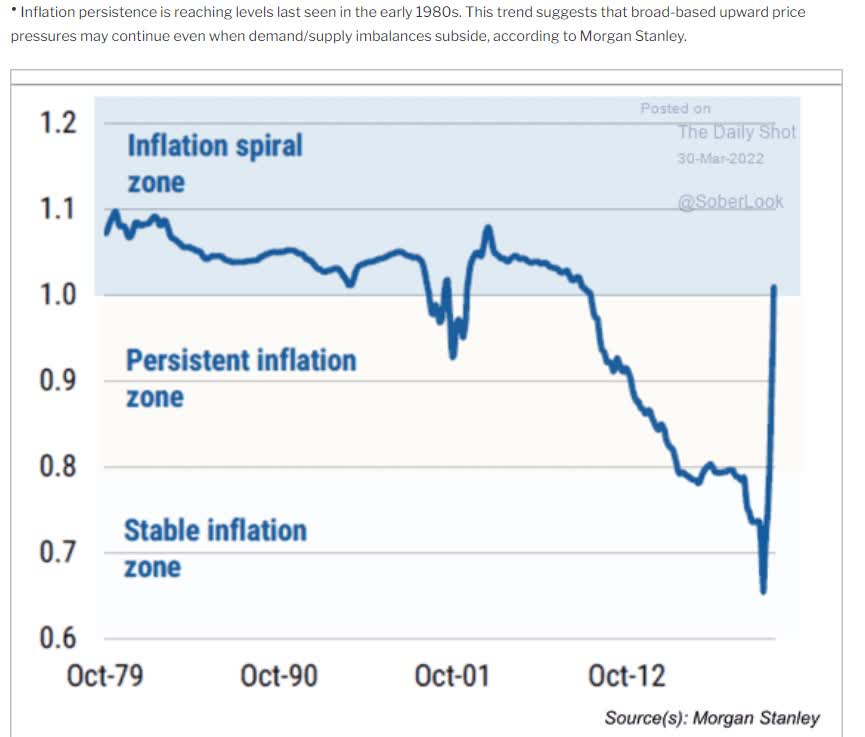
Morgan Stanley estimates we are now at risk of an inflationary spiral.
The good news is that the bond market doesn’t believe that the Fed will fail to get inflation under control, relatively speaking.
YCharts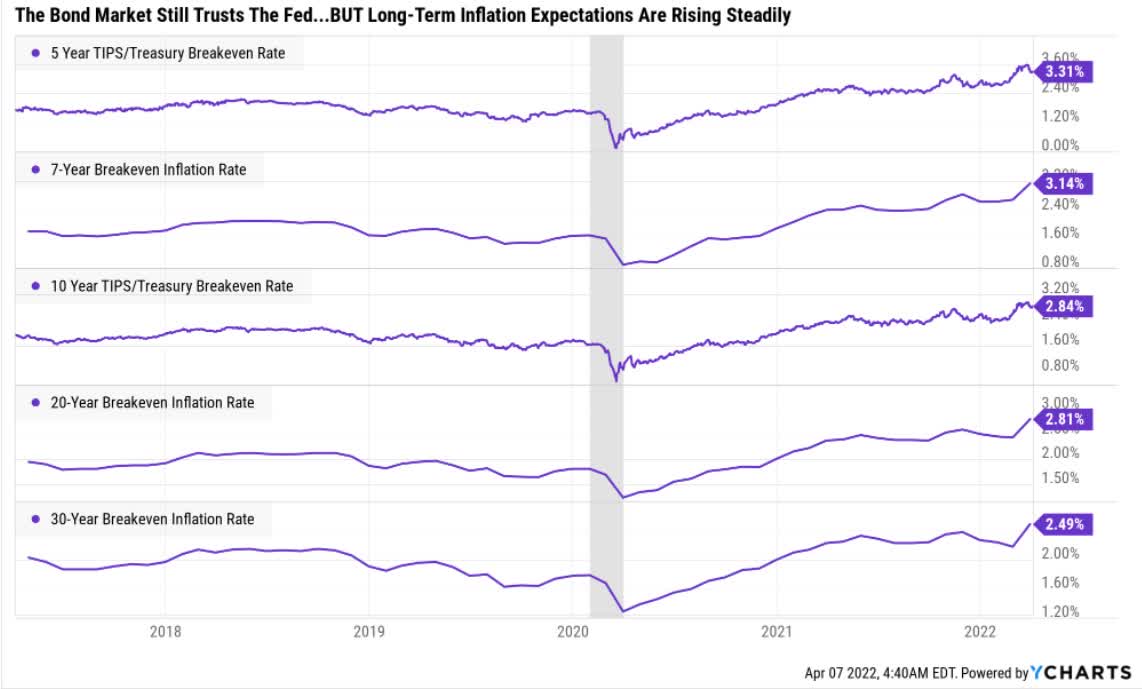
However, inflation of nearly 3% is now expected over the next 20 years and over the next 30 years, 2.5% inflation is slightly above the Fed’s 2% target.
Retirement dream stocks are companies that fulfill three criteria:
- High safety and dependability in all economic conditions
- A generous yield
- Long-term dividend growth that outpaces inflation over time
While interest rates have soared in recent months, they are still very low by historical standards, and adjusted for inflation are deeply negative.
Going out on the risk spectrum with bonds doesn’t help all that much.
- Junk bonds now yield 4.4% (still negative inflation-adjusted yield)
- An average credit rating of “B” means a 37% risk of default
But fortunately, there is an easy way to find the world’s highest quality 5+% yielding blue-chips, that can not only deliver generous and very safe income today, but long-term dividend growth that’s more than 3x the expected rate of inflation.
- All within a diversified and prudently risk-managed blue-chip portfolio
- That can withstand virtually anything the economy can throw at us in the coming years and decades
How To Find The Best High-Yield Blue-Chips In Any Economic Environment
DK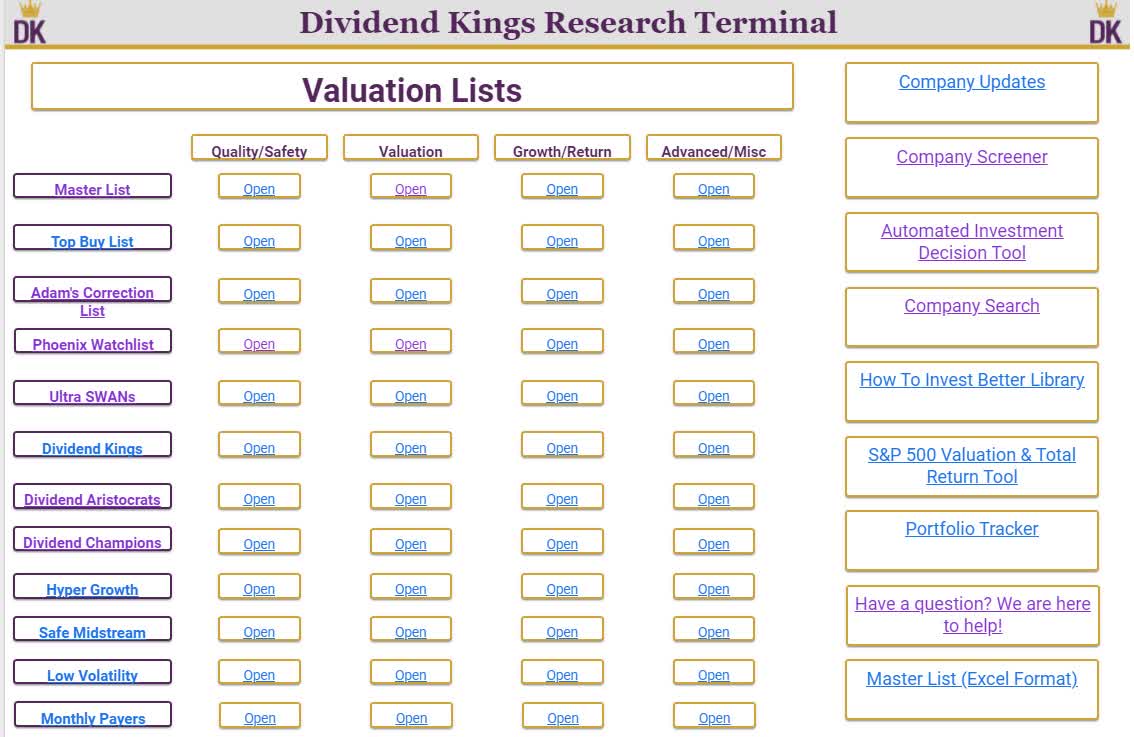
The Dividend Kings Research Terminal has 12 specialty watchlists for virtually any kind of investing goal, time horizon, or risk profile.
Each watchlist can be sorted by 16 fundamental metrics, to help you find the best companies for your needs in seconds.
- In the next week or two, we’re unveiling a new super tool that will be even simpler and easier to use
Adam’s correction watchlist is my personal watchlist for all future market downturns.
- It’s the only watchlist I’m personally buying from in every pullback, correction, and bear market
Adam’s Correction Watchlist Sorted By Yield (DK Research Terminal)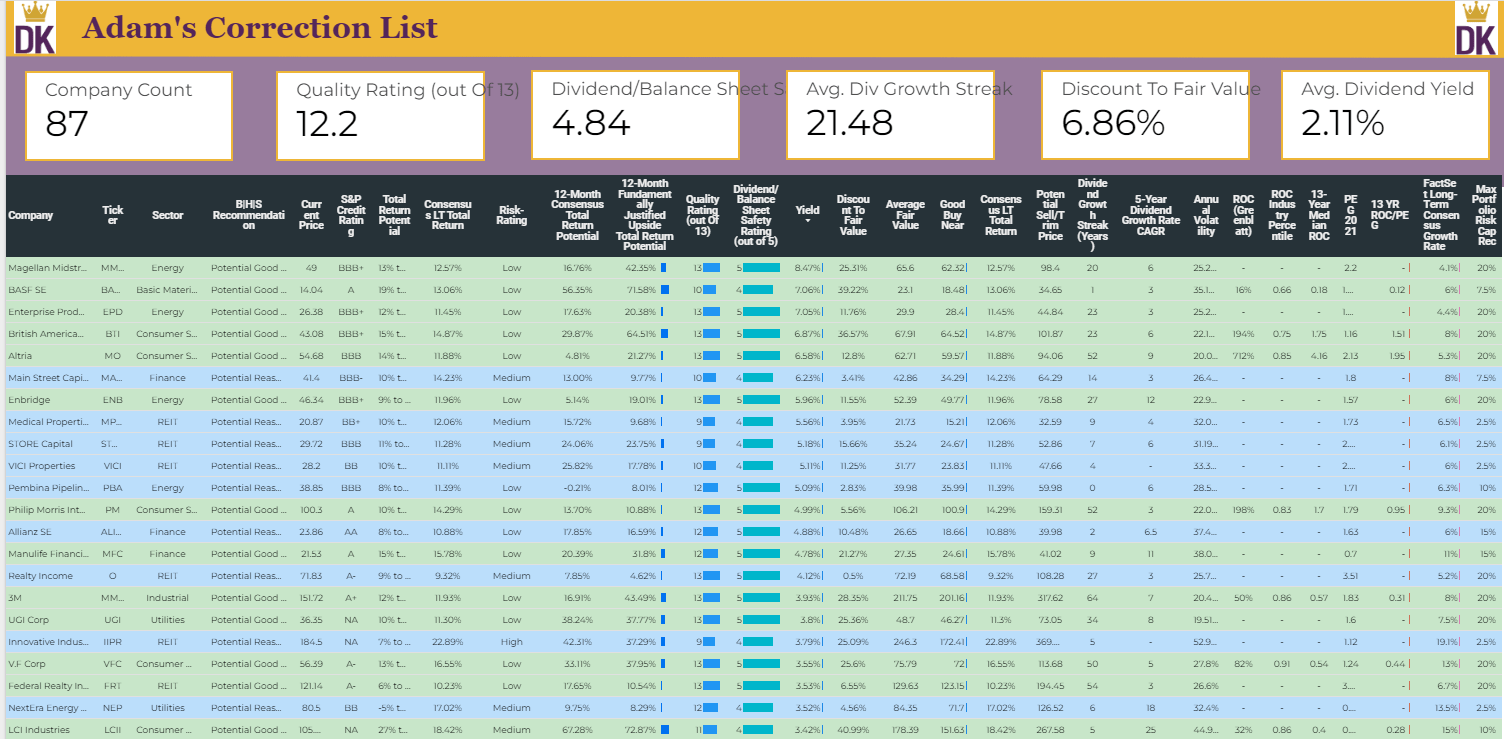
- Green = potentially good buy or better
- Blue = potential reasonable buy
- Yellow = hold
- Red = potential trim/sell
By sorting by any fundamental metrics you want, you can put together a dream watchlist of the best companies for your specific needs, time horizon, and risk profile.
And that’s how I was able to very easily find the following 5% yielding retirement dream blue-chip bargains.
- The highest yielding blue-chip in each sector
10 Retirement Dream Stock Bargains You Won’t Want To Miss
(Source: DK Research Terminal)
Here we have 10 high-yield companies in every major sector of the economy, from three countries on two continents.
Why do I personally own them all and trust them with my future retirement savings?
Fundamental Quality You Can Trust In All Economic Conditions
| Company | Quality Rating (out Of 13) | Quality Score (Out Of 100) | Dividend/Balance Sheet Safety Rating (out of 5) | Safety Score (Out Of 100) | Dependability Rating (Out Of 5) | Dependability Score (out Of 100) |
| Magellan Midstream Partners (uses K-1) | 13 | 85% | 5 | 86% | 5 | 83% |
| BASF SE | 10 | 76% | 4 | 74% | 4 | 75% |
| British American Tobacco | 13 | 87% | 5 | 84% | 5 | 90% |
| Main Street Capital | 10 | 69% | 4 | 64% | 4 | 79% |
| Medical Properties Trust | 9 | 64% | 4 | 64% | 3 | 63% |
| 3M | 13 | 92% | 5 | 94% | 5 | 88% |
| UGI Corp | 13 | 87% | 5 | 93% | 5 | 83% |
| V.F. Corp | 13 | 98% | 5 | 100% | 5 | 100% |
| Merck | 13 | 91% | 5 | 94% | 5 | 87% |
| Qualcomm | 13 | 93% | 5 | 93% | 5 | 93% |
| Average | 11.9 Super SWAN | 83.2% | 4.7 Very Safe | 83.7% | 4.6 Exceptional | 83.1% |
(Source: DK Research Terminal)
For context, the dividend aristocrats’ average 12.1/13 Super SWAN quality.
These high-yield Super SWANs basically match the aristocrats on quality and offer some of the highest safe yield on earth from a fully diversified portfolio.
How safe?
| Rating | Dividend Kings Safety Score (153 Point Safety Model) | Approximate Dividend Cut Risk (Average Recession) |
Approximate Dividend Cut Risk In Pandemic Level Recession |
| 1 – unsafe | 0% to 20% | over 4% | 16+% |
| 2- below average | 21% to 40% | over 2% | 8% to 16% |
| 3 – average | 41% to 60% | 2% | 4% to 8% |
| 4 – safe | 61% to 80% | 1% | 2% to 4% |
| 5- very safe | 81% to 100% | 0.5% | 1% to 2% |
| 10 High-Yield Retirement Dream Stocks | 84% | 0.50% | 1.80% |
| Risk Rating | Low-Risk (70th industry percentile risk-management consensus) – speculative | BBB+ Stable outlook credit rating 5.2% 30-year bankruptcy risk |
15% OR LESS Max Risk Cap Recommendation (Each) |
(Source: DK Research Terminal)
The risk of a dividend cut in a historically average recession is about 1 in 200 and the risk in a severe Pandemic or Great Recession downturn is about 1 in 56.
| Company | Payout Ratio | Industry Safe Payout Ratio Guideline | Debt/Capital | Industry Safe Debt/Capital Guideline |
| Magellan Midstream Partners (uses K-1) | 78% | 83% | 73% | 60% |
| BASF SE | 86% | 60% | 25% | 40% |
| British American Tobacco | 70% | 85% | 48% | 60% |
| Main Street Capital | 95% | 95% | 45% | 50% |
| Medical Properties Trust | 79% | 95% | 57% | 50% |
| 3M | 60% | 60% | 50% | 40% |
| UGI Corp | 48% | 75% | 57% | 60% |
| V.F. Corp | 78% | 60% | 57% | 40% |
| Merck | 44% | 60% | 37% | 40% |
| Qualcomm | 29% | 50% | 51% | 40% |
| Average | 70.9% | 74.8% | 49.9% | 48.9% |
(Source: DK Research Terminal)
Safe payout ratios and sound balance sheets are just the beginning of how we determine whether a company’s dividend is dependable.
The Dividend King’s overall quality scores are based on a 243 point model that includes:
-
Dividend safety
-
Balance sheet strength
-
Credit ratings
-
Credit default swap medium-term bankruptcy risk data
-
Short and long-term bankruptcy risk
-
Accounting and corporate fraud risk
-
Profitability and business model
-
Growth consensus estimates
-
Management growth guidance
-
Historical earnings growth rates
-
Historical cash flow growth rates
-
Historical dividend growth rates
-
Historical sales growth rates
-
Cost of capital
-
Long-term risk-management scores from MSCI, Morningstar, FactSet, S&P, Reuters’/Refinitiv, and Just Capital
-
Management quality
-
Dividend friendly corporate culture/income dependability
-
Long-term total returns (a Ben Graham sign of quality)
-
Analyst consensus long-term return potential
In fact, it includes over 1,000 fundamental metrics including the 12 rating agencies we use to assess fundamental risk.
How do we know that our safety and quality model works well?
During the two worst recessions in 75 years, our safety model predicted 87% of blue-chip dividend cuts, the ultimate baptism by fire for any dividend safety model.
And then there’s the confirmation that our quality ratings are very accurate.
DK Zen Phoenix: Superior Fundamentals Lead To Superior Long-Term Results
| Metric | US Stocks | 189 Real Money DK Phoenix Recs |
| Great Recession Dividend Growth | -25% | 0% |
| Pandemic Dividend Growth | -1% | 6% |
| Positive Total Returns Over The Last 10 Years | 42% | 99.5% (Greatest Investors In History 60% to 80% Over Time) |
| Lost Money/Went Bankrupt Over The Last 10 Years | 47% | 0.5% |
| Outperformed Market Over The Last Decade (296%) | 36% | 52% |
| Bankruptcies Over The Last 10 Years | 11% | 0% |
| Permanent 70+% Catastrophic Decline Since 1980 | 44% | 0.5% |
| 100+% Total Return Over The Past 10 Years | NA | 87% |
| Sources: Morningstar, JPMorgan, Seeking Alpha |
Basically, historical market data confirms that the DK safety and quality model is one of the most comprehensive and accurate in the world.
This is why I entrust 100% of my life savings to this model and the DK Phoenix blue-chip strategy.
| Company | Long-Term Risk Management Consensus Industry Percentile | Risk-Rating | Risk-Management Rating | S&P Credit Rating | Credit Rating Outlook | 30-Year Bankruptcy Risk |
| Magellan Midstream Partners (uses K-1) | 69% | Low | Above-Average | BBB+ | Stable | 5.00% |
| BASF SE | 70% | Low | Good | A | Stable | 0.66% |
| British American Tobacco | 82% | Low | Very Good | BBB+ | Negative | 5.00% |
| Main Street Capital | NA | Medium | NA | BBB- | Stable | 11.00% |
| Medical Properties Trust | 32% | Medium | Below-Average | BB+ | Stable | 14.00% |
| 3M | 87% | Low | Very Good | A+ | Negative | 0.60% |
| UGI Corp | 67% | Low | Above-Average | NA | NA | 7.50% |
| V.F. Corp | 71% | Low | Good | A- | Stable | 2.50% |
| Merck | 82% | Low | Very Good | A+ | Stable | 0.60% |
| Qualcomm | 78% | Low | Good | A | Stable | 0.66% |
| Average | 70.0% | Low | Good | BBB+ | Stable | 5.2% |
(Source: DK Research Terminal)
S&P estimates the average risk of these high-yield blue-chips going bankrupt over the next 30 years at 5.2%.
Six rating agencies estimate their long-term risk management in the top 30% of their peers.
Long-Term Risk Management In Context
| Classification | Average Consensus LT Risk-Management Industry Percentile |
Risk-Management Rating |
| S&P Global (SPGI) #1 Risk Management In The Master List | 94 | Exceptional |
| Strong ESG Stocks | 78 |
Good – Bordering On Very Good |
| Foreign Dividend Stocks | 75 | Good |
| Ultra SWANs | 71 | Good |
| 10 High-Yield Retirement Dream Stocks | 70 | Good |
| Low Volatility Stocks | 68 | Above-Average |
| Dividend Aristocrats | 67 | Above-Average |
| Dividend Kings | 63 | Above-Average |
| Master List average | 62 | Above-Average |
| Hyper-Growth stocks | 61 | Above-Average |
| Monthly Dividend Stocks | 60 | Above-Average |
| Dividend Champions | 57 | Average |
(Source: DK Research Terminal)
In a scary world full of risk, these high-yield blue-chips know how to adapt, overcome, and thrive.
More Evidence These Are High-Yield Blue-Chips You Can Trust
| Company | Dividend Growth Streak (Years) | ROC (Greenblatt) | ROC Industry Percentile | 13-Year Median ROC |
| Magellan Midstream Partners (uses K-1) | 20 | NA | NA | NA |
| BASF SE | 1 | 16% | 66% | 18% |
| British American Tobacco | 23 | 194% | 75% | 175% |
| Main Street Capital | 14 | NA | NA | NA |
| Medical Properties Trust | 9 | NA | NA | NA |
| 3M | 64 | 50% | 86% | 57% |
| UGI Corp | 34 | NA | NA | NA |
| V.F. Corp | 50 | 82% | 91% | 54% |
| Merck | 10 | 115% | 93% | 52% |
| Qualcomm | 18 | 345% | 97% | 262% |
| Average | 25.0 | 91.4% | 82.2% | 71.3% |
(Source: DK Research Terminal)
Ben Graham considered a 20+ year dividend growth streak to be a sign of excellent quality.
Justin Law If a company has grown its dividends for 20+ years, there is very little risk that it will cut its dividend or even fail to keep raising it in all economic and industry conditions.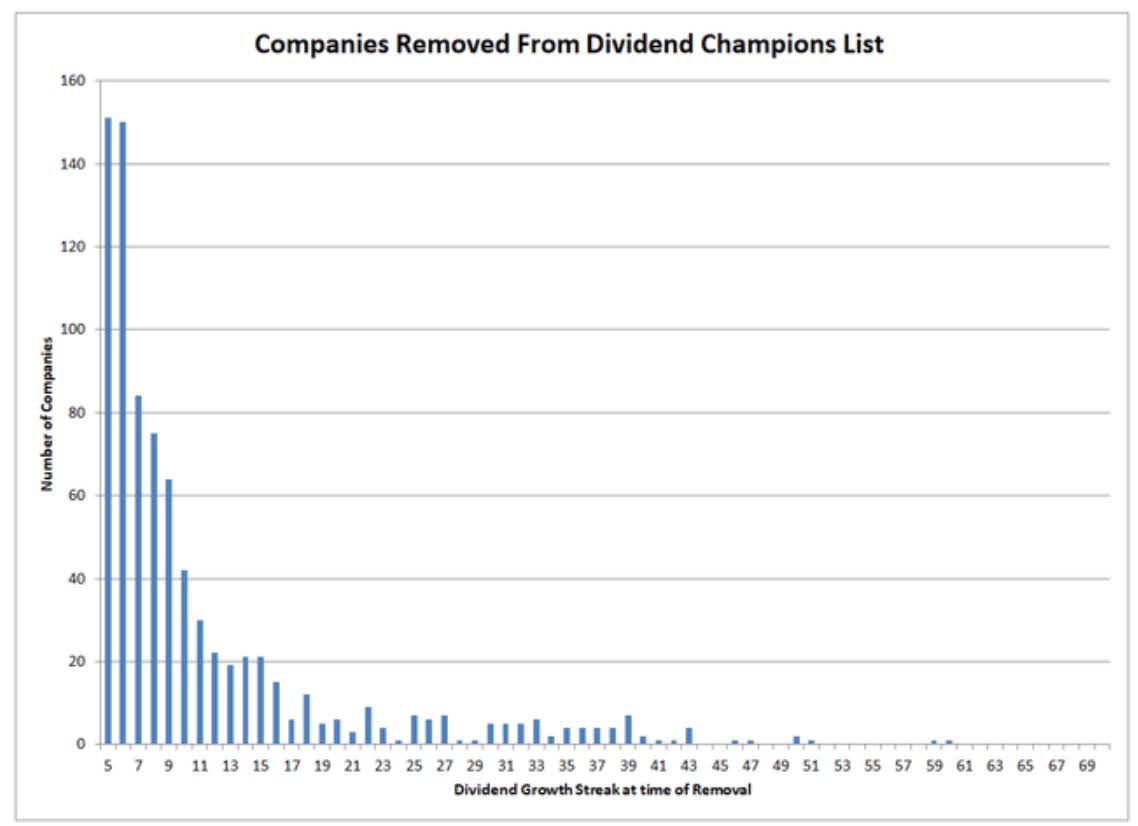
The average dividend growth streak for these high-yield blue-chips is 25 years, achieving the Graham standard of excellence and making this effectively an aristocrat portfolio.
Return on capital is pre-tax profit/operating capital (the money it takes to run the business).
- Joel Greenblatt’s gold standard proxy for quality and moatiness
The S&P 500’s 2021 ROC was 14.6%.
- On average, it takes the typical S&P company about 7 years to recoup investments they make
The average return on capital for these high yield blue-chips is 91%.
- Average investment recouped in 13 months
- 6.2x higher quality than the average S&P 500 company according to one of the greatest investors in history
These aristocrats’ ROC is in the top 18% of their industries, confirming a wide moat.
ROC is 20% higher than their 13-year median, confirming a stable or improving moat.
OK, so now you know why I trust these 10 high-yield blue-chips with my money. But here’s why you might want to buy them today.
Why You Might Want To Buy These 10 High-Yield Blue-Chips Today
| Company | Discount To Fair Value | PE/EBITDA/FFO 2022 | Earnings Yield 2022 | 12-Month Consensus Total Return Potential | 12-Month Fundamentally Justified Upside Total Return Potential |
| Magellan Midstream Partners (uses K-1) | 25.4% | 9.0 | 11.1% | 16.9% | 42.5% |
| BASF SE | 39.3% | 8.8 | 11.3% | 48.6% | 71.7% |
| British American Tobacco | 36.8% | 9.2 | 10.8% | 30.4% | 65.2% |
| Main Street Capital | 3.7% | 14.3 | 7.0% | 13.4% | 10.1% |
| Medical Properties Trust | 3.7% | 11.2 | 8.9% | 15.4% | 9.4% |
| 3M | 28.8% | 14.6 | 6.9% | 15.8% | 44.5% |
| UGI Corp | 26.1% | 11.9 | 8.4% | 39.9% | 39.4% |
| V.F. Corp | 26.8% | 15.8 | 6.3% | 35.3% | 40.2% |
| Merck | 17.4% | 11.9 | 8.4% | 5.8% | 24.0% |
| Qualcomm | 20.0% | 11.4 | 8.8% | 64.9% | 27.2% |
| Average | 23.1% | 11.9 | 8.8% | 24.6% | 38.6% |
(Source: DK Research Terminal)
The last time the S&P 500 traded at 11.9x earnings was April 2009, right after the bottom in the Great Recession.
These high-yield blue chips are 23% historically undervalued. Now compare that to the S&P 500.
S&P 500 Valuation Profile
| Year | EPS Consensus | YOY Growth | Forward PE | Blended PE | Overvaluation (Forward PE) |
Overvaluation (Blended PE) |
| 2021 | $206.17 | 50.20% | 20.7 | 21.8 | 20% | 24% |
| 2022 | $226.13 | 9.68% | 19.6 | 20.2 | 14% | 15% |
| 2023 | $248.93 | 10.08% | 17.8 | 18.7 | 4% | 6% |
| 2024 | $275.29 | 10.59% | 16.1 | 17.0 | -6% | -4% |
| 12-Month forward EPS | 12-Month Forward PE | Historical Overvaluation | PEG | 25-Year Average PEG | S&P 500 Dividend Yield |
25-Year Average Dividend Yield |
| $234.18 | 19.098 | 13.34% | 2.25 | 3.62 | 1.42% | 2.01% |
(Source: Dividend Kings S&P 500 Valuation And Total Return Tool) updated as of 4/11
The market, even after the recent sell-off, is still 13% historically overvalued.
- 16.85 is the 25-year average
- 16.9 is the 10-year average (low rate era)
- 16.9 is the 45-year average
- 91% probability that stocks are worth about 17x forward earnings
- An 11.8% correction needed to get back to the historical market fair value
In contrast, these high-yield blue-chips are so undervalued analysts expect them to deliver 25% total returns in just the next year alone.
- 39% total return to fair value including dividends if they return to fair value within a year
Ok, so we have:
- 10 high-yield blue-chips with impeccable safety, dependability, and quality
- Trading at bargain valuations not seen since the darkest days of the Great Recession
And here’s why I actually own these companies in my retirement portfolio.
Long-Term Return Fundamentals That Can Help You Potentially Retire In Safety And Splendor
| Company | Yield | FactSet Long-Term Consensus Growth Rate | LT Consensus Total Return Potential | LT Risk-Adjusted Expected Return |
| Magellan Midstream Partners (uses K-1) | 8.5% | 3.6% | 12.1% | 8.5% |
| BASF SE | 7.1% | 6.0% | 13.1% | 9.1% |
| British American Tobacco | 6.9% | 8.0% | 14.9% | 10.4% |
| Main Street Capital | 6.3% | 8.0% | 14.3% | 10.0% |
| Medical Properties Trust | 5.5% | 6.5% | 12.0% | 8.4% |
| 3M | 4.0% | 8.0% | 12.0% | 8.4% |
| UGI Corp | 3.8% | 7.5% | 11.3% | 7.9% |
| V.F. Corp | 3.6% | 13.0% | 16.6% | 11.6% |
| Merck | 3.2% | 10.5% | 13.7% | 9.6% |
| Qualcomm | 2.2% | 17.5% | 19.7% | 13.8% |
| Average | 5.4% | 7.9% | 13.3% | 9.3% |
(Source: DK Research Terminal)
Junk bonds yield 4.4% with 37% fundamental risk.
These 10 high-yield blue-chips yield 5.4% with 5.2% fundamental risk.
- 23% higher yield than junk bonds
- With 86% less fundamental risk
Analysts expect 7.9% long-term growth in earnings, cash flow, and dividends over time.
- More than 3x the long-term expected rate of inflation
| Investment Strategy | Yield | LT Consensus Growth | LT Consensus Total Return Potential | Long-Term Risk-Adjusted Expected Return | Long-Term Inflation And Risk-Adjusted Expected Returns | Years To Double Your Inflation & Risk-Adjusted Wealth |
10 Year Inflation And Risk-Adjusted Return |
| 10 High-Yield Rich Retirement Blue-Chips | 5.4% | 7.9% | 13.3% | 9.3% | 6.8% | 10.6 | 1.93 |
| Safe Midstream | 4.9% | 6.0% | 10.9% | 7.6% | 5.1% | 14.0 | 1.65 |
| Adam’s Planned Correction Buys | 4.0% | 18.9% | 22.9% | 16.0% | 13.5% | 5.3 | 3.56 |
| REITs | 2.8% | 6.5% | 9.3% | 6.5% | 4.0% | 17.9 | 1.48 |
| High-Yield | 2.8% | 11.3% | 14.1% | 9.9% | 7.4% | 9.8 | 2.04 |
| 10-Year US Treasury | 2.8% | 0.0% | 2.8% | 1.9% | -0.6% | -130.7 | 0.95 |
| 60/40 Retirement Portfolio | 2.1% | 5.1% | 7.2% | 5.1% | 2.6% | 27.9 | 1.29 |
(Source: DK Research Terminal)
This is one of the best high-yield blue-chip portfolio retirees looking for strong growth and long-term wealth creation can own.
- Better return potential than virtually any high-yield strategy
- Better return potential than the S&P 500 (9.9%) and aristocrats (11.2%)
Inflation-Adjusted Consensus Return Potential: $1,000 Initial Investment
| Time Frame (Years) | 7.4% CAGR Inflation-Adjusted S&P Consensus | 8.6% Inflation-Adjusted Aristocrat Consensus | 10.8% CAGR Inflation-Adjusted 10 High-Yield Blue-Chip Consensus | Difference Between Inflation Adjusted 10 High-Yield Blue-Chip Consensus And S&P Consensus |
| 5 | $1,429.63 | $1,511.29 | $1,670.69 | $159.39 |
| 10 | $2,043.84 | $2,284.01 | $2,791.19 | $507.18 |
| 15 | $2,921.94 | $3,451.81 | $4,663.20 | $1,211.39 |
| 20 | $4,177.29 | $5,216.70 | $7,790.75 | $2,574.04 |
| 25 | $5,971.97 | $7,883.98 | $13,015.89 | $5,131.91 |
| 30 | $8,537.71 | $11,915.01 | $21,745.46 | $9,830.45 |
(Source: DK Research Terminal)
Analysts expect about 22x inflation-adjusted returns over the next 30 years.
| Time Frame (Years) | Ratio Aristocrats/S&P | Ratio Inflation-Adjusted 10 High-Yield Blue-Chip Consensus And S&P Consensus |
| 5 | 1.06 | 1.17 |
| 10 | 1.12 | 1.37 |
| 15 | 1.18 | 1.60 |
| 20 | 1.25 | 1.87 |
| 25 | 1.32 | 2.18 |
| 30 | 1.40 | 2.55 |
(Source: DK Research Terminal)
Which is potentially 2.6x better than the 1.4% yielding S&P 500.
What evidence is there that these 5.4% yielding blue-chips can actually deliver close to 13% long-term returns.
Historical Returns Since 2002 (Annual Rebalancing)
The future doesn’t repeat, but it often rhymes.” – Mark Twain
Past performance is no guarantee of future results, but studies show that blue-chips with relatively stable fundamentals over time offer predictable returns based on yield, growth, and valuation mean reversion.
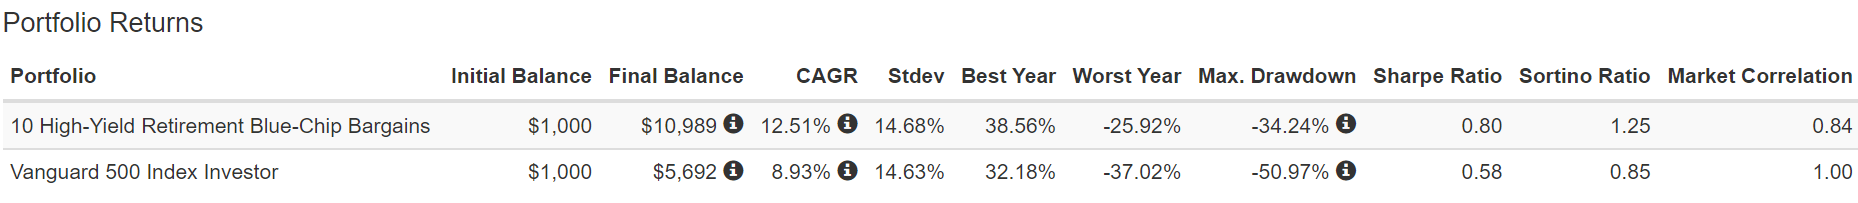
Bank of America 13.3% CAGR long-term returns are what analysts expect in the future, and 9.9% from the S&P 500. (Source: Portfolio Visualizer Premium) Over the last two decades, the S&P delivered 8.9% returns and these high-yield blue-chips 12.5%, with an equal amount of volatility over time… except during the Great Recession when they fell 15% less. Adjusted for inflation these high-yield blue-chips generated almost 7x returns over 20 years, double the 3.5x returns the S&P 500 delivered. The average rolling return, from 3 years to 15 years, is 13% to 14%. Smoother returns, better returns, and income that’s almost 4x better than the market. And speaking of income, take a look at this impressive dividend growth. (Source: Portfolio Visualizer Premium) 15.3% annual income growth for two decades, from a group of companies that were yielding a lot less in 2002, before they went on their market-crushing run. What about future income growth? Risk, Inflation, And Tax Adjusted Income Growth Consensus (Source: DK Research Terminal, FactSet) Analysts expect even better growth in the future, of 16% CAGR. Adjusting for the risk of these companies not growing as expected, taxes, and inflation, 7.2% long-term income growth is realistic.
Portfolio
2002
2021 Income Per $1,000 Investment
Annual Income Growth
Starting Yield
2021 Yield On Cost
10 High-Yield Retirement Blue-Chip Bargains
$35
$520
15.3%
3.5%
52.0%
Analyst Consensus Income Growth Forecast
Risk-Adjusted Expected Income Growth
Risk And Tax-Adjusted Expected Income Growth
16.2%
11.4%
9.7%
7.2%
Bottom Line: 10 High-Yield Retirement Blue-Chip Bargains You Won’t Want To Miss
Retiring rich and staying rich in retirement might seem impossible in a world where inflation is running at 8% and bond yields are still negative in real terms.
But this is where world-class high-yield blue-chips can make all the difference.
Today MMP, BASFY, BTI, MAIN, MPW, MMM, UGI, VFC, MRK, and QCOM represent a diversified portfolio with impeccable fundamentals that can help you potentially retire in safety and splendor.
- 5.4% very safe yield
- 7.9% long-term growth consensus
- 13.3% long-term return potential (similar to the average return over the last 20 years)
- 23% discount to fair value, 11.9x forward P/E
In fact, three low-cost ETFs can turn these 10 retirement dream blue-chips into a Zen Ultra SWAN retirement portfolio that can potentially help the typical retired couple
- Generate an extra $1.4 million in inflation-adjusted retirement income over 30 years compared to a 60/40 retirement portfolio
- Deliver $4.2 million more inflation-adjusted wealth over 30 years than a 60/40 retirement portfolio
- Turn $555,000 in median retirement savings into $6.4 million inflation-adjusted wealth after 30 years more than a 60/40 retirement portfolio
- The recession optimized version of this portfolio fell just 17% during the Great Recession, 50% less than a 60/40 portfolio and 64% less than the S&P 500
My goal isn’t to just give you reasonable and prudent high-yield recommendations.
I don’t just want to teach you how to become a better stock picker.
I want to teach you how to become a better long-term investor, mastering every aspect of what it takes to make your financial dreams come true.
- Quality and safety
- Yield
- Growth
- Valuation
- Prudent asset allocation and portfolio risk-management
- The discipline to avoid panicking during inevitable market downturns so you stick to your plan and retire rich and get steadily richer in retirement
In other words, I want to turn you into a stock market genius. That’s actually not that hard, because to paraphrase Napoleon, a stock market genius is simply
The person who can do the average thing when everyone else around him/her is losing their mind.”
Today we face soaring prices, rocketing interest rates, a slowing economy, and a lot of war uncertainty.
Oh, and lest you forget, China is still facing record COVID cases, and locking down its largest cities in a probably fruitless effort to maintain its COVID Zero policy.
(Source: Portfolio Visualizer Premium)
This means potentially slower global growth, as well as prolonged supply chain disruptions, and higher inflation for longer.
In the face of all this risk, the solution is clear.
DO NOT try to time the market.
Timing the market is a great way to churn your portfolio to death.” – Joshua Brown, CEO Ritholtz Wealth Management
DO focus on the fundamentals, meaning safety and quality first, prudent valuation, and sound risk-management always.
This is how you stop praying for luck on Wall Street and start making your own.
This is how you take charge of your financial destiny and maximize the chances of not just retiring in comfort and dignity, but safety and splendor.
Be the first to comment