

hynci/iStock via Getty Images
This article was originally published to members of the CEF/ETF Income Laboratory on October 1st, 2022. The markets have been highly volatile; please check the latest data before making any investing decisions.
September certainly lived up to its reputation of being one of the worst months for investing. I took advantage of that by doing a heavy amount of investing.
While I was doing quite a bit of buying, I also took the opportunity to reposition my portfolio just a bit. I had sold two positions in the blast month. That was Blackstone/GSO Strategic Credit Fund (BGB) and Voya Global Equity Dividend & Premium Opportunity Fund (IGD). This capital was invested directly into similar funds.
One other topic I wanted to touch on is investors being too nervous about investing at this time. The obvious reason is that the Fed is still raising rates, and the future is completely unpredictable. I mention every month that I buy, regardless of the current situation. I buy even more aggressively when we are in a bear market. In fact, at this time, the only reason I have cash in my account is that it was the end of the month – and that means a big payday from the bulk of my closed-end fund holdings.
I mention this because I’ve read many times that I should be saving my money for when the market drops even further. It very well could drop further. However, I have money that continues to flow in every month via dividends and distributions. Additionally, I still have outside sources of income generation too.
I have mentioned this several times before, but I’m very fortunate to get new readers every day. Therefore, it’s worth mentioning that I am still in the accumulation phase of my life. I understand that it is different for retirees and those on fixed incomes. Their savings and investments don’t have quite the same flexibility. I hope in highlighting what I’m buying every month it helps provide some ideas for others, but what might be right for one person’s situation won’t necessarily be right for another.
With covering so many funds in this update, I’ll be skimming through my reasoning. Sticking to primarily the main points of the reasoning behind buying the fund so this article doesn’t become too long. These are also all funds I’ve covered at some point so that additional reading material can be found. For some of these, I’ve provided very recent updates.
With that all out of the way, here’s what I was buying in the last month to generate and compound my growing income.
Invesco Senior Income Trust (VVR) And BlackRock Floating Rate Income Strategies Fund (FRA)
I’m lumping these two positions together because they were bought for the same reason. When divesting my BGB position, I still wanted to maintain floating senior loan exposure. VVR and FRA have done about as good of a job as they could in the latest environment.
The primary reason for selling BGB was that higher rates should have positively impacted income from the funds. That had happened for VVR and FRA, but not for BGB. BGB had to work against its portfolio to reduce its income. I figured it was better to sell now and ask questions later.
In all, floating rate funds only really work in a rising or elevated rate environment. Even then, we can see that the credit risks have impacted the actual results – so they aren’t even “working” when they should. Though they have limited downside when compared to other stocks and bonds.
Below is a YTD comparison between these trio of funds, plus I’ve included S&P 500 SPDR (SPY), Vanguard Total Bond Market (BND) and iShares iBoxx $ High Yield Corporate (HYG) for context.
Ycharts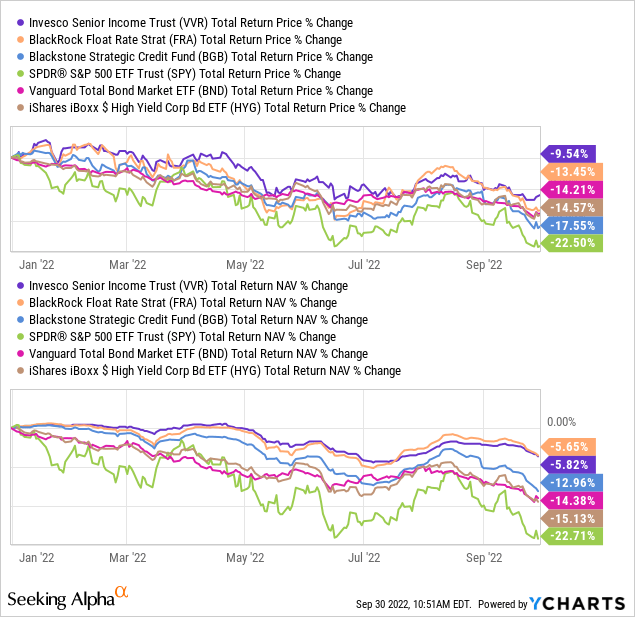
Cohen&Steers Tax Advantaged Preferred Securities & Income (PTA)
There isn’t much to say about PTA. It’s a preferred fund with exposure to fixed rates. They have a heavy weighting to fixed-to-floating, but that can take a year or two to start seeing the benefits. Rates are rising much too rapidly for the income generation in the portfolio to counteract.
Additionally, they aren’t earning their distribution, so overpayment is also playing a role in eroding NAV. What is perhaps more interesting is that the sister funds cut their distributions, but they’ve maintained PTA’s distribution.
All this being said, this fund’s at a deep discount, which I find appealing. When rates level off and stabilize, that should stabilize PTA.
Ycharts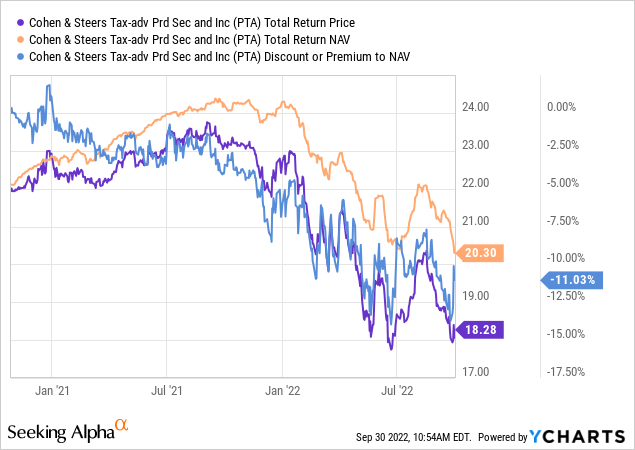
Cushing NextGen Infrastructure Income (SZC)
SZC has still generated losses for the year on a total share price return, and now even on a total NAV return basis, it has still held up relatively better than the overall market. That would be thanks to the energy and utility exposure.
Though stocks in the energy space are becoming a bit concerning, this is a diversified way to approach that space. If we enter into a real recession, energy remains vulnerable due to declining oil prices. I particularly like the fact that they have included more renewables exposure and can pivot even further in that direction over time. SZC continues to trade at an elevated discount, which I find compelling to continue to put cash to work.
Ycharts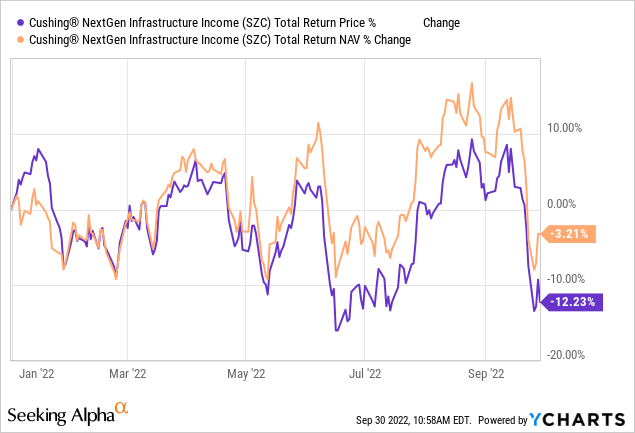
Eaton Vance Tax-Advantaged Dividend Income Fund (EVT)
This is just a solid way to gain broad and diversified equity exposure. Eaton Vance remains one of the most respected fund sponsors, in my opinion. It is a leveraged fund, but now that we are down at near bear market lows, the risks seem more limited.
The fund continues to flirt with a premium to its NAV, so it definitely isn’t a “value” play in that sense. However, the fund’s actual underlying portfolio tends to sway towards financials and healthcare. Energy and utilities are also amongst the top five sector allocations. So in that sense, it is a bit of a value-tilted portfolio.
Ycharts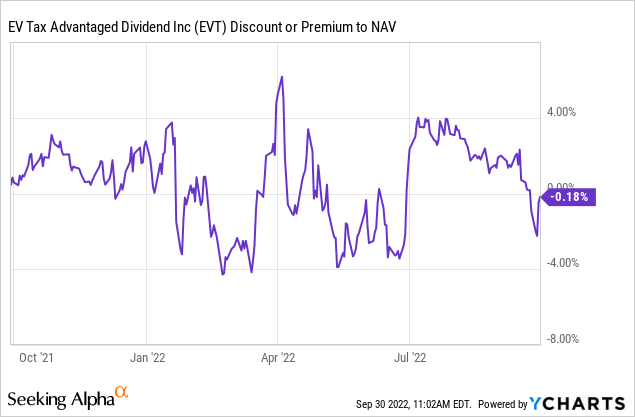
BlackRock Enhanced Equity Dividend (BDJ)
These next names were when I started buying more aggressively because it was when the market really began the latest plunge to finish off September.
BDJ is a name that I keep amongst one of the larger holdings. After adding capital elsewhere for several months, it was time to top BDJ back up. The fund isn’t leveraged and instead utilizes a covered call-writing strategy. They have a target of between 30 and 40% overwritten, but they can ultimately control how aggressive or not they are in terms of overwriting their portfolio. That can be seen as a benefit when things are rebounding. They can reduce their overwritten option exposure to let their portfolio participate more whenever a rebound happens.
The fund’s discount is narrower than its longer-running average but came down from its latest peaks.
Ycharts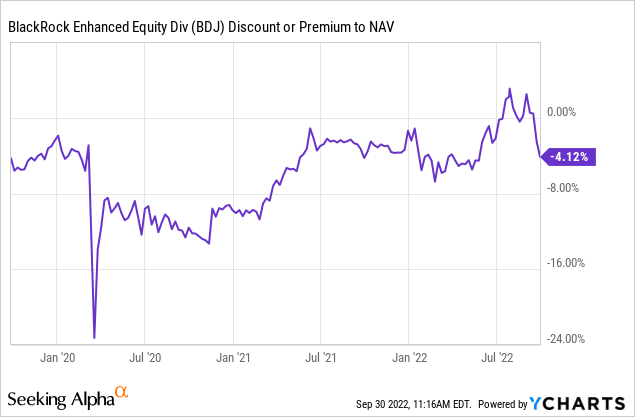
Cohen & Steers Quality Income Realty (RQI)
RQI was already my largest exposure when accounted for in two separate accounts. I had added this position as real estate continues to get hammered. The larger yield due to the collapse in the fund following the real estate’s brutal year of performance is a bonus. I still believe that the payout is sustainable. The valuation of the fund had also plummeted to an attractive level. The charts are beginning to look much like the 2020 crash but would need to go much lower.
Ycharts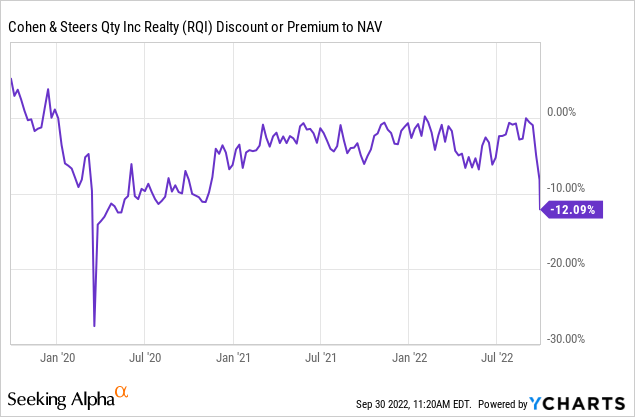
PIMCO Dynamic Income Opportunities (PDO)
While I was putting cash to work in places I found attractive, PDO continues to hit that mark, in my opinion. The coverage of the distribution, as reinforced by the distribution increase earlier this year, remains quite attractive. The valuation puts PDO as an attractive play relative to the rest of the PIMCO suite as well. Through July, the fund had even started to make an attempt towards parity with its NAV.
Ycharts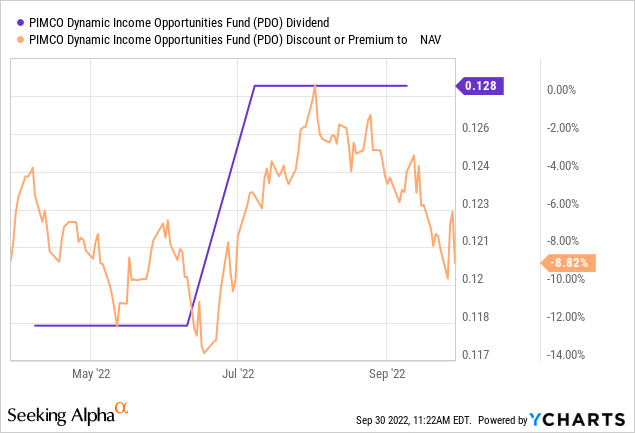
Voya Global Advantage & Premium Opportunity (IGA)
This is where the IGD capital went to work. These two funds are quite similar, with several overlapping top positions in their portfolio. One main difference is that IGD pays a monthly distribution, and IGA quarterly. A more frequent distribution is often seen as more compelling. However, in this case, the longer-term results have favored IGA.
Ycharts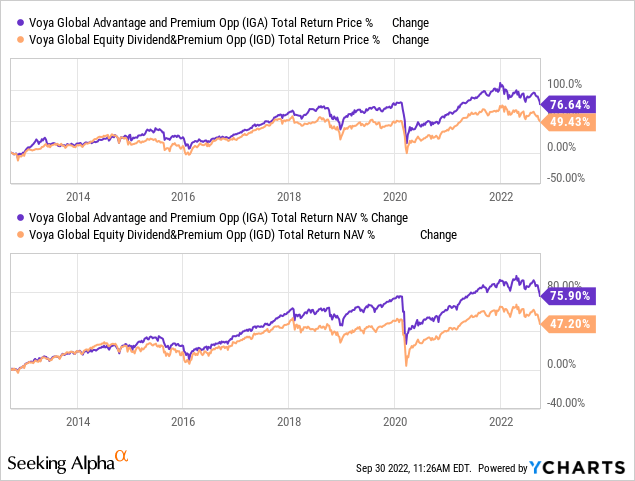
A more frequent distribution can result in lesser performance. The reason being is that the fund would have to raise cash and let things compound just a little bit less in the fund. However, there is something else clearly going on here due to the magnitude of the difference in performance. I wouldn’t believe that it would be simply due to monthly vs. quarterly distributions.
That being said, neither fund has had too envious of returns historically. This would have been the result of a value-oriented portfolio and global exposure. Relatively speaking, two areas that hadn’t worked out over most of the last decade. That has changed this year, though, with IGA outperforming the broader market as measured by SPY.
This was a swap I had wanted to do for a while, and I just finally pulled the trigger. The valuations were somewhat similar, but IGA was a slightly deeper discount at the time. So that just happened to work out as a bonus.
XAI Octagon Floating Rate & Alternative Income Term (XFLT)
To go along with more floating rate exposure, I increased my long-term position in XFLT. This fund utilizes a hybrid approach of investing in a sizeable sleeve of senior loans and collateralized loan obligations. CLOs are essentially just pooled senior loans and then sold in various tranches.
XFLT invests in both CLO equity and debt, which further adds to its diversification. Overall, the CLO funds have been hit hard over the year and even more so in the last month. This tends to be the case, but the NAV is perhaps less relevant in CLO funds than it is for others. Instead, the cash flows they can generate are where I’d be more focused.
Ycharts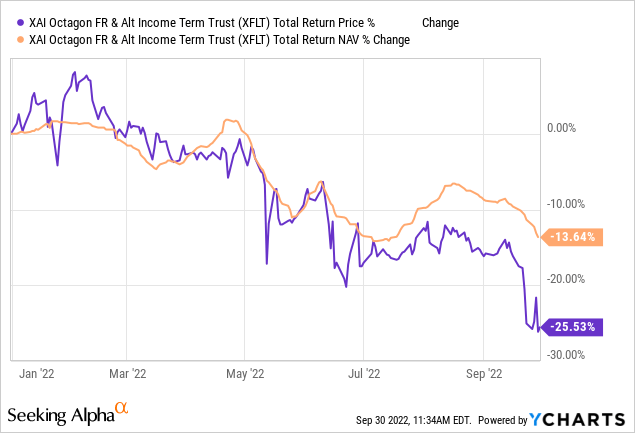
That being said, similar to what we see in the other more pure-play senior loan funds, is that the total NAV returns are holding up relatively better than the broader market. In this case, the CLO exposure is presumably causing the significant difference between XFLT and something like VVR and FRA.
This type of performance is also impacted as they are pretty highly leveraged in the CLO fund space. XFLT isn’t really an exception either, with the leverage ratio coming to 43.99%, according to CEFConnect. That would represent the credit facility and the preferred (XFLT.PA) that they have outstanding. All this uncertainty going forward has plunged XFLT to a discount, where it had been trading fairly regularly at a premium.
They’ve also recently celebrated their five years of being on the market. Unfortunately, it wasn’t under better circumstances in the overall market.
Destra Multi-Alternative (DMA)
Finally, I started an initial position in DMA. DMA is an unusual fund that I covered earlier this year, so for greater details on the basics of the fund, I’d consider reading through that. I concluded that article where I was basically on the fence. The deep discount (the largest discount on the market and remaining the largest CEF on the market still) was certainly enticing. They are invested heavily in private investments, so there is a bunch of uncertainty due to being illiquid.
However, being able to get a better understanding of the fund more recently shifted me into taking this initial starter position. I was able to share questions and the responses of Jake Schultz of Destra Capital recently. The discount certainly helped motivate the move too. While the portfolio is highly illiquid, I couldn’t really believe that the fund would be pushed to a near 40% discount. They can be a lot wrong and still be higher than where the market is valuing the fund.
Ycharts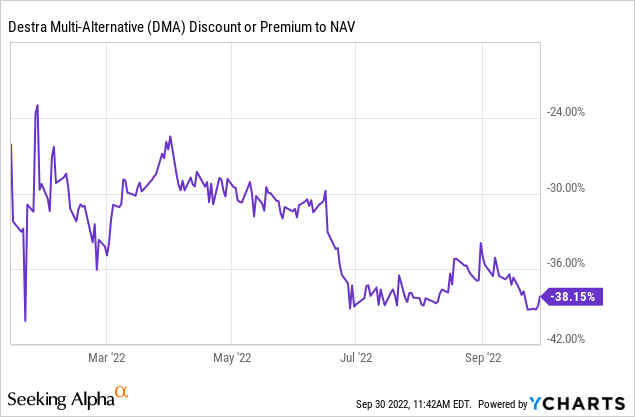
Another thing that helped nudge me toward taking a position is the relative performance compared to the market.
Ycharts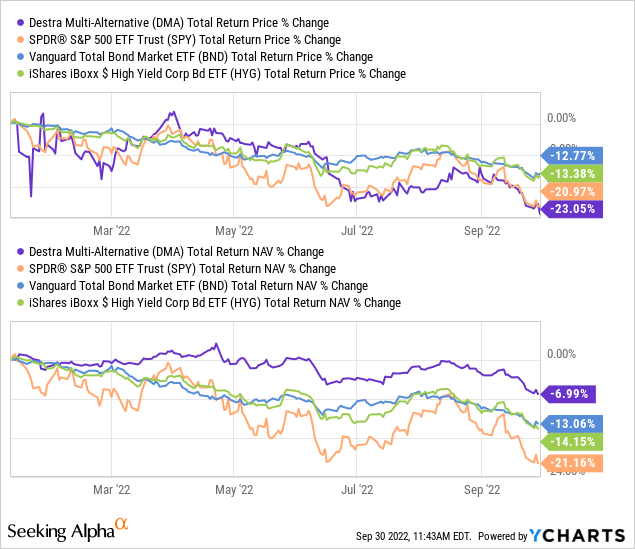
The total share price return reflects the fund’s discount going even wider than it was previously. However, that’s where the total NAV return actually reflects the underlying portfolio performance. In that case, we see the fund held up much better.
Of course, we once again go back to the problem with illiquid securities; the question of valuation accuracy can come up. An investment is only worth what someone is willing to pay for it. In this case, again, they can be a lot wrong and still result in better or comparable performance to the rest of the market areas as measured by these ETFs.
Be the first to comment