

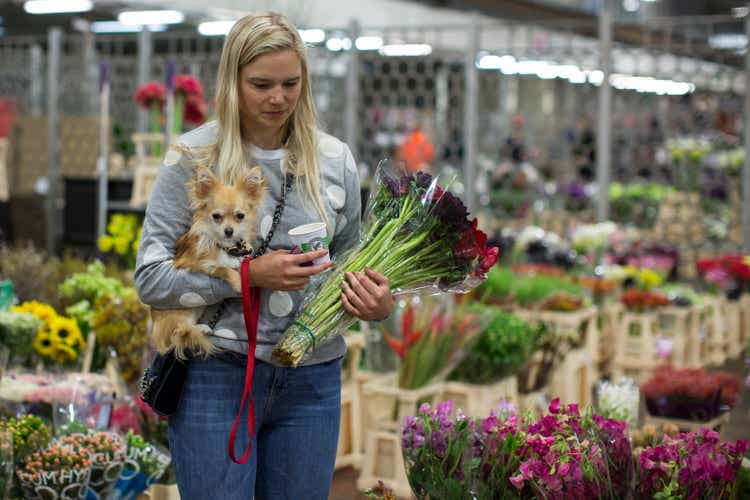
Dan Kitwood/Getty Images News
As the market leader of the gourmet food and floral gifts market, we analyzed 1-800-FLOWERS.COM, Inc. (NASDAQ:FLWS) as its revenue growth surged in 2021 to 42.5% and its capex increased to 14.5% as a % of revenue due to its acquisitions. From its latest earnings briefing, management explained that the company could continue to focus on M&A. Hence, we analyzed the company to determine if it has the capability to pursue M&A to sustain its growth.
So I think we’re a strong company and we will continue to come at it as stronger and better than we have, just like we have in the past. And M&A will be part of that equation for sure. – Christopher G. McCann, Chief Executive Officer
Revenue Growth
|
1800 Flowers ($ mln) |
2012 |
2013 |
2014 |
2015 |
2016 |
2017 |
2018 |
2019 |
2020 |
2021 |
|
M&A Revenue |
21.62 |
2.5 |
2.3 |
236.5 |
0 |
0 |
0 |
0 |
38 |
314.79 |
|
M&A revenue growth contribution |
9% |
11% |
65% |
0% |
0% |
0% |
0% |
16% |
50% |
|
|
Increase in non-M&A revenue |
26 |
19 |
129 |
52 |
21 |
-42 |
97 |
203 |
318 |
|
|
Non-M&A revenue growth contribution |
91% |
89% |
35% |
100% |
100% |
100% |
100% |
84% |
50% |
|
|
Total Revenue |
708 |
736 |
756 |
1,122 |
1,173 |
1,194 |
1,152 |
1,249 |
1,490 |
2,122 |
|
Total Revenue Growth % |
7% |
4.0% |
2.8% |
48.3% |
4.6% |
1.8% |
-3.5% |
8.4% |
19.3% |
42.5% |
Source: 1800 Flowers, D&B, Zippia, Datanyze, Khaveen Investments
The company’s average 10-year revenue growth was 13.51%. The company had made a series of acquisitions in the past 10 years with an estimated average M&A revenue growth contribution of 16.7%. However, the company had not made any acquisitions between 2016 and 2020. Excluding these years, we estimated its average M&A revenue growth contribution at 30% of the total revenue increase. In 2021, the company made its largest acquisition in the past 10 years with personalized products e-commerce site PersonalizationMall.com for a cost of $245 mln with an estimated revenue of $314.8 mln by D&B. Based on this, we estimated its M&A revenue growth contribution in FY2021 to be 50%.
Going forward, as explained by management in its latest earnings briefing, it expects future M&A activity. We projected its revenues based on the market forecast CAGR of 6.1% and its M&A revenues based on its 10-year average M&A revenue per cost ($1.8 mln) and average acquisition cost ($42 mln). Recently, the company acquired Vital Choice, a provider of premium seafood and organic foods, for $20 mln.
|
1800 Flowers |
2021 |
2022F |
2023F |
2024F |
2025F |
2026F |
|
M&A Revenue |
314.79 |
76.1 |
76.1 |
76.1 |
76.1 |
76.1 |
|
Revenue |
2,122 |
2,252 |
2,389 |
2,535 |
2,689 |
2,853 |
|
Total Revenue |
2,122 |
2,328 |
2,465 |
2,611 |
2,765 |
2,929 |
|
Total Revenue Growth % |
42.5% |
9.7% |
5.9% |
5.9% |
5.9% |
5.9% |
Source: 1800 Flowers, Khaveen Investments
Overall, we forecasted the company’s total revenue to grow at a 5-year average of 6.7% through 2026 including M&A revenues of $76.1 mln which is lower compared to its past 5-year growth rate of 13.7% driven by its acquisition of PersonalizationMall.com which boosted its revenue growth of 24.5% in 2021.
FCF Margins
|
FCF Margins |
2012 |
2013 |
2014 |
2015 |
2016 |
2017 |
2018 |
2019 |
2020 |
2021 |
|
Operating Cash Flow ($ mln) |
40 |
35 |
43 |
126 |
58 |
61 |
58 |
78 |
139 |
173 |
|
Capital Expenditure ($ mln) |
-13 |
-25 |
-32 |
-164 |
-34 |
78 |
-42 |
-33 |
-56 |
-308 |
|
Free Cash Flow Margin (%) |
3.72% |
1.34% |
1.42% |
-3.49% |
1.91% |
11.57% |
1.37% |
3.60% |
5.54% |
-6.40% |
Source: 1800 Flowers, Khaveen Investments
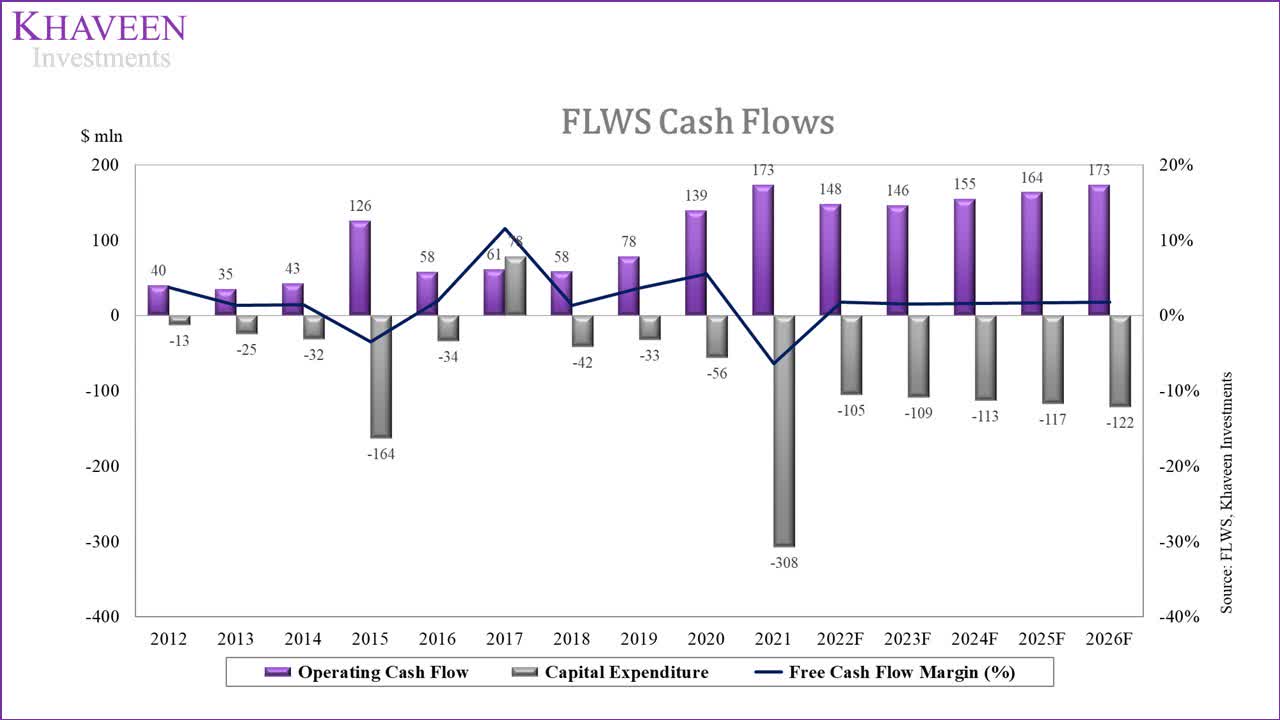
In the past 10 years, the company had a low average FCF margin of 2.06%. Excluding acquisitions, its average FCF margin is 4.8% which is still considerably low. Despite that, the company’s average capex as a % of revenue is only 2.8% as an e-commerce company with low capex requirements. However, its net margins are low with an average margin of 3.07% in the past 10 years.
|
1800 Flowers ($ mln) |
2020 |
2021 |
2022F |
2023F |
2024F |
2025F |
2026F |
|
Acquisition Costs |
-20.5 |
-250.9 |
-42.04 |
-42.04 |
-42.04 |
-42.04 |
-42.04 |
|
Capex |
-34.70 |
-55.20 |
-63.4 |
-67.2 |
-71.1 |
-75.3 |
-79.8 |
|
Total Capex |
-55.20 |
-306.10 |
-105.5 |
-109.2 |
-113.2 |
-117.4 |
-121.9 |
|
Capex as % of Revenue |
3.7% |
14.4% |
4.5% |
4.4% |
4.3% |
4.2% |
4.2% |
Source: 1800 Flowers, Khaveen Investments
Based on our projections of its M&A revenue, we assumed its acquisitions cost based on its 10-year average ($42 mln) in addition to its 10-year average capex excluding acquisitions of 2.8% to derive its capex as a % of revenue to forecast its FCF margins. Thus, we forecasted its average FCF margin through 2026 to be only 1.63% which we believe limits its ability to pursue large acquisitions through cash generation.
1800 Flowers, Khaveen Investments
All in all, except for 2015 and 2021 when it made large acquisitions which increased its capex, the company’s FCF margins have been positive but at a 10-year average of only 4.8% (excluding acquisitions). Beyond that, we forecasted its average FCF margin through 2026 to be only 1.63% after factoring in acquisitions which could limit its ability to pursue larger deals.
Leverage
|
Net Debt (Net Cash) ($ mln) |
2012 |
2013 |
2014 |
2015 |
2016 |
2017 |
2018 |
2019 |
2020 |
2021 |
|
Debt |
83 |
55 |
57 |
251 |
225 |
242 |
215 |
238 |
349 |
510 |
|
Cash & Cash Equivalents |
29 |
0 |
5 |
28 |
28 |
150 |
147 |
173 |
241 |
174 |
|
Net Debt (Net Cash) |
54 |
54 |
52 |
224 |
197 |
93 |
67 |
65 |
109 |
337 |
|
Cash to Debt Ratio |
0.3x |
0.0x |
0.1x |
0.1x |
0.1x |
0.6x |
0.7x |
0.7x |
0.7x |
0.3x |
Source: 1800 Flowers, Khaveen Investments
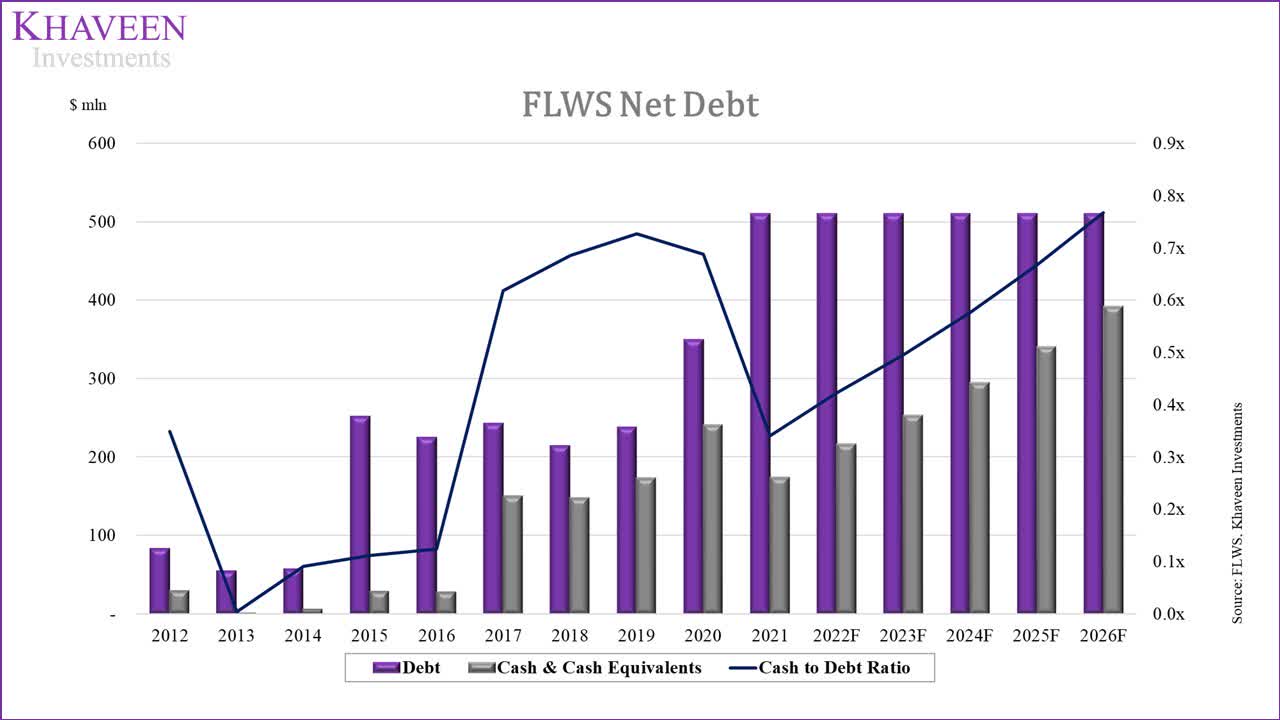
With the company’s largest acquisition of PersonalizationMall.com, its net debt had swelled in 2021 to $337 mln which is around 55% of its market cap as its debt increased by 46% and its cash balance decreased to fund the acquisition. Additionally, its cash to debt ratio had decreased to 0.3x in 2021 from 0.7x in 2020 but is still higher since 2016 as it built up cash during the period that it did make any acquisition.
|
Credit Analysis |
2012 |
2013 |
2014 |
2015 |
2016 |
2017 |
2018 |
2019 |
2020 |
2021 |
Average |
|
EBITDA interest coverage |
15.2x |
37.2x |
33.5x |
11.5x |
11.3x |
13.9x |
20.6x |
26.8x |
47.0x |
32.5x |
25.6x |
|
EBITDA/Net Debt |
0.7x |
0.8x |
0.8x |
0.3x |
0.4x |
0.9x |
1.1x |
1.2x |
1.0x |
0.6x |
0.7x |
Source: 1800 Flowers, Khaveen Investments
Based on the table above of its credit ratios, the company’s EBITDA interest coverage had increased in the past 5 years. Although it decreased in 2021, it remained above its 10-year average which indicates its ability to repay its debt obligations. Additionally, EBITDA/Net debt also improved in the past 5 years but decreased in 2021 below its 10-year average.
1800 Flowers, Khaveen Investments
Overall, based on our forecast of its net debt, we expect the company’s cash to debt ratio to increase through 2026 supported by its cash generation. However, we forecasted its cash to debt ratio to reach its previous level of 0.7x in 2020 only by 2025. Thus, we believe this highlights a risk of the company pursuing larger deals with its high leverage.
Risk: Acquisition Integration
The recent acquisition of Vital Choice highlights the company’s expansion into seafood, organic food and supplements. Compared to its previous acquisitions, we believe this deal is different as it expands into a new market and could pose a risk for it to integrate with its core business and derive synergies.
Verdict
While the company made its largest acquisition in 2021 which boosted its growth, we expect the company’s ability to pursue larger acquisitions to be limited by its low FCF margins at a 5-year forecast of 1.63% and high leverage with its net debt at 55% of its market cap. As a result, we expect its revenue growth to slow at a forecast of 6.7% on average versus its past 5-year average of 13.7%. As such, we referred to the low end of the average consensus price target of $9.25, which represents a downside of 7%.
Be the first to comment