

David Gyung/iStock via Getty Images
By Joseph Nelesen, Senior Director, Index Investment Strategy at S&P Dow Jones Indices
A clever (yet ill-fated) character once said, “Chaos is a ladder.” The first half of 2022 was indeed full of chaos in many major markets, including South Africa; our latest SPIVA South Africa Scorecard for the region shows where the rungs were slippery and where active funds were able to climb the fastest.
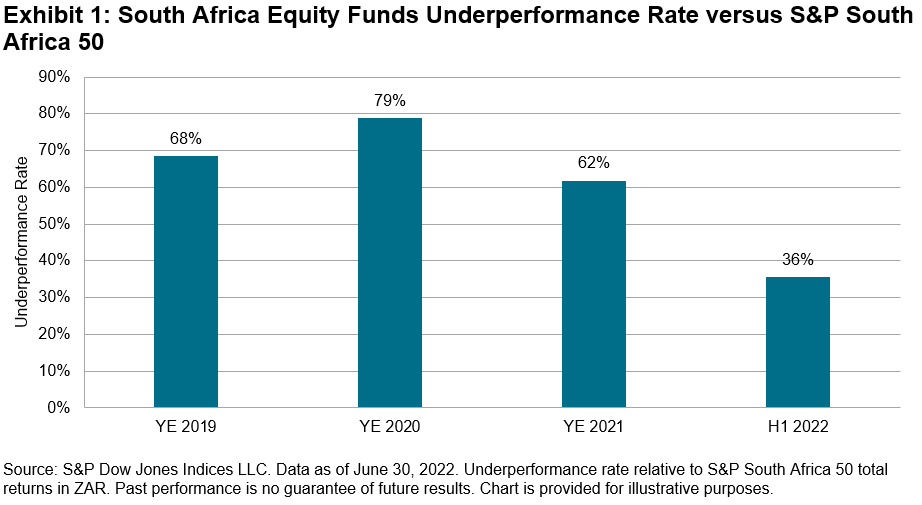
Overall, the underperformance rate of actively managed South Africa equity funds over H1 2022 was well below recent full-year measures (see Exhibit 1), with nearly two-thirds outperforming the S&P South Africa 50.
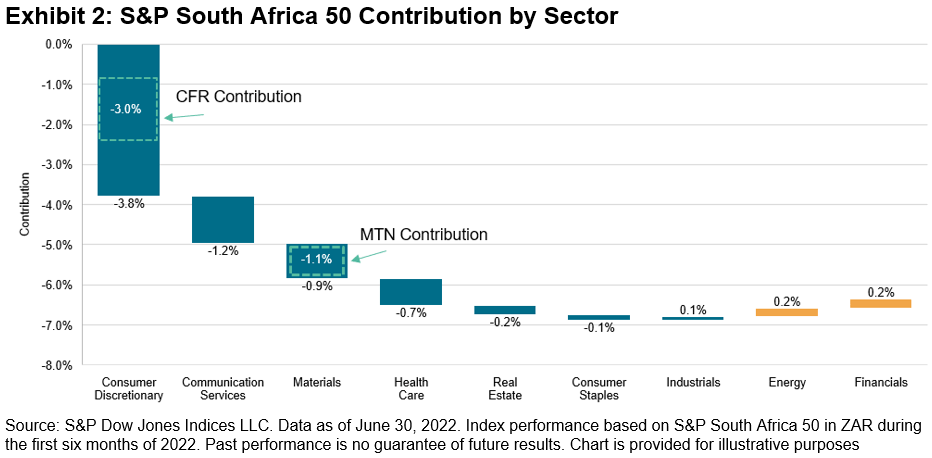
Avoiding a small number of underperforming stocks had the potential to make a big difference. Within the S&P South Africa 50, 49% of stocks trailed the benchmark and 51% outperformed, but just a few stocks contributed the majority of the index’s -6.3% H1 performance. Luxury goods firm Compagnie Financiere Richemont S.A (CFR) and communications company MTN Group Ltd. (MTN) combined to account for two-thirds of the total index decline. As the largest weight in the index, and the second-worst performer over H1, CFR made the most significant impact on the benchmark’s returns (see Exhibit 2).
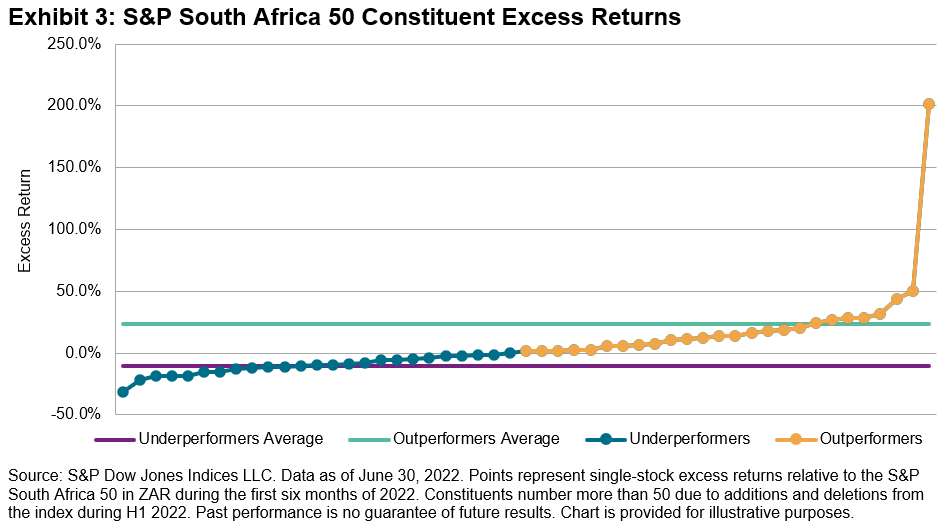
Returns were not distributed “normally,” creating an interesting challenge for stock pickers. The median S&P South Africa 50 stock return was -5.1% in H1, close to the index return, but the (unweighted) average stock return was 0.3%, due to the strong outperformance from a minority of large winners. Indeed, the outperformers averaged 23% excess return, while underperformers returned -11% on average. Even when excluding an outlier with more than 200% excess return during H1 (and a weight in the index of less than 1%), the average excess return of remaining outperformers was 16%. In other words: a manager’s chances of picking an underperforming or outperforming stock were nearly equal, but outperforming stocks were disproportionately rewarding to performance.
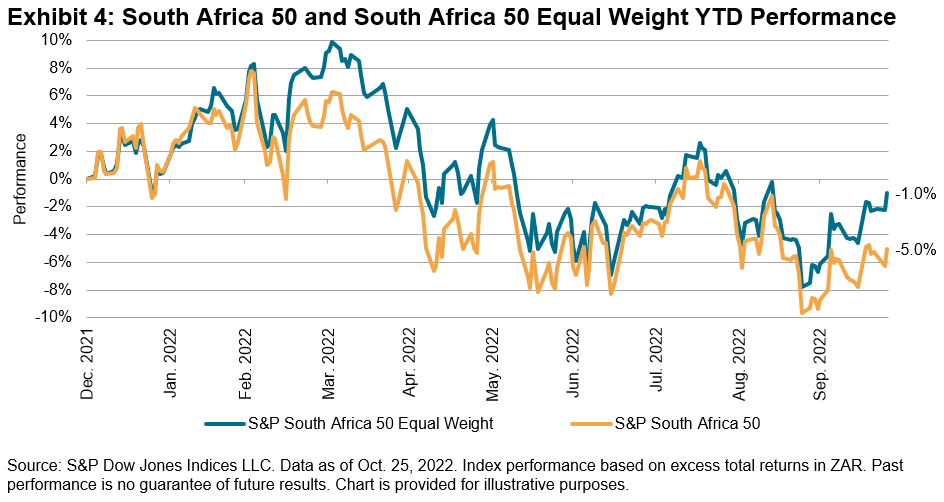
Based on the relative performance of the S&P South Africa 50 Equal Weight Index, tilting away from mega-cap names may have been one way for active managers to navigate a successful H1. The equal-weighted index outperformed the cap-weighted S&P South Africa 50 by 1.5% through H1, and in a perhaps positive sign for the full-year results, has continued to separate itself by an even wider margin since then (see Exhibit 4).
Reducing weights of the largest stocks in the benchmark remains a prevalent active management strategy, and one that may have benefited active managers in South Africa in the first half of 2022. So how did active managers do on a risk-adjusted basis? To find out, you’ll have to dive deeper into the SPIVA South Africa Mid-Year 2022 Scorecard. (Spoiler alert: some results are very different!)
Disclosure: Copyright © 2022 S&P Dow Jones Indices LLC, a division of S&P Global. All rights reserved. This material is reproduced with the prior written consent of S&P DJI. For more information on S&P DJI please visit S&P Dow Jones Indices. For full terms of use and disclosures please visit Terms of Use.
Editor’s Note: The summary bullets for this article were chosen by Seeking Alpha editors.
Be the first to comment