

sankai
Introduction
When recessionary fears abound, Amkor Technology (NASDAQ:AMKR) is a David Goggins in the stock market world. With robust annual sales growth of over 20% despite a slowdown in the semiconductors industry, Amkor Technology has every right to say “Can’t Hurt Me“.
I believe Amkor will continue to be an outperformer as its resilient portfolio benefits from increased outsourcing and vendor consolidation trends in tandem with its initiatives to engage in supply chain de-risking capex that would grant it an opportunity to gain further share.
My DCF valuation implies a 28% upside in the stock and my technical analysis also suggests bullishness, especially relative to the S&P 500 (SPY).
Business Brief
Semiconductor Industry Value Chain (Amkor Q3 FY22 Investor Presentation)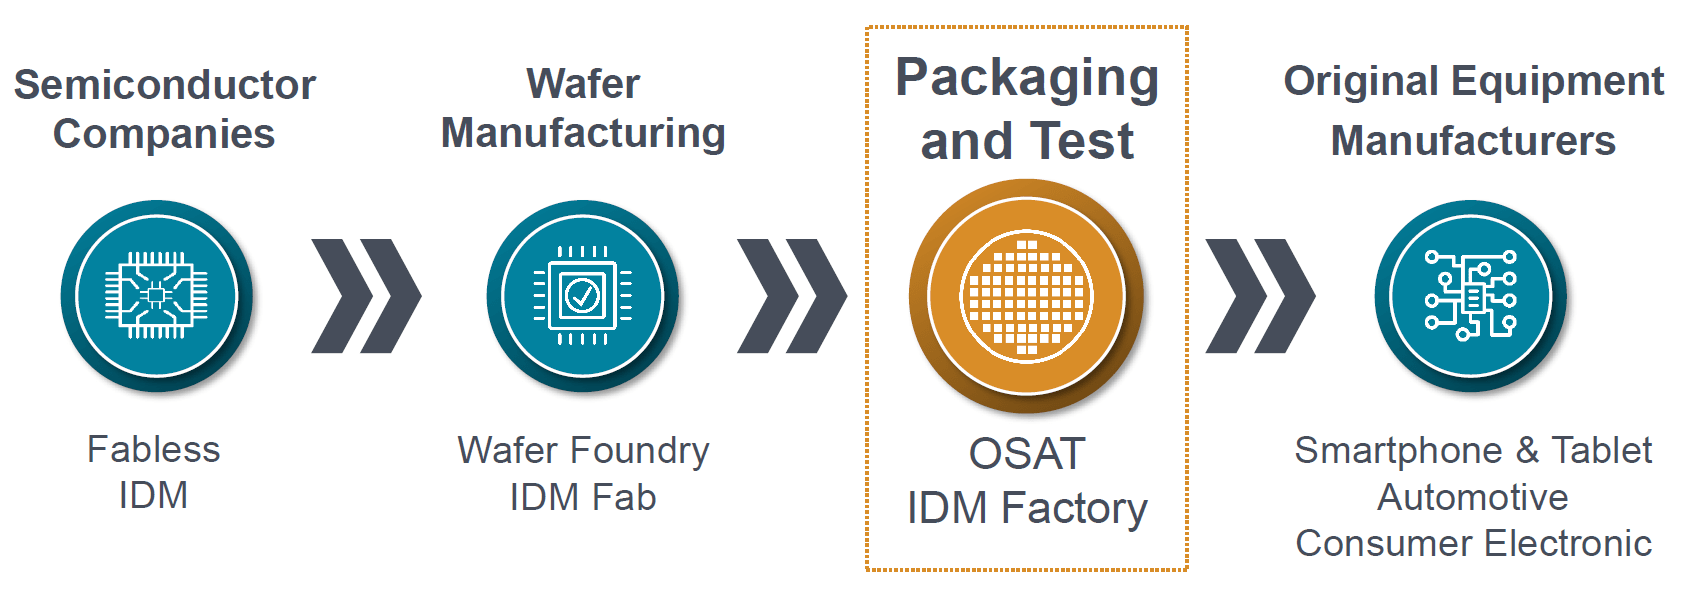
Amkor Technology is the second largest provider of outsourced semiconductor packaging and testing services (OSAT) after ASE Technology (ASX) with an estimated market share of 15%. In the industry value chain, OSAT players come in just before the OEMs, making this sector a late-cycle semiconductor play.
The vast majority of the top 10 OSAT companies have most of their operations in China or Taiwan. Amkor is the only developed market player in the list.
ASE Technology is the global market leader in OSAT with 53% higher OSAT related top-line. However, only 54% of its revenues are related to OSAT work with most of the remainder coming from electronic manufacturing services (EMS). Unlike ASE, Amkor is a pure-play OSAT player with no other significant lines of business.
Without getting into the technical details, one can think of the Amkor’s business products in 2 categories; a legacy part called Mainstream Products and a modern part called Advanced Products. Simply put, Advanced Products relate to packaging and testing services for more complicated chips, especially as it relates to smaller size and higher performance. Unsurprisingly, the Advanced Products mix has been growing over time:
Amkor Products Mix (Company Filings, Author’s Analysis)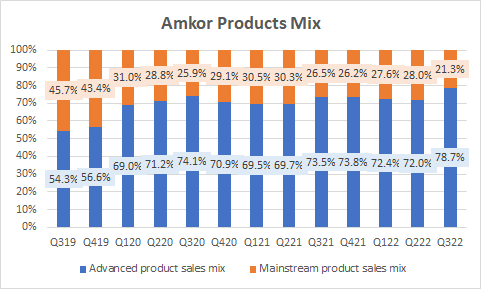
From an industry verticals perspective, Amkor is a leader in the automotive segment. This is how the broader split looks like:
Amkor Verticals Mix (Company Filings, Author’s Analysis)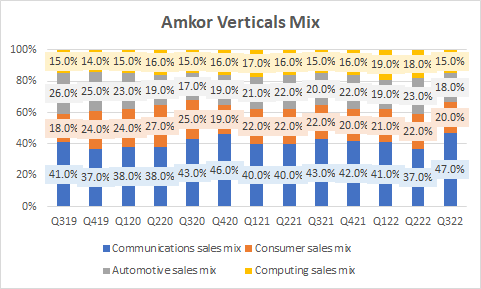
Customer concentration is a feature in this industry and Amkor is no exception. The top 10 customers make up 67% of the overall revenues mix:
Amkor Customers Mix (Company Filings, Author’s Analysis)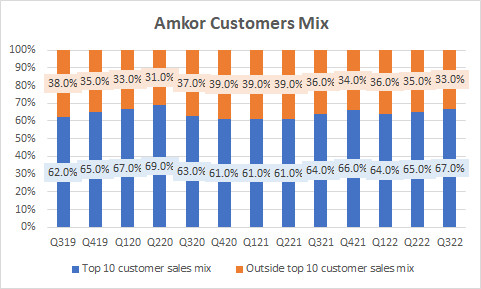
With more than 5 decades of experience in the industry, Amkor is well-positioned to benefit from continued industry consolidation and supply chain de-risking trends.
My Story for Amkor
My bullish story on Amkor is based on three key views I hold:
- Amkor will benefit from increased outsourcing of OSAT spends
- Amkor’s portfolio will be resilient amid industry slowdown
- Amkor will strengthen its market position as customers prioritize de-risking of supply chains
Let’s explore each view below:
Amkor will benefit from increased outsourcing of OSAT spends
A key driver of growth is increased outsourced spending by semiconductor foundries. Outsourced OSAT spending is rising as investments in new generations of semiconductor manufacturing technologies is increasing capex costs.
Industry R&D Cost History and Forecast (IC Insights)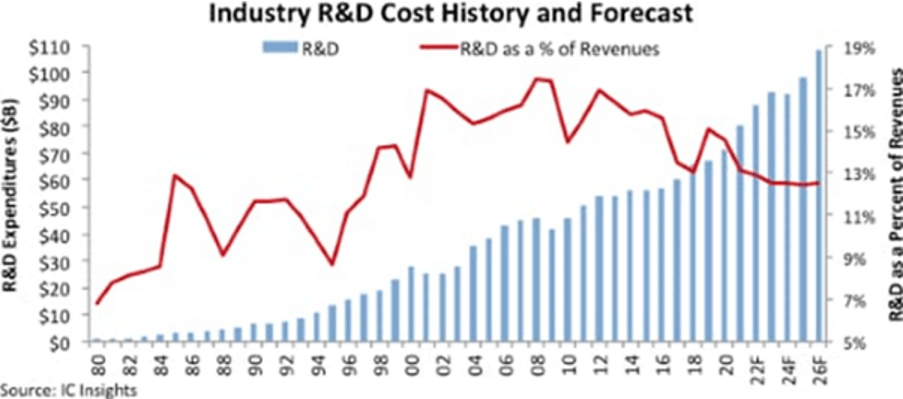
As a result, as can be seen in the chart above, the intensity of R&D spending is declining as semiconductor manufacturers focus on their core competencies and outsource functions such as OSAT to specialists.
In the company’s Q4 FY21 earnings call, Amkor CEO Giel Rutten remarked that OSAT outsourcing in advanced products is increasing even amongst integrated device manufacturers (IDM) (Intel (INTC), Samsung (OTCPK:SSNNF) (OTCPK:SSNLF) and Texas Instruments (TXN)) due to their lack of in-house capabilities:
… there is an increased outsourcing going on… It’s not only on the mainstream side. But it’s definitely also on the advanced products sides where generally IDMs… have limited scale in advanced products.
In terms of share in the pool of outsourced spends, I expect market leaders such as Amkor to gain further share as the industry consolidates. This would be driven by the increasing complexity and integration of work between the foundries and OSAT players. As noted in Amkor’s 10-K:
The traditional delineation between front end semiconductor manufacturing and packaging is starting to converge. Foundries, and in some cases IDMs, are integrating some packaging services closer to front end wafer processes.
Amkor, with its 50 years of experience has proven consistency and reliability, positioning it to benefit from these collaborative R&D trends with its customers. This in turn increases the barrier to entry for new entrants and barrier to scalability to smaller existing players. Overall, this gives strong revenue growth prospects for Amkor’s business.
Amkor’s portfolio will be resilient amid industry slowdown
Amid aggregate pockets of weakness in key industries, Amkor’s portfolio is positioned very resiliently, which makes it a strong contender for outperforming its peers and continuing to print positive surprises.
Management noted in a November 2022 Company Conference Presentation that in the communications market, whilst overall smartphone markets saw single-digit declines, the high-end premium tier smartphones saw continued growth driven by increased semiconductor content.
Amkor is a leading OSAT player in the automotive segment with over 40 years of experience. Across the semiconductor industry, there has been bullish commentary indicating resilient demand outlooks in this vertical. For example, CEO Kurt Sievers noted in NXP Semiconductors (NXPI) Q3 FY22 earnings call:
… we will continue to be sold out in the automotive market through next year.
CEO Thad Trent from ON Semiconductor Corporation (ON) remarked that:
We continue to see strong demand from our automotive end markets, driven by electrification and ADAS.
According to a November 2022 Company Conference Presentation, Amkor’s management revealed that they expect normalization of the automotive supply chains, fueling further growth.
In the same presentation, it was noted that whilst there is weakness and inventory buildup in the PC market, Amkor, which is more exposed to the network infrastructure and data center related applications, still saw strength in demand. Additionally, the IoT demand outlook was healthy, driven by launches of new products.
Overall, Amkor is consistently printing healthy YoY revenue growth of more than 20%:
Net sales YoY growth (Company Filings, Author’s Analysis)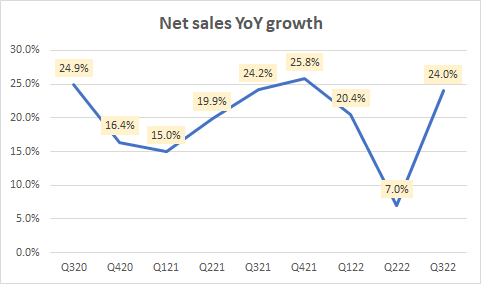
This is driven mostly by advanced products, which is on the cutting-edge of smaller, higher-performing chips. This part of the business is consistently clocking in more than 25% YoY growth:
Advanced products sales YoY growth (Company Filings, Author’s Analysis)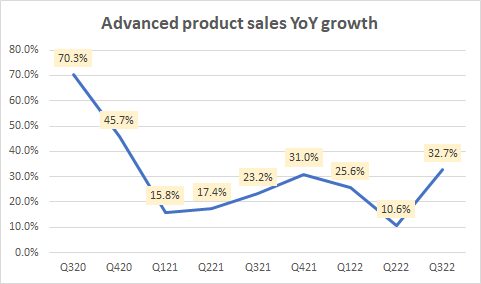
I believe this strong execution combined with the positive growth commentary places Amkor well, even during the current times of challenging macro.
Amkor will strengthen its market position as customers prioritize de-risking of supply chains
De-risking of supply chains away from China and Taiwan is another major trend occurring in the industry. Amkor’s CEO noted in the November analyst call that:
… a change in customer behavior relates to risk management… now, maybe 90% in China, they [customers] want to balance that to … 60-40 [China – RoW]… they look for alternatives outside China just to secure a diversified supply. Whether it’s in automotive or in other markets, OEMs want to have a diversified supply chain.
Amkor is expanding its manufacturing footprint into Vietnam in 2023 to provide customers a further de-risked supply chain. Along with the revenues benefit, Vietnam is an attractive location for expanding manufacturing footprint as it benefits from government support and cheaper labor costs. On average, Vietnam’s labor costs are less than half as much as China’s labor costs at US$2.99 per hour compared to US$6.50 per hour respectively.
Furthermore, the country’s labor productivity has been rising at a 10% CAGR driven by improvements in the mix of skilled labor. This makes the country more ready for the development of a semiconductor industry:
Vietnam labor productivity (Statista, Author’s Analysis)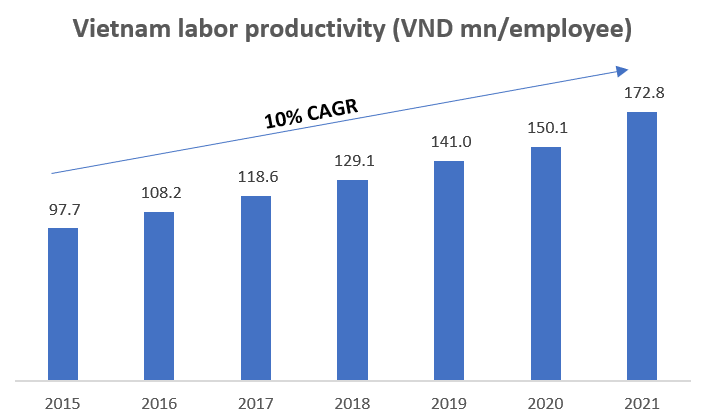
Overall, I anticipate these efforts to contribute to expansion in market share for Amkor.
Valuation
Given my narrative for the stock, these are my key assumptions for a simple DCF valuation for Amkor:
Total YoY revenue growth (Company Filings, Author’s Analysis)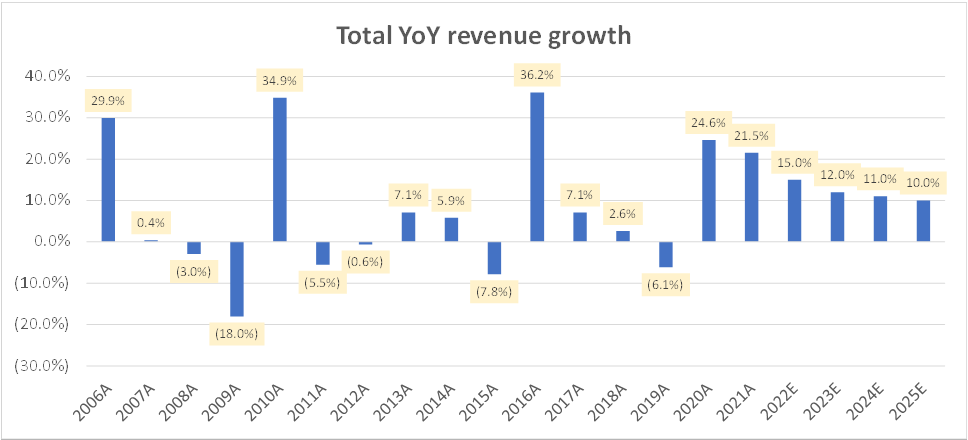
The 15% YoY revenue growth for FY22 revenue is based on what has already transpired in the first 3 quarters and $1.85 million, which is the mid-point of management’s guidance for Q4 FY22. After this, as I do not have a strong view on the semiconductor cycle, I have moderated revenues at through-cycle rates.
Gross profit margin (Company Filings, Author’s Analysis)
I anticipate some erosion in the gross profit margins as the mix of advanced products increases. This is because they carry a higher material cost.
EBITDA margin (Company Filings, Author’s Analysis)
The FY22 EBITDA margins assumption takes into account the print of the first 3 quarters and the mid-point of management’s PAT guidance of $172.5 million. After this, the steady drop is mainly due to the gross profit margins decline explained earlier.
Net operating working capital days (Company Filings, Author’s Analysis)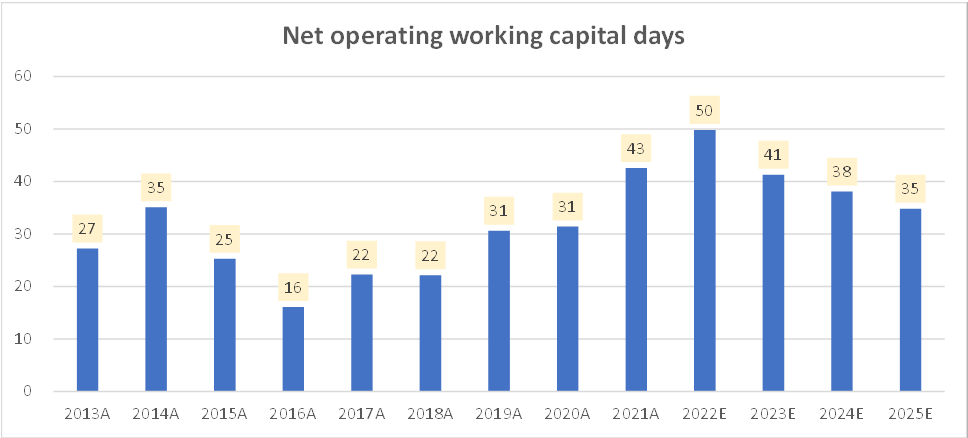
Inventory is higher than historical levels currently and I have forecasted a fall back to historical averages. This is the main contributor of the decline in net operating working capital.
Gross asset turns (Company Filings, Author’s Analysis)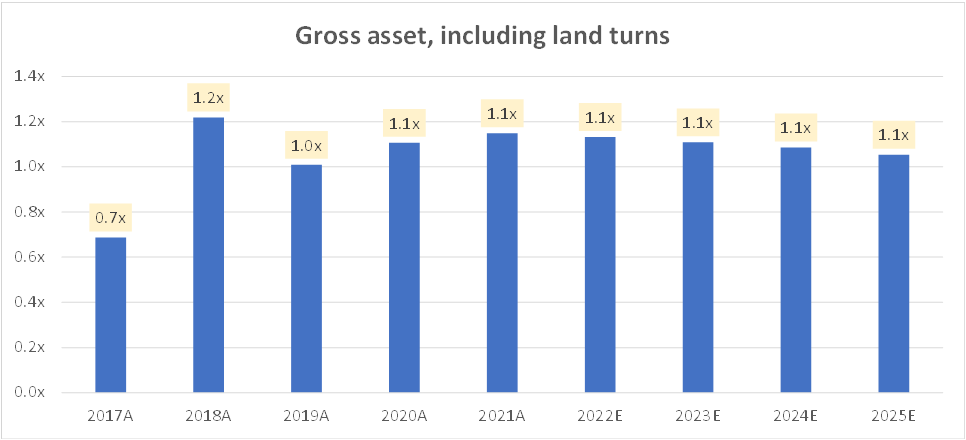
I don’t think there would be any structural changes to asset intensity. Hence, the asset turns are assumed to remain stable.
Post-tax ROIC (Company Filings, Author’s Analysis)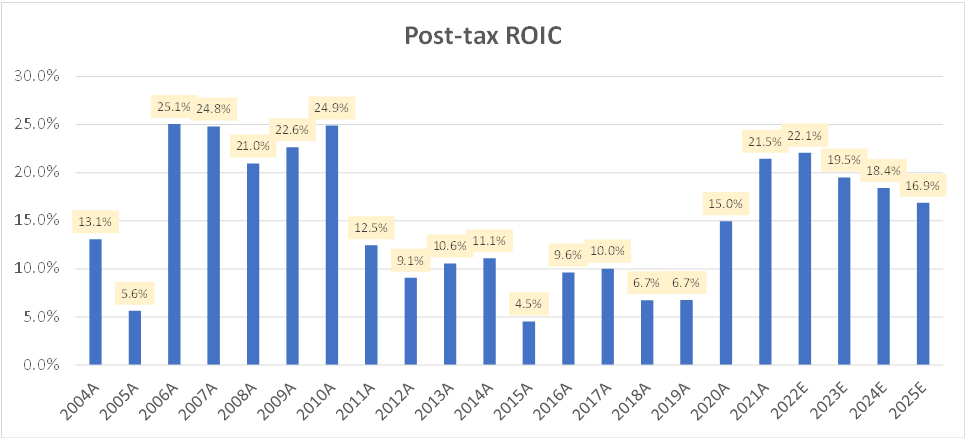
I expect post-tax ROICs to moderate to a through-cycle average level of around 17%.
Amkor Valuation Summary (Author’s Analysis)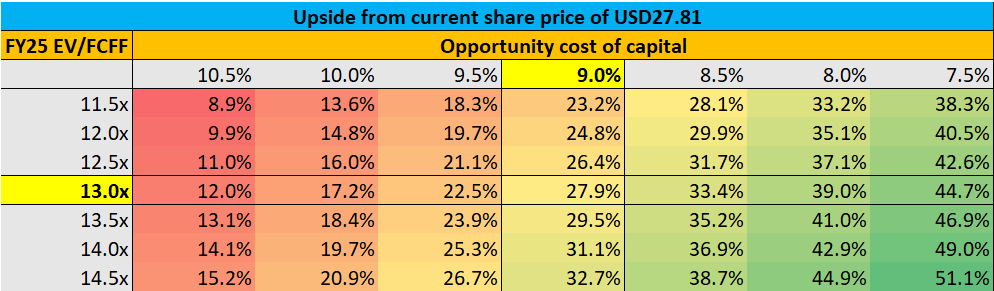
There are multiple ways to think about cost of capital estimation. It is one of the things in valuation that is very sensitive but for which accuracy is very difficult. My approach here is to assume a 9.0% cost of capital for Amkor. This is based on multiplying the U.S. cost of equity by 1.65, which is the beta of Amkor, and adding a 2% premium.
Note however, that by opting for a DCF with a terminal value assumption, the opportunity cost of capital assumption only applies to the operating forecast period of the valuation till 2024 and the discounting of the terminal value in 2025. And the operating forecast period’s value makes up only 14.9% of the total value in this instance.
The more sensitive assumption is the EV/FCFF multiple ascribed to the 2025 terminal year. Here, I have chosen a multiple of 13.0x. Given the terminal year operating assumptions shown in the charts above, and a terminal year tax rate of 27.0%, which is equal to the US corporate tax rate, this corresponds to a FY25 EV/EBITDA multiple of 4.5x. This is below the current EV/EBITDA of 4.95x and at a 13.9% premium to the 17-year long term average EV/EBITDA of 3.95x:
Amkor 1-yr forward EV/EBITDA timeseries (Capital IQ)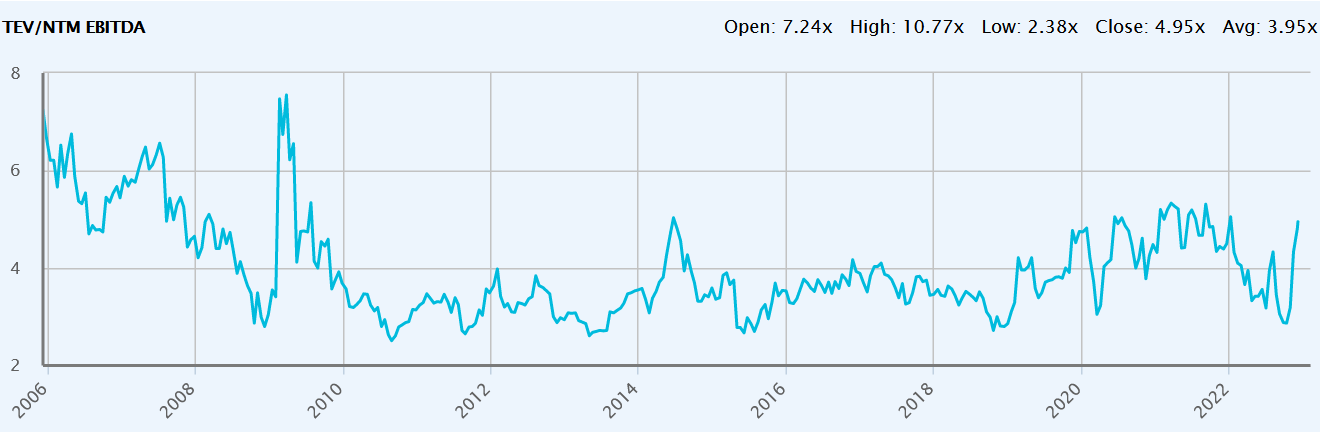
I believe a premium to long term averages is justified due to Amkor’s positioning improving from industry consolidation and de-risked supply chain.
Overall, with an opportunity cost of capital of 9.0% and FY25 EV/FCFF of 13.0x, I see a 27.9% upside in the stock, corresponding to an intrinsic value per share of $35.58.
Technical Analysis
Amkor Technical Analysis (TradingView, Author’s Analysis)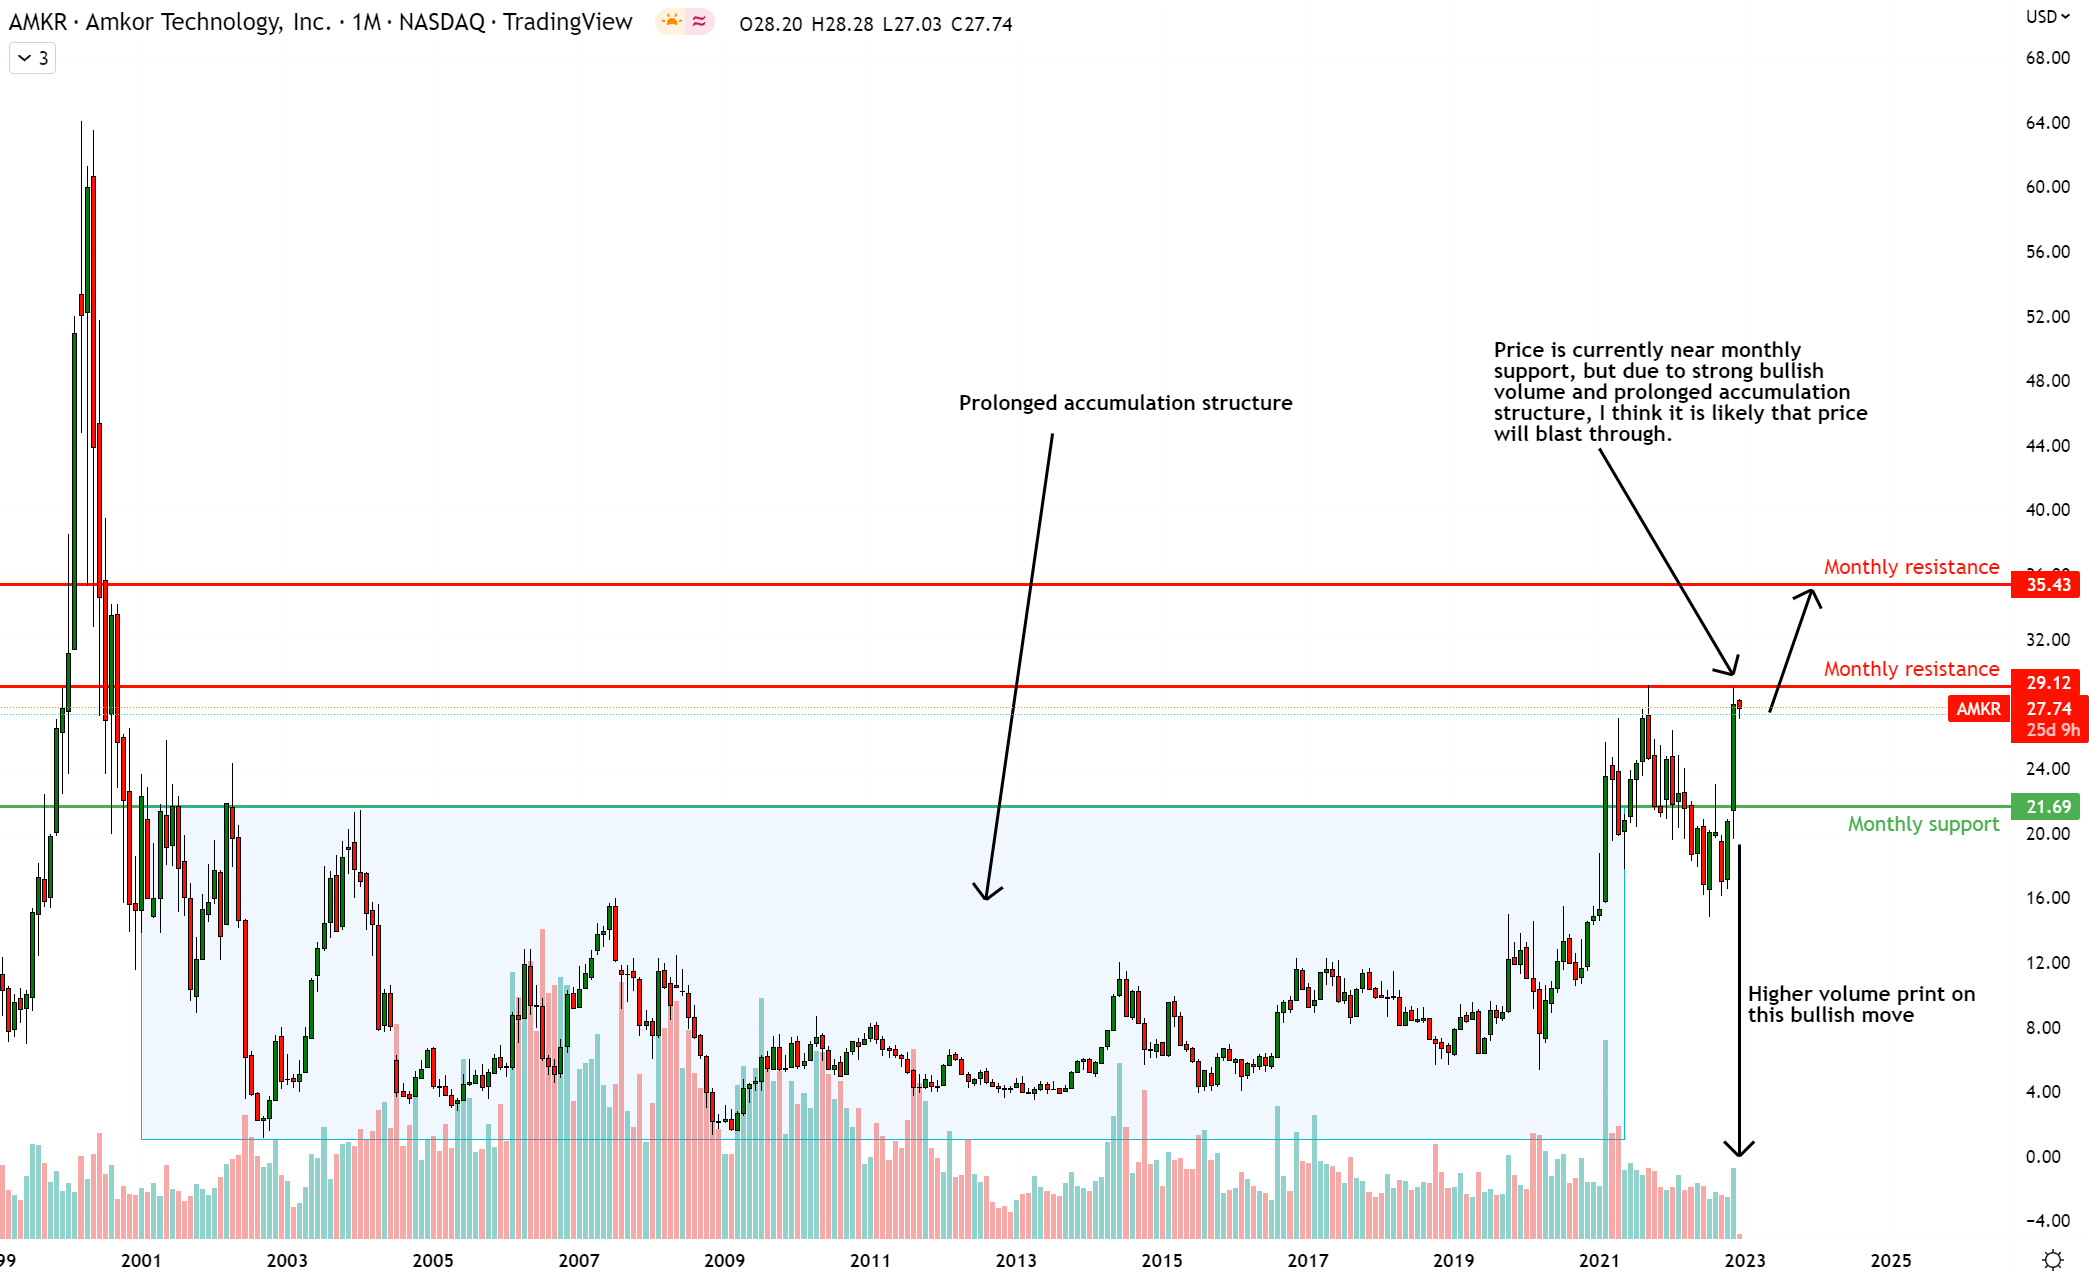
After a period of prolonged accumulation, AMKR is now making bullish moves with volume from the monthly support at $21.69. For this reason, I believe although price is currently near monthly resistance at $29.12, it will blast up towards the next monthly resistance level at $35.43.
Amkor vs S&P500 Technical Analysis (TradingView, Author’s Analysis)
The relative chart of AMKR vs SPY shares similar characteristics; bullish breakouts with volume after a prolonged accumulation period. Noteworthy, in the relative chart, price has already broken out of the near-term monthly resistances, leaving the coast clear for a bullish run up to the next monthly resistance zone.
Overall, both the absolute and relative charts suggest a bullish case for Amkor, with the confidence in relative chart bullishness a little higher.
Key Risks & Monitorables
The demand health of key verticals; communications, automotive, consumer electronics and computing are key monitorables as they determine the near term revenue growth outlook for Amkor. A recession will slow down demand and curb absolute stock performance of Amkor. However, on a relative basis, Amkor would still be positioned attractively.
Summary and Positioning
All in all, I believe Amkor is the quintessential ‘Can’t Hurt Me’ David Goggins type of stock. Its rock-solid portfolio is ready to benefit from market share gains from increased outsourcing of more complex OSAT work and de-risking of supply chains.
According to my analysis, both fundamental and technical analysis of Amkor point towards bullishness and relative out-performance over the S&P 500. The only minor concern in terms of positioning may be that the stock is close to a monthly resistance on the absolute chart, although I believe it is likely to blast through. For investors for which precise timing matters less, I believe Amkor is a buy today!
Be the first to comment