

DNY59
Introduction
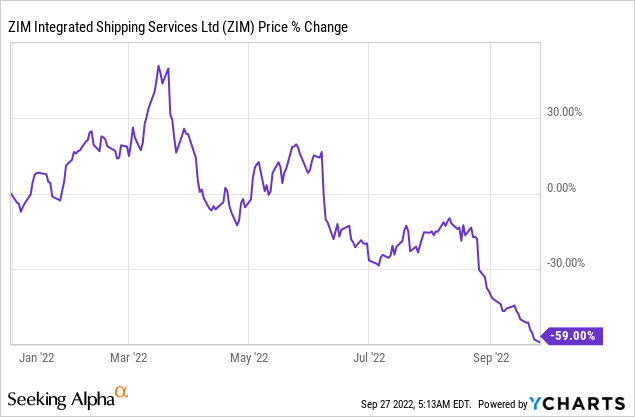
ZIM Integrated Shipping Services (NYSE:ZIM) has seen its shares fallen by more than 70% from all-time high with a massive dividend yield that would attract the attention of any typical bargain hunter. While the usual bull thesis for buying the stock at current levels would point to an extremely low valuation at 2x 2023 EPS and that all revenue and earnings headwinds have been sufficiently priced in, I believe any rally from here will likely be met with heavy selling pressure given a challenging macroeconomic outlook that guarantees nothing but trouble for the shipping business going forward.
First, a little history
ZIM is in a commodity-like industry and so its earnings are directly correlated to shipping rates and volume which are both highly sensitive economic cycles. Taking a brief look at history, we can easily conclude that the global shipping industry has never been able to escape the impact of an economic downturn. Between 2001 and 2006, the shipping industry experienced a massive boom. During this golden age, ports had record throughputs and freight rates skyrocketed. Companies were awash with cash on their balance sheets and banks would supply money at the lowest possible rates.
For example, the total container counts (TEUs or twenty-foot equivalent units) for the Port of Los Angeles were just over $5 million in 2001, but this number ballooned to roughly $8.5 million in 2006 when supply expanded far beyond demand. In a commodity-like industry where incumbents are price-takers rather than price-setters, things usually don’t look so good when every wants a piece of the action.
The Port of Los Angeles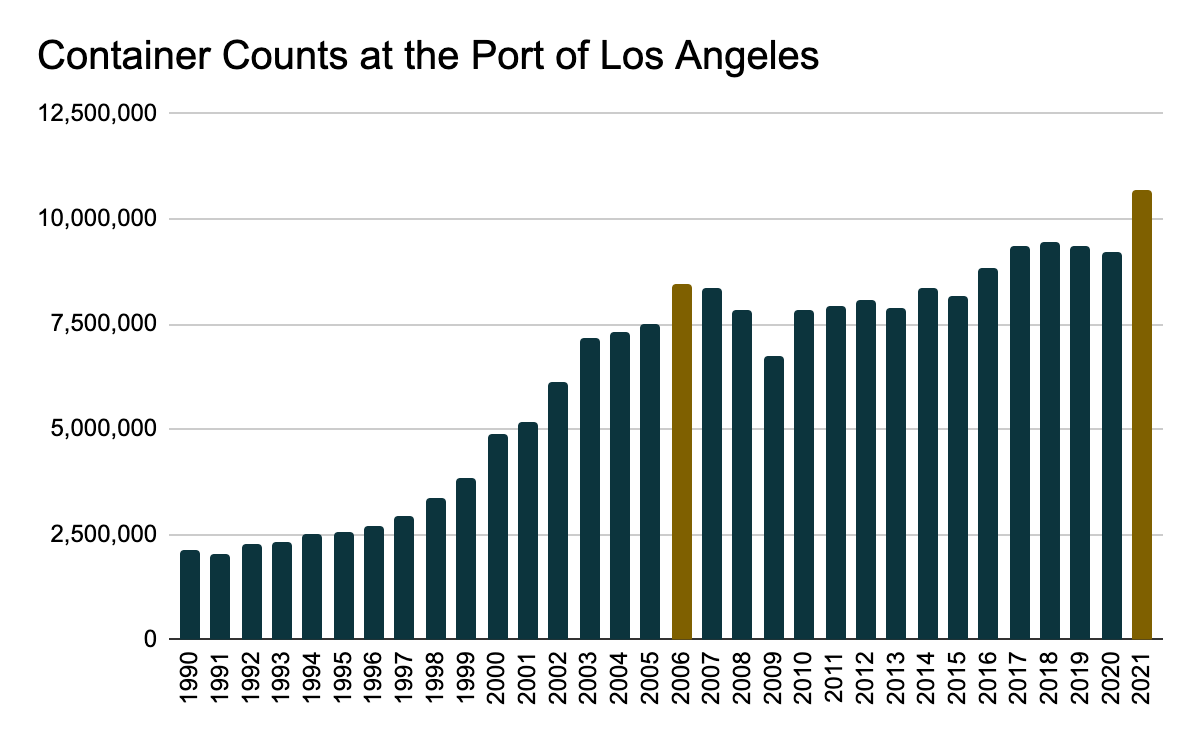
In 2006, the supply of container shipping first exceeded demand in terms of YoY growth at +13.6% vs. +11.2%. Although the delta improved in the following year, the industry was nowhere close to being prepared for the Global Financial Crisis. In 2008, demand growth essentially fell off a cliff and turned negative for the first time in many years at -9.7% in 2009, while supply lagged by a wide margin with an almost 15% delta.
UNCTAD Review of Maritime Transport 2009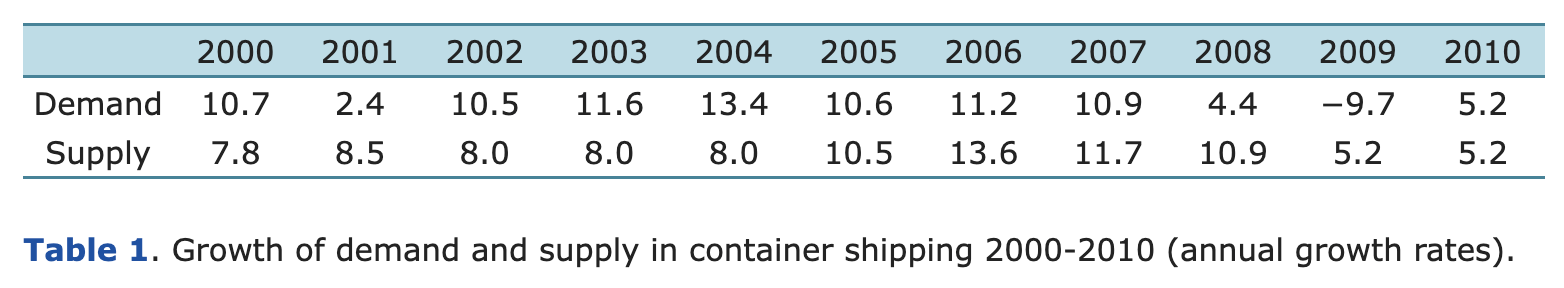
Naturally, freight prices took a turn for the worse and no company was spared during the global recession. The Baltic Dry Index, a popular measure of the cost of worldwide shipping, reached as high as 11,440 points in May 2008, only to crash down to 715 points in November. For a taste of what it felt like to be in the shipping business back then, here’s what Maersk said in their 2008 annual report.
With the present market situation it is not realistic to expect gains on sale of ships, rigs, etc. of any significance. – Maersk 2008 Annual Report
TradingView.com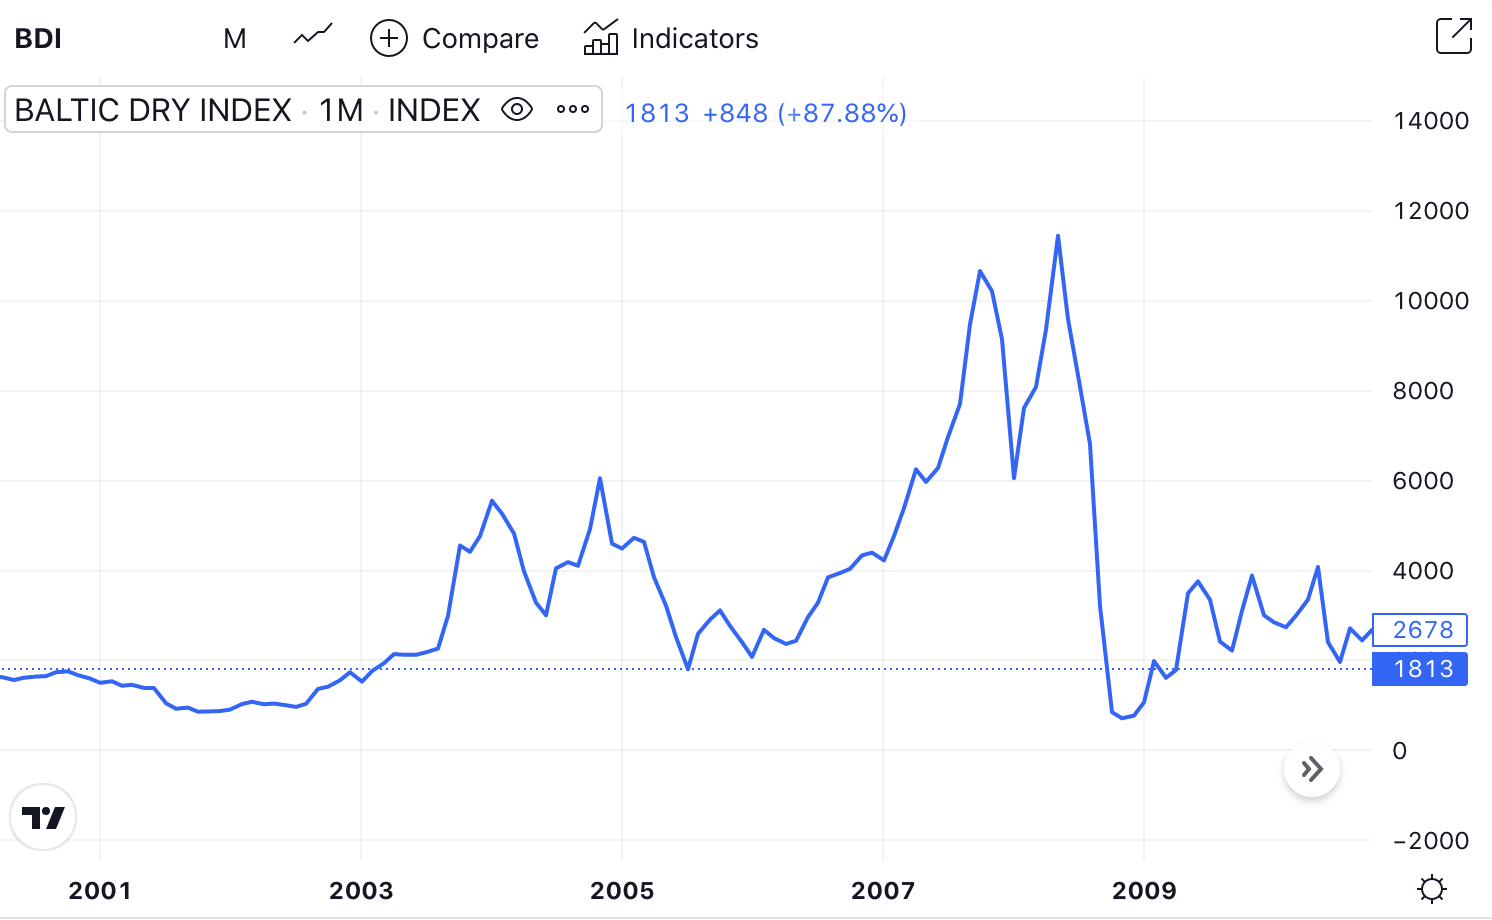
Now the reality in 2022
Now that we have a brief sense of the past boom and bust cycle, where do things stand in 2022 and what does 2023 look like? Well, let’s just say a year ago, it’d cost you more than $12,000 to ship one 40ft container from Shanghai to LA. Today, that number is down 70% to less than $3,800.
Spot freight rates by major route – Drewry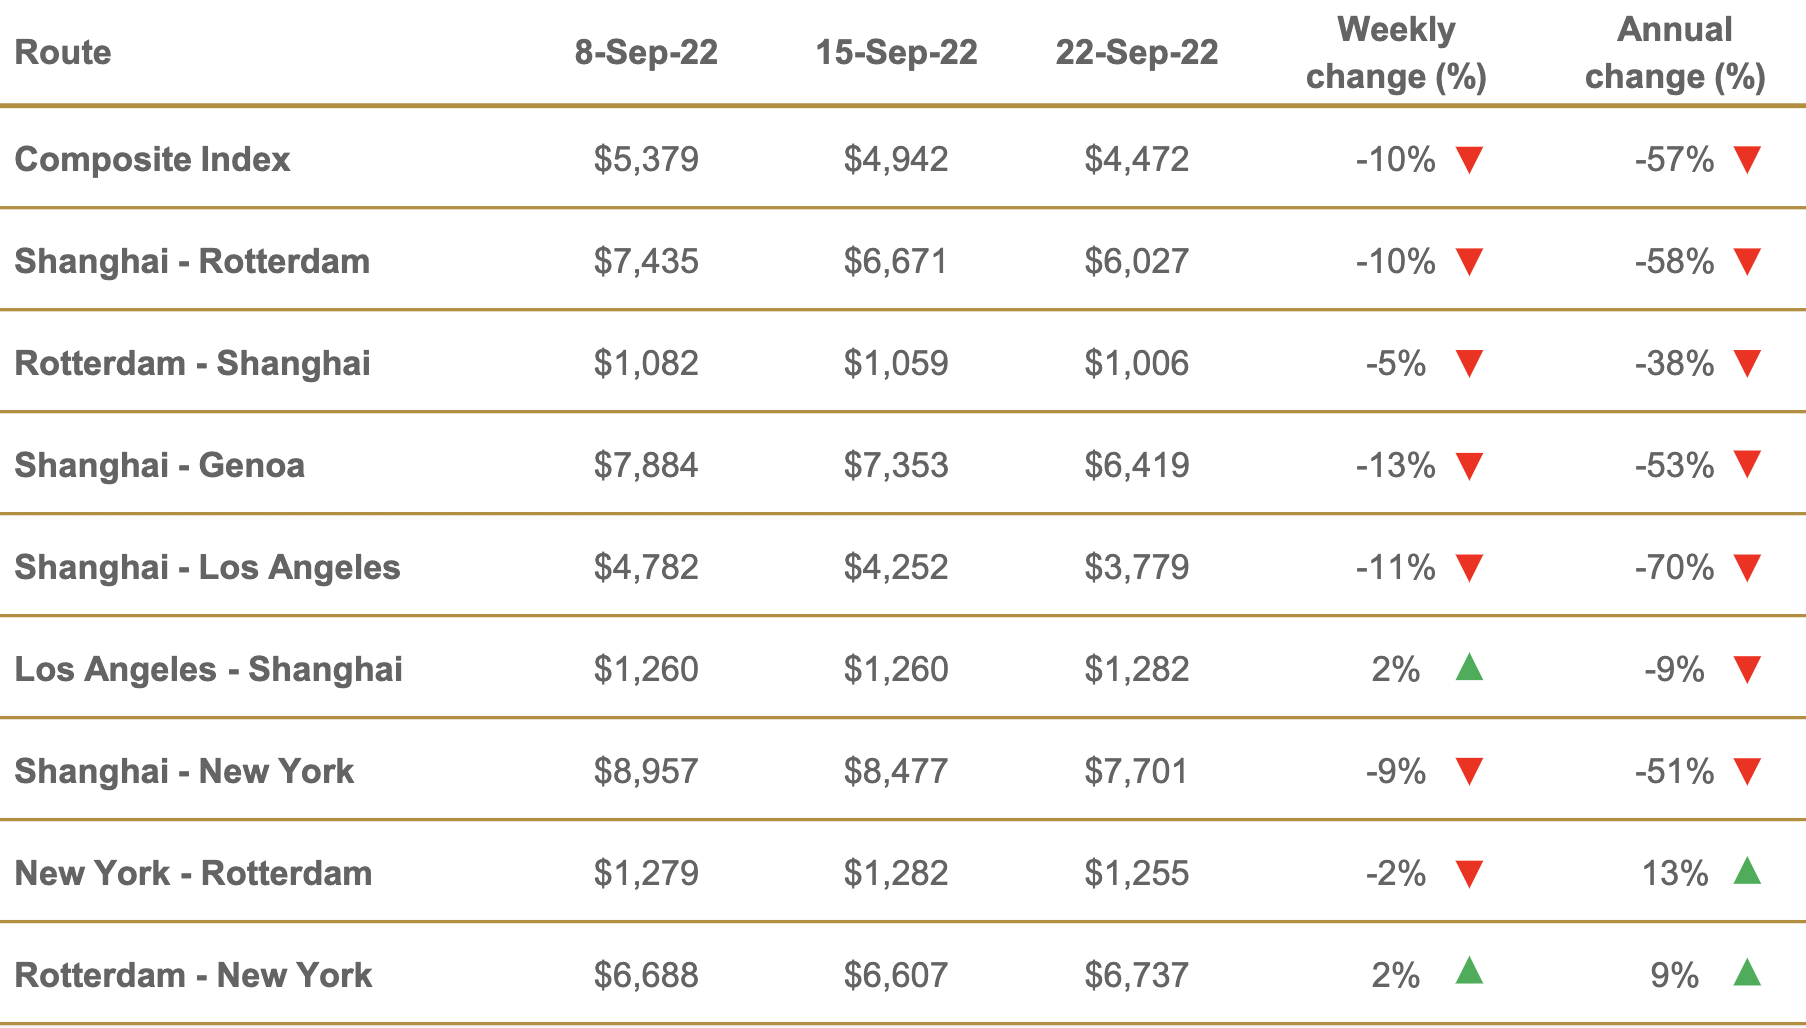
Coming back to our previous statistics from LA Port, 2021 saw record total TEUs of 10.7 million and things are beginning to look shaky as total TEUs were down 15.6% in August 2022. While one month doesn’t always make a trend, this is clearly not a good look on the supply-demand side of the story.
The Port of Los Angeles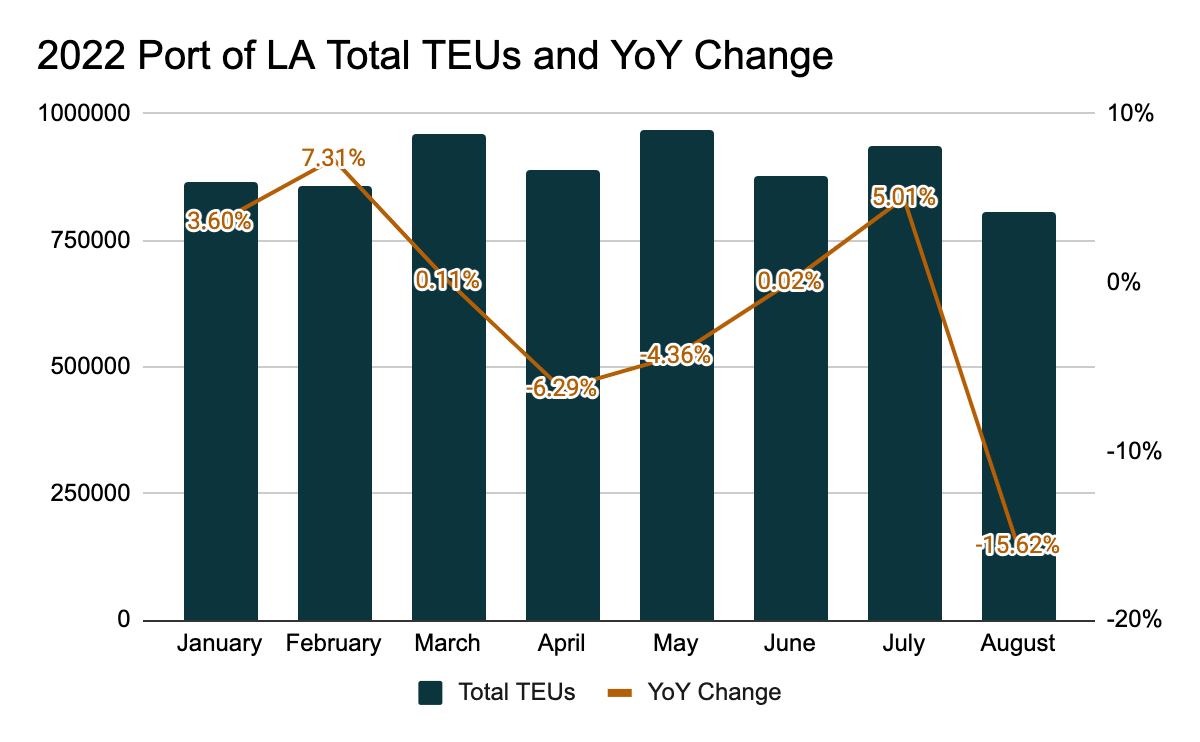
Looking at the global freight index, we can see that the market rate for shipping a 40ft container peaked at $11,000 in September 2021 and has recently reached $4,262 on September 23, 2022. Interestingly, ZIM’s stock did not reach its $90 peak until March this year, likely because the company delivered above-consensus quarterly results and the Russia-Ukraine crisis created speculation on higher commodity prices and shipping rates.
fbx.freightos.com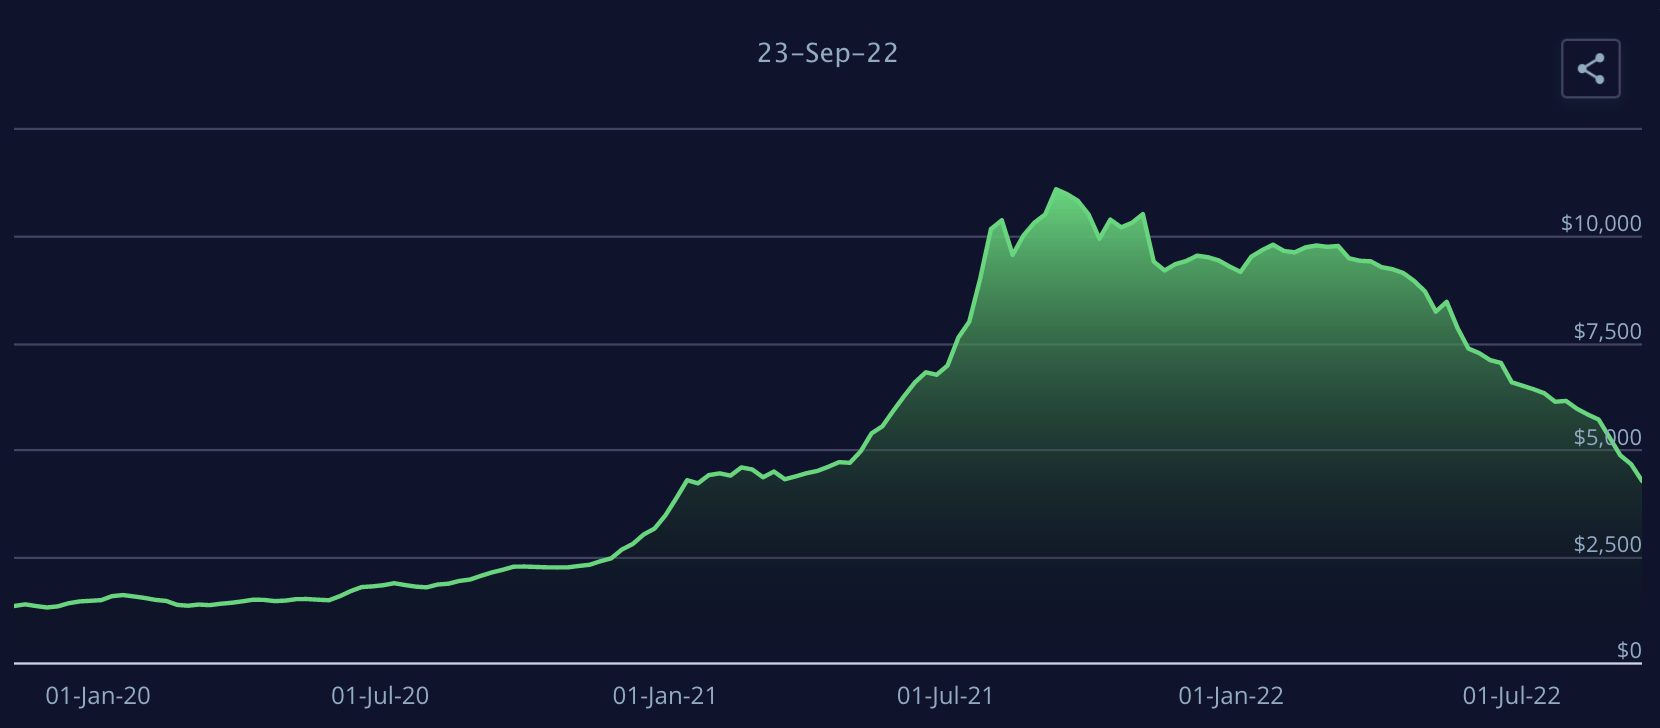
ZIM’s recent performance
In 1H22, ZIM delivered strong growth where revenue grew 73% YoY to $7.15 billion while the bottom line was exceptionally strong at a 43% net profit margin. EPS of $25.26 more than doubled vs. 1H21. In Q2, ZIM realized a freight rate of $3,596/TEU, which was down from $3,847/TEU in Q1 and represented the company’s first QoQ decline.
ZIM primarily operates in Transpacific and Intra-Asia. These regions have seen spot rates decline by 10-15% in the current quarter compared to Q2. Despite the softer outlook for freight rates, management maintained its full year EBITDA guidance of $7.8-$8.2 billion and EBIT guidance of $6.3-$6.7 billion. This comes down to an almost 50% operating margin on $13.11 billion in est. 2022 revenue.
The company paid $2.85 in dividends in Q1 and $4.75 in Q2, a larger payment given the retroactive adjustment of Q1 dividend payout from 20% to 30%. Assuming management does commit to a payout ratio of 50%, full year 2022 dividends will be $20.8/share on $41.6 est. EPS, implying $13.2 of dividends to be paid in 2H22. If the company pays $0 in dividends next year, the stock currently has a forward dividend yield of 54.7%.
Is everything already priced in?
One doesn’t need to be an economist to connect the dots between declining shopping rates and ZIM’s normalized future. While everything I’ve discussed in this article may have already been priced into the stock as the Street clearly expects earnings to decline significantly from $41.6 in 2022 to $11.8 in 2023, the key question here is to what degree has all the uncertainty been priced in? The stock may appear cheap at 2x 2023 P/E, but it’s important to note that trying to estimate earnings as the world is entering a recession is a highly uncertain exercise, so my sense is that forward estimates are subject to more downside risks than upside.
Another popular bull thesis is that ZIM’s current market cap of just $2.9 billion represents a significant discount to the company’s $5.2 billion book value as of 2Q22. However, the true value of ZIM’s assets may increasingly be in question as the industry heads into a downturn. The combined value of vessels, containers and handling equipment is roughly $5.7 billion, representing almost 50% of total assets. If the industry does step into a prolonged down cycle that resembles the 2008 recession, are these assets still worth the values stated on the balance sheet? In my view, this is not the type of situation where one can pull a Benjamin Graham type of investing strategy.
Doom and gloom aside, ZIM is not a stock to short at least from a technical perspective (it has already dropped 70%). From a fundamental standpoint, investors may be expecting better YoY growth in 2H22 as ZIM said volumes have improved in the current quarter. This could temporarily lift sentiment if 3Q22 results come in better than expected. Another upside risk is that port congestion could remain longer than expected, making spot rates more sticky.
Final thoughts
As much as ZIM may appear to be a deep-value, high-yield play trading at a significant discount relative to its book value, I believe there’s a good fundamental reason why the stock got to where it is today in the first place considering everything that’s going on. The shipping industry experienced one of the best boom times during the pandemic and is about to walk into a state of overcapacity in a slowing global economy. Despite the stock’s luxurious dividend yield and the attractive P/E, I’m seeing a value trap vs. an investment opportunity and would advise investors to not be greedy.
Be the first to comment