

freie-kreation/iStock via Getty Images
Investment thesis
ZIM Integrated Shipping Services (NYSE:ZIM) has lost about 18% since my last warning on October 21, 2022. As previously discussed in my scenario, the stock has tried to break out from its EMA50 but got firmly rejected on high selling volume. ZIM is now heading as expected toward its support at $18.70, leading me to assess the situation anew and give an update on my strategy. In this article I discuss two scenarios I see as most likely and investors could consider to be prepared for both eventualities.
A quick look at the big picture
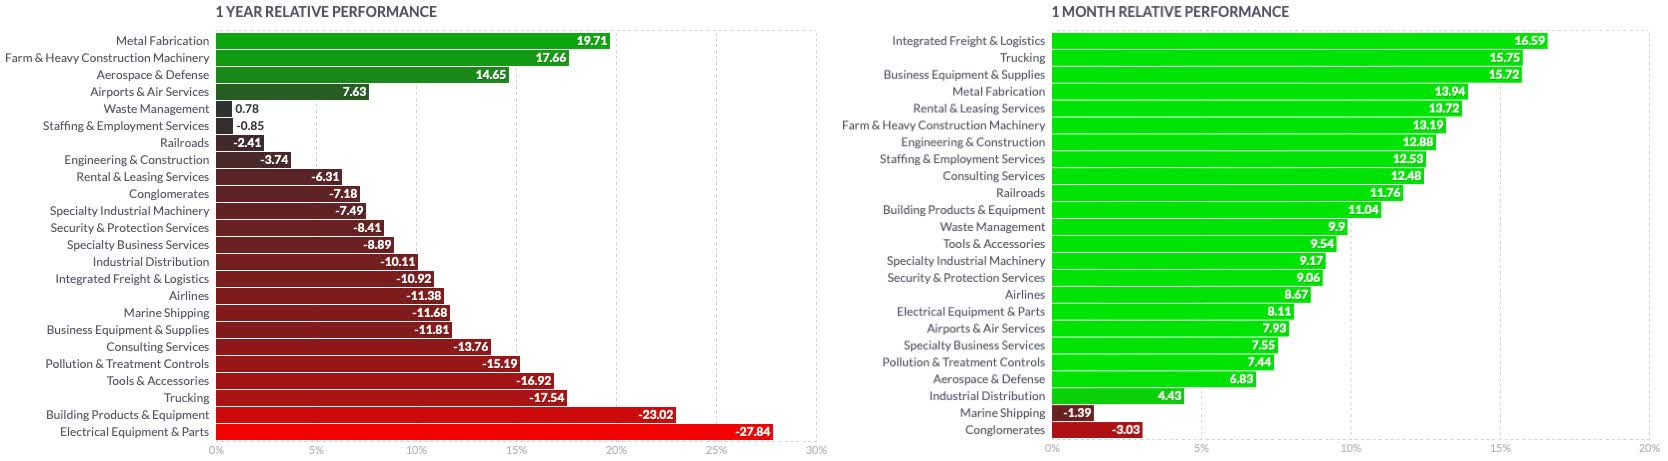
The US industrial sector has been more resilient than other sectors in the past year, reporting a relatively small loss in the past 12 months, while being among the stronger performers in the past few weeks. Companies in the integrated freight and logistics industry, the trucking industry, as well as companies offering business equipment and supplies led the sector’s rebound, while marine shipping companies are among the laggards in the past few weeks.
finviz finviz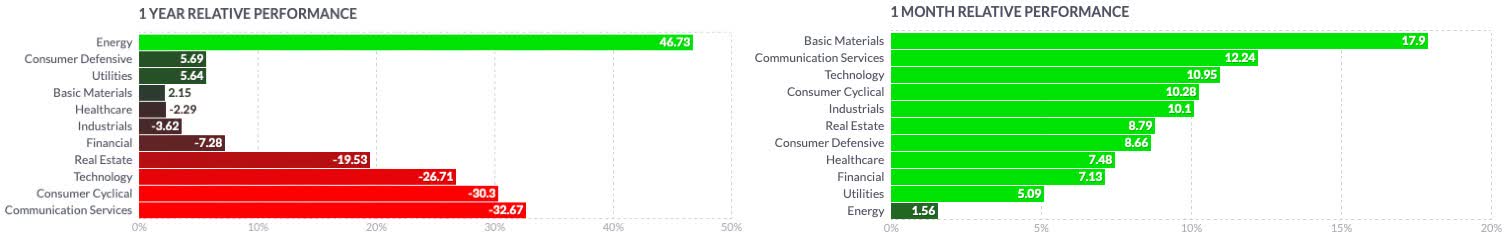
The following benchmark traces the average freight costs of containers in eight major routes, including spot rates and short-term contract rates. After the industry experienced a dramatic expansion in container freight rates during the initial shock caused by the COVID-pandemic, the global freight rates dropped to $3,100 in October 2022, from their peak recorded at $10,361 in September 2021.
Statista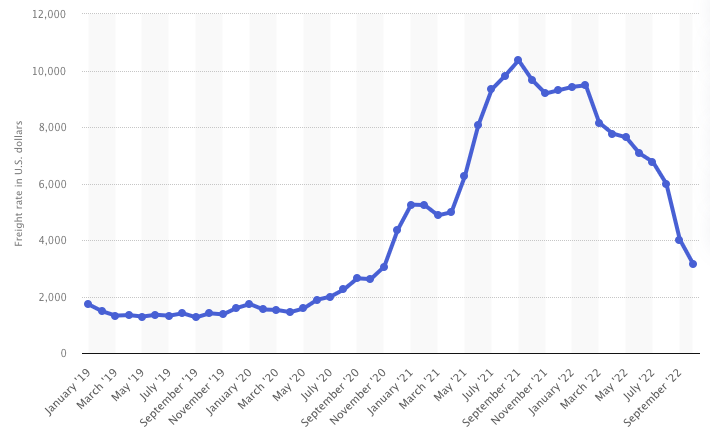
Considering more specific groups of the industry, the SPDR S&P Transportation ETF (XTN) which bottomed on September 26, 2022, has since returned 20% reaching its EMA200 on a daily time frame and its EMA50 on its weekly chart, until now without success in overcoming those two important resistances. XTN hasn’t been able to build up relative strength when compared to the broader iShares Russell 2000 ETF (IWM) and is hinting at further weakness while trading among important price levels which will determine its trend for the coming months.
Author, using TradingView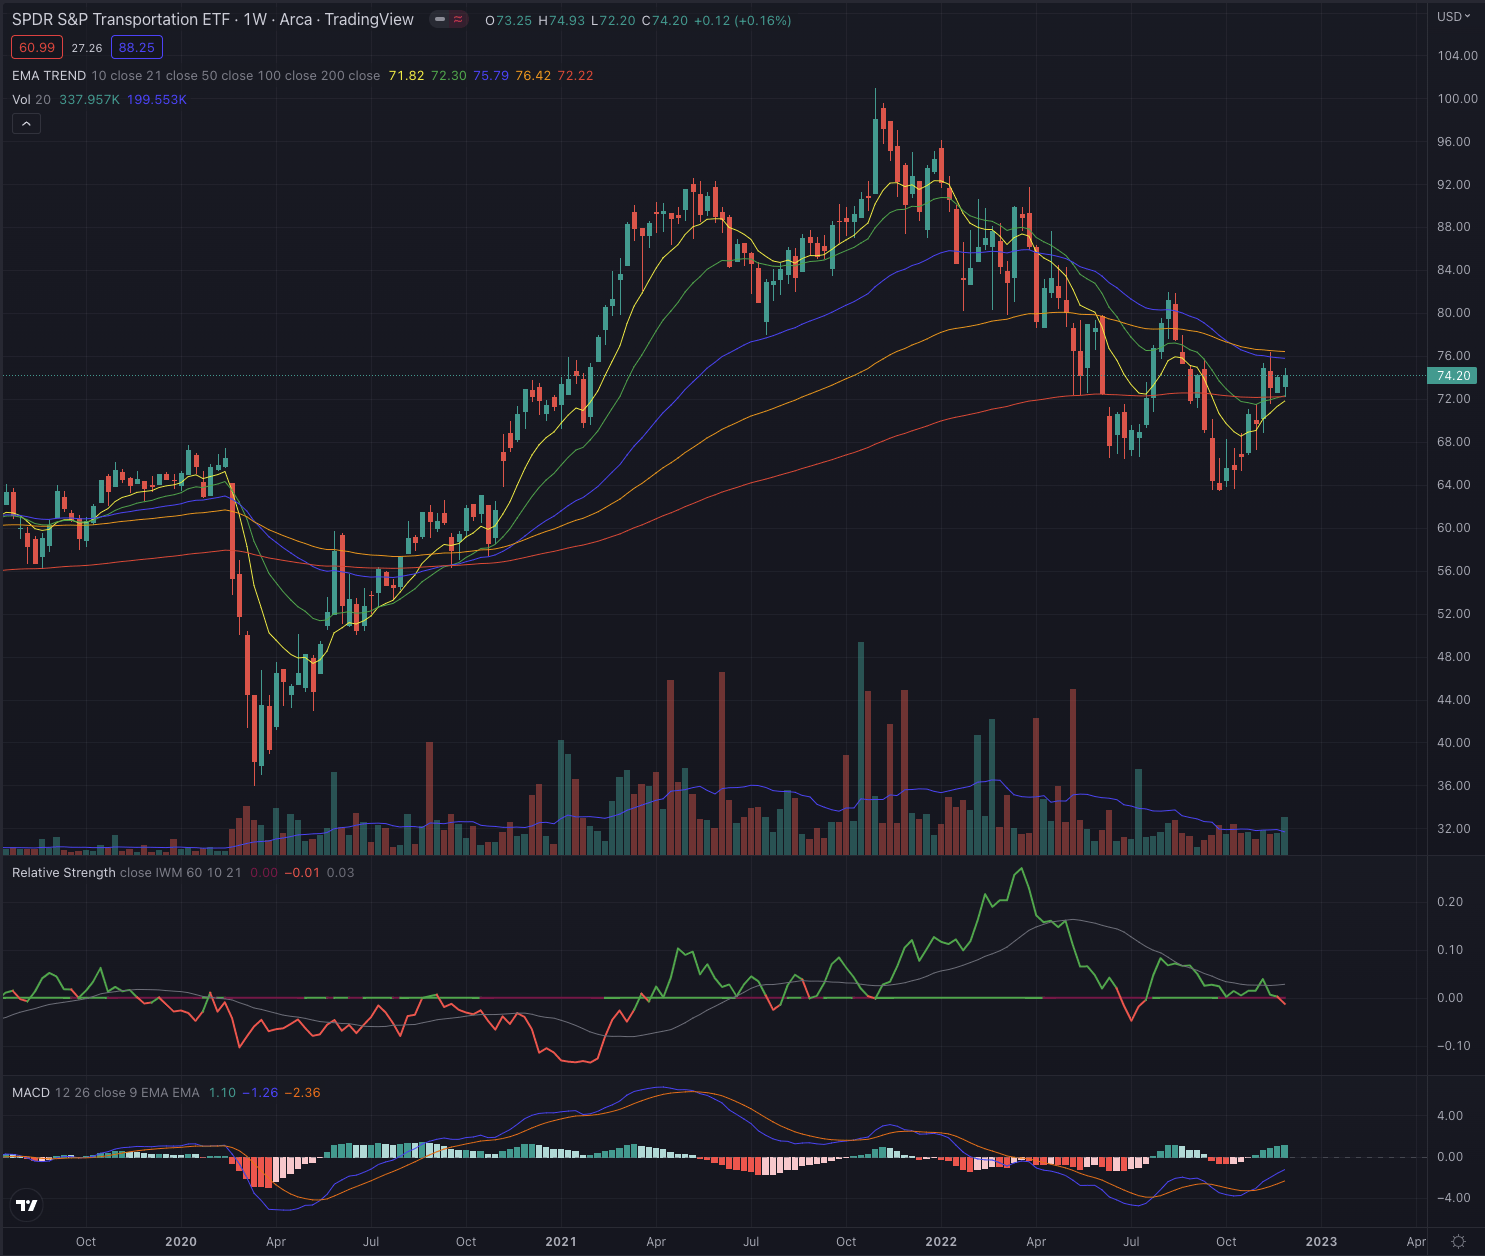
Where are we now?
In my most recent article “ZIM Integrated Is At High Risk Of Performing Even Worse” published on October 21, I discussed the risk of seeing the stock dropping further toward its most important support level, which I see at $18.70. I noted ZIM has failed in its Elliott Wave formation, as wave 4 overlapped the territory of wave 1, a situation that I observed is most likely leading to a continuation of the movement after wave 5. I also discussed a likely short-term reversal, as I saw as likely that some short positions would have to be covered, which effectively happened, as the short interest dropped about 10% from the end of October to mid-November, while the stock tried to break out from its EMA50.
Author, using TradingView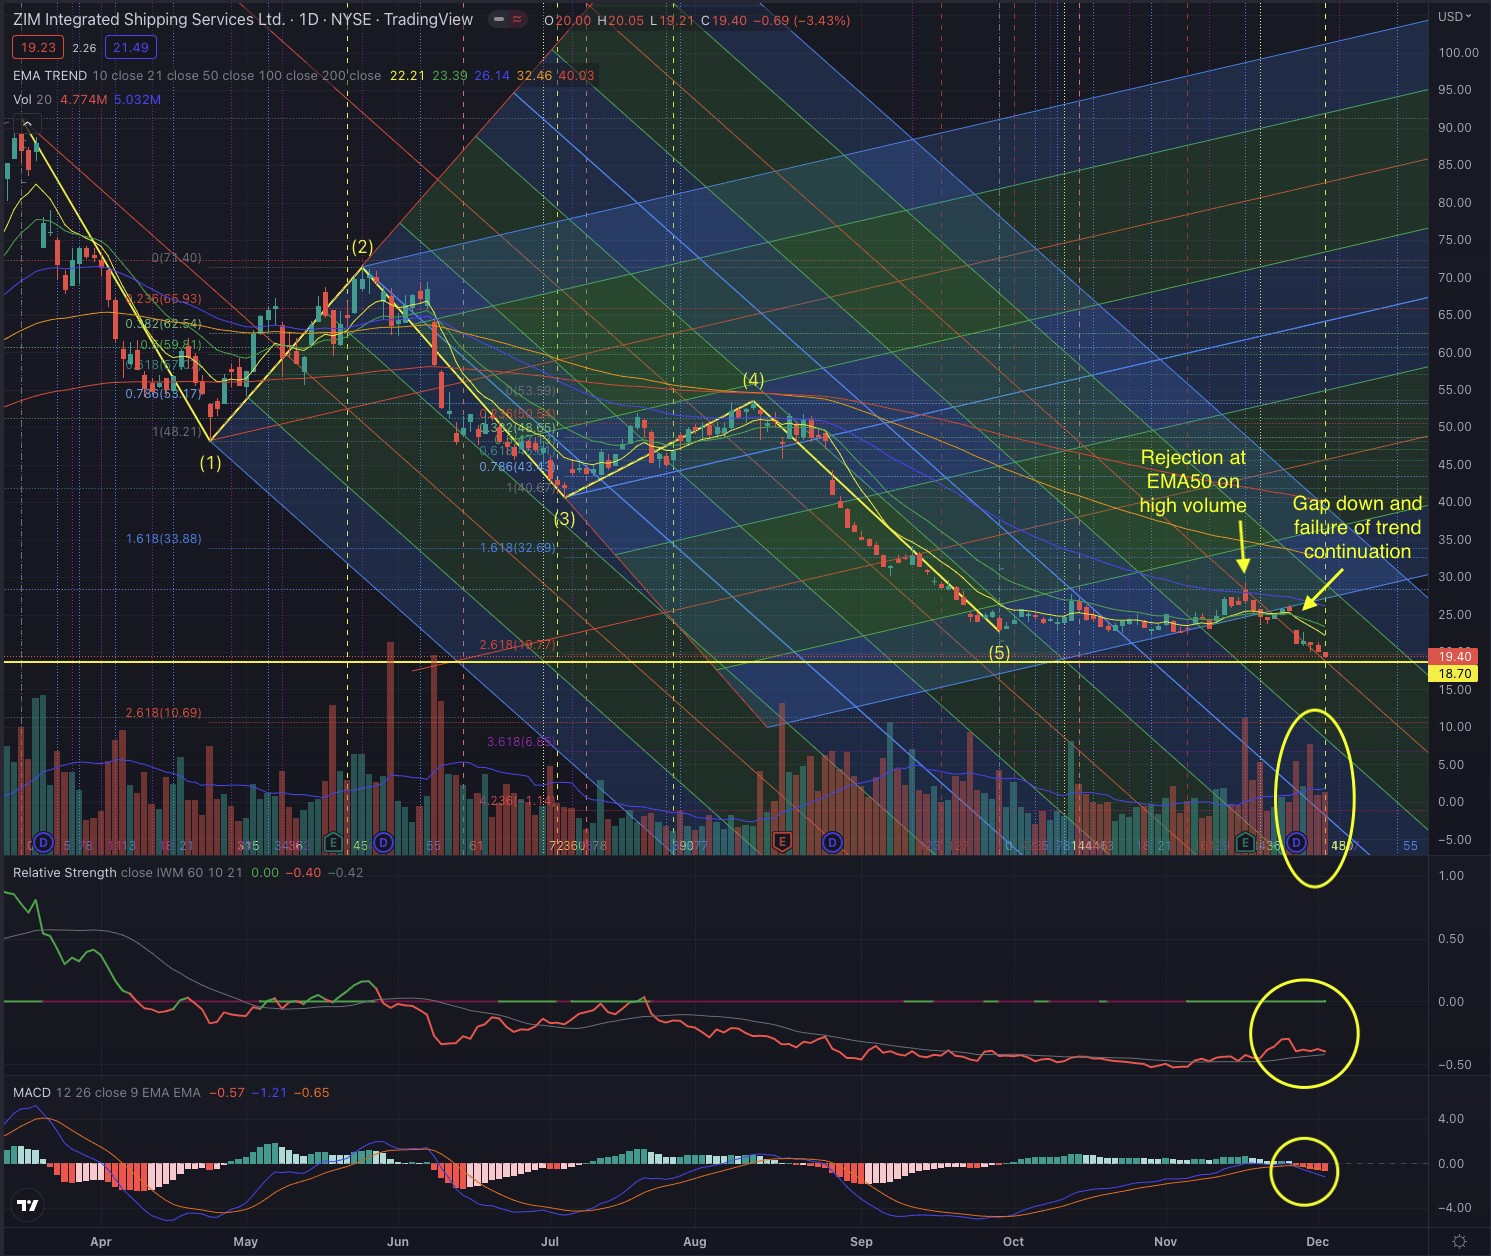
The rejection at its medium-term moving average has been marked by a massive increase in sell-side volume, and the stock successively even reported a significant gap down on its ex-dividend day, without recovering from it, on significantly higher sell-side volume. ZIM is still in stage 4, and as the stock is approaching the mentioned target, I want to give an update on my considerations of likely developments.
What is coming next?
The stock has reached its second Fibonacci extension measured from the last rally that formed wave 4 and is not giving any signs of a slowdown of its downtrend, while being incapable of building relative strength, and with increasingly high distribution days. In this type of situation, no one knows where the stock will stop its descent and bottom fishing is not something I consider, as something purely related to luck, instead of being based on quantitative metrics or supported by calculated risk management.
Author, using TradingView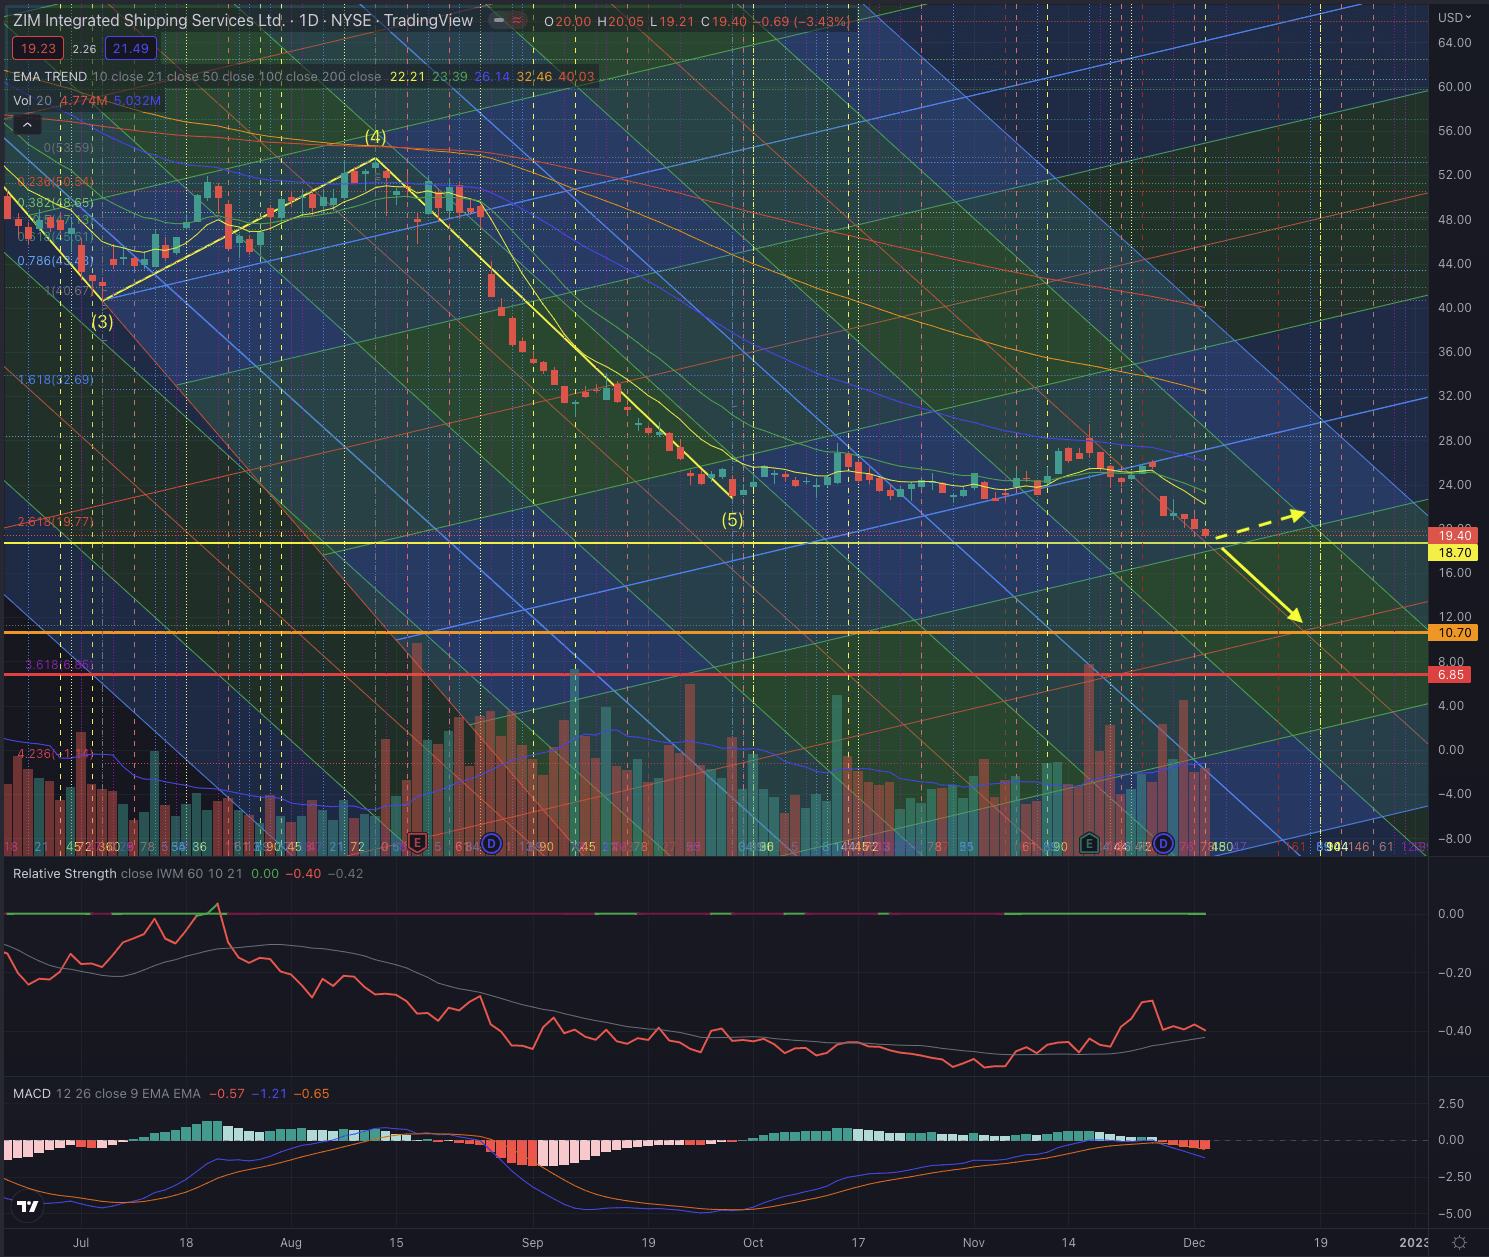
I, therefore, consider two scenarios that I would implement in my contingency plan.
-
The most likely scenario considering the actual technical parameters is seeing the stock reaching its support level at $18.70 and likely dropping under it in direction of its next most likely price level, determined by its wave 2 Fibonacci extension at $10.70. Despite this drop would mean losing up to 45% from its latest closing price, the stock has no other significant support level in between, and it could even drop further until $6.85. Therefore, if the stock breaks under $18.70 and confirms its drop, there would be no reason to keep the stock any further than it always can be bought back once it turns and signals a reversal in its trend.
-
The second scenario would see the stock bottoming around its support at $18.70 and progressively tracking its ascending trending channel, while we would see its moving averages slowly flattening, allowing the stock to form its stage 1. In this type of scenario, until the stock would be in its downtrend, I would certainly not add any positions or enter the stock as a new investor, but I would also not sell as a shareholder. It would be of utmost importance to monitor the price action to make sure the stock would not break down, as this would lead again to scenario 1.
The stock is approaching the support level on two important converging Gann time units while also counting 260 days from its ATH, something I consider when evaluating important price levels, as it often coincides with important changes in the price action. Although it is early to make any conclusion on a pivot point or a continuation of the downtrend, it hints at a likely important time window.
As uncertainty in ZIM’s stock is increasingly high, it is essential to set up appropriate risk management. Investors who followed my last warning could avoid a drop of about 18%. While the company is popular for its high dividend yield, it doesn’t mean that investors have to continually hold the stock in a downtrend, as those losses could take an extended time to recuperate if the stock ever recovers, and the actual forecast, despite being rather uncertain, sees the profitability massively dropping through 2024.
The bottom line
Technical analysis is not an absolute instrument, but a way to increase investors’ success probabilities and a tool allowing them to be oriented in whatever security. One would not drive towards an unknown destination without consulting a map or using a GPS. I believe the same should be true when making investment decisions. I consider techniques based on the Elliott Wave Theory, as well as likely outcomes based on Fibonacci’s principles, by confirming the likelihood of an outcome contingent on time-based probabilities. The purpose of my technical analysis is to confirm or reject an entry point in the stock, by observing its sector and industry, and most of all its price action. I then analyze the situation of that stock and calculate likely outcomes based on the mentioned theories.
While it is early to determine which of the discussed scenarios is more likely to form, I would certainly continue to closely observe the price action and follow my contingency plan, as the higher volatility in the markets is hinting at an elevated risk of possible further losses. ZIM is in an extended downtrend and every attempt to break out of it has been rejected. The stock is, once again, at high risk of performing even worse, but this time the downside risk is even higher than discussed in my former article if the stock breaks under its support level at $18.70. Until the stock keeps above this level, I rank ZIM as a hold, but would certainly sell the stock if it would consistently break under the support.
Be the first to comment